What's New in Version 6.3
Introduction
Welcome to MotiveWave™ version 6.3! This document will outline the features that have been added between version 6.2 and version 6.3.
Studies
Here are the new and updated studies.
Order Heatmap
The Order Heatmap study replaces the existing DOM History study.
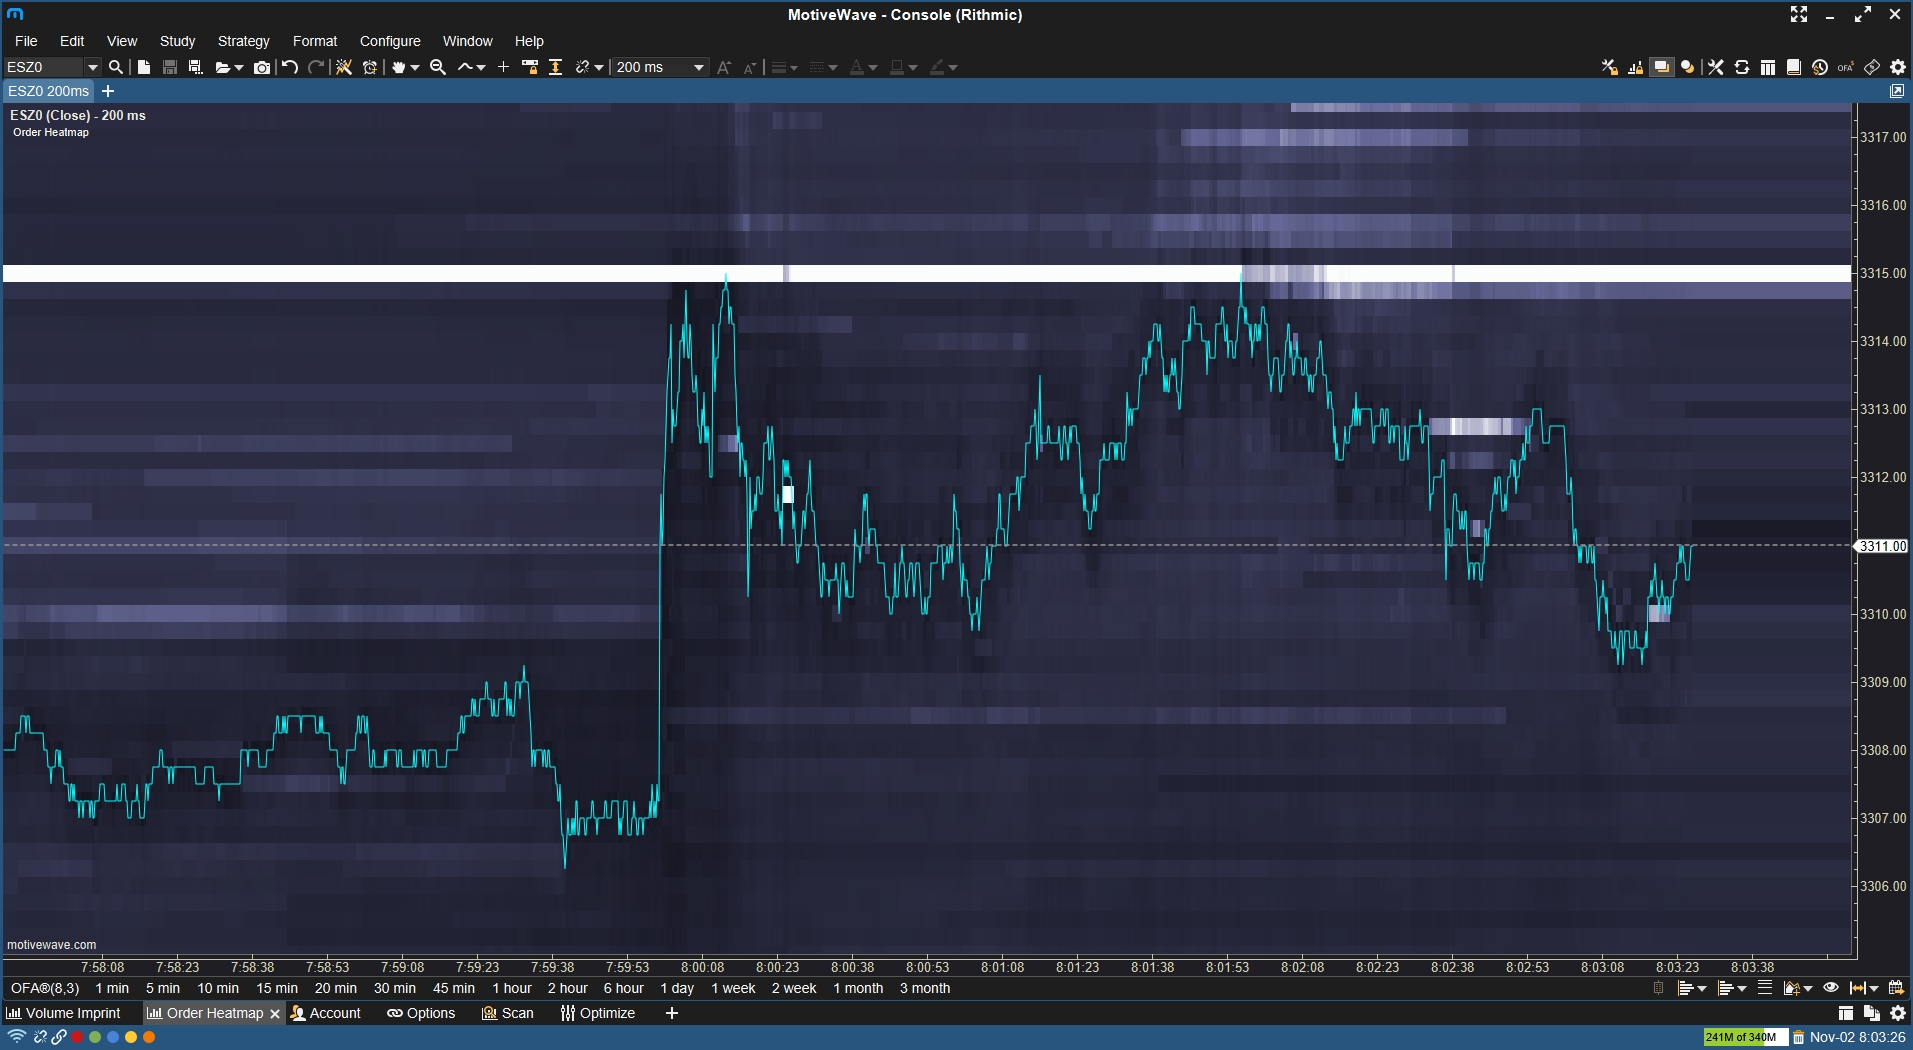
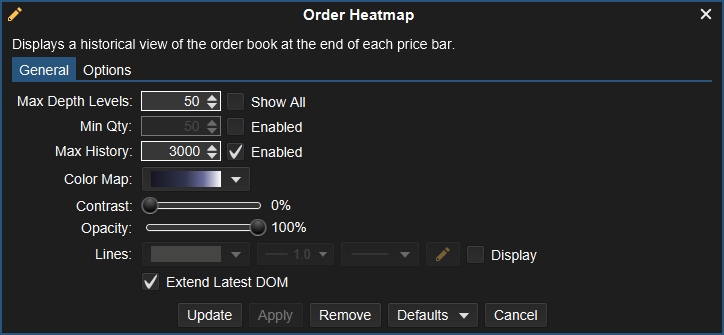
Here are the available options:
Max Depth Levels – Limits the depth levels for better performance.
Min Qty – Set a minimum depth level quantity that will display color shading.
Max History – The maximum history of levels, decrease this for better performance.
Color Map – Allows you to customize the color map.
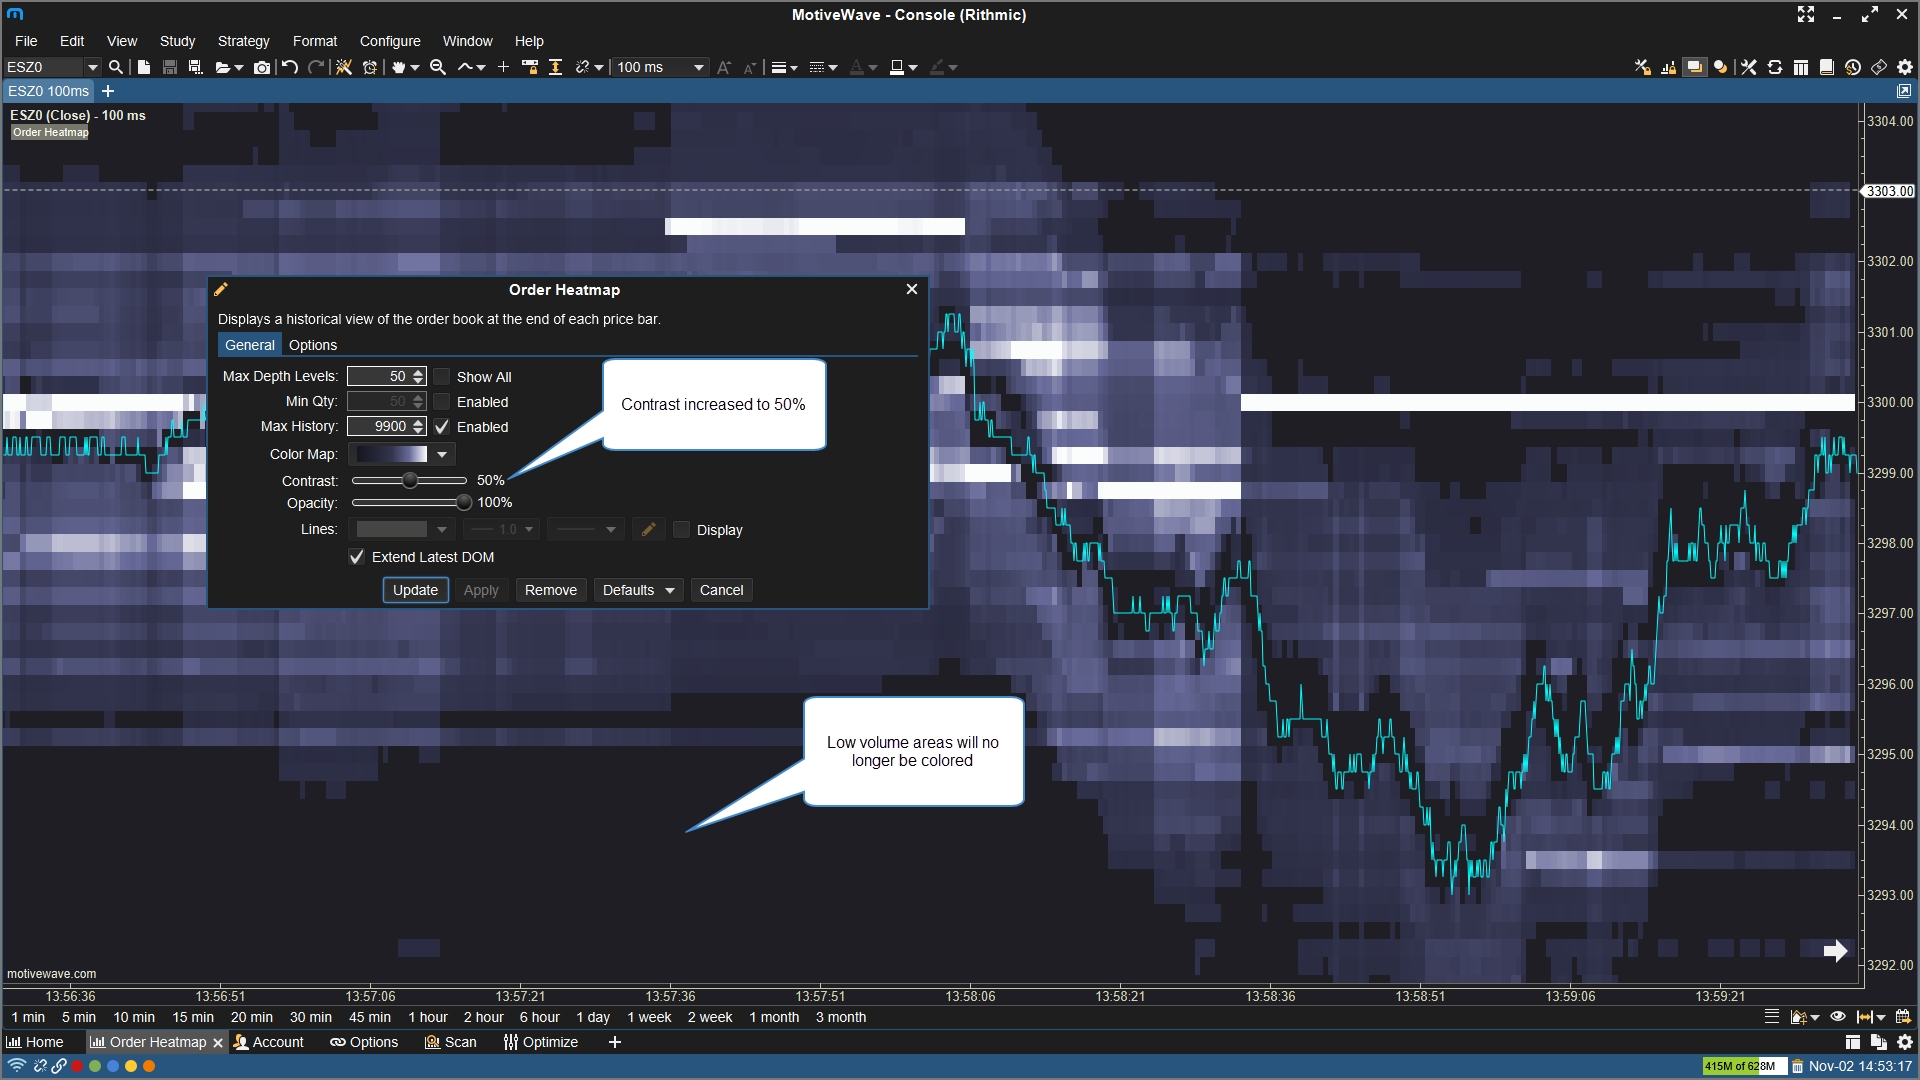
Contrast – Adjust the contrast, higher contrast will remove lower depth levels.
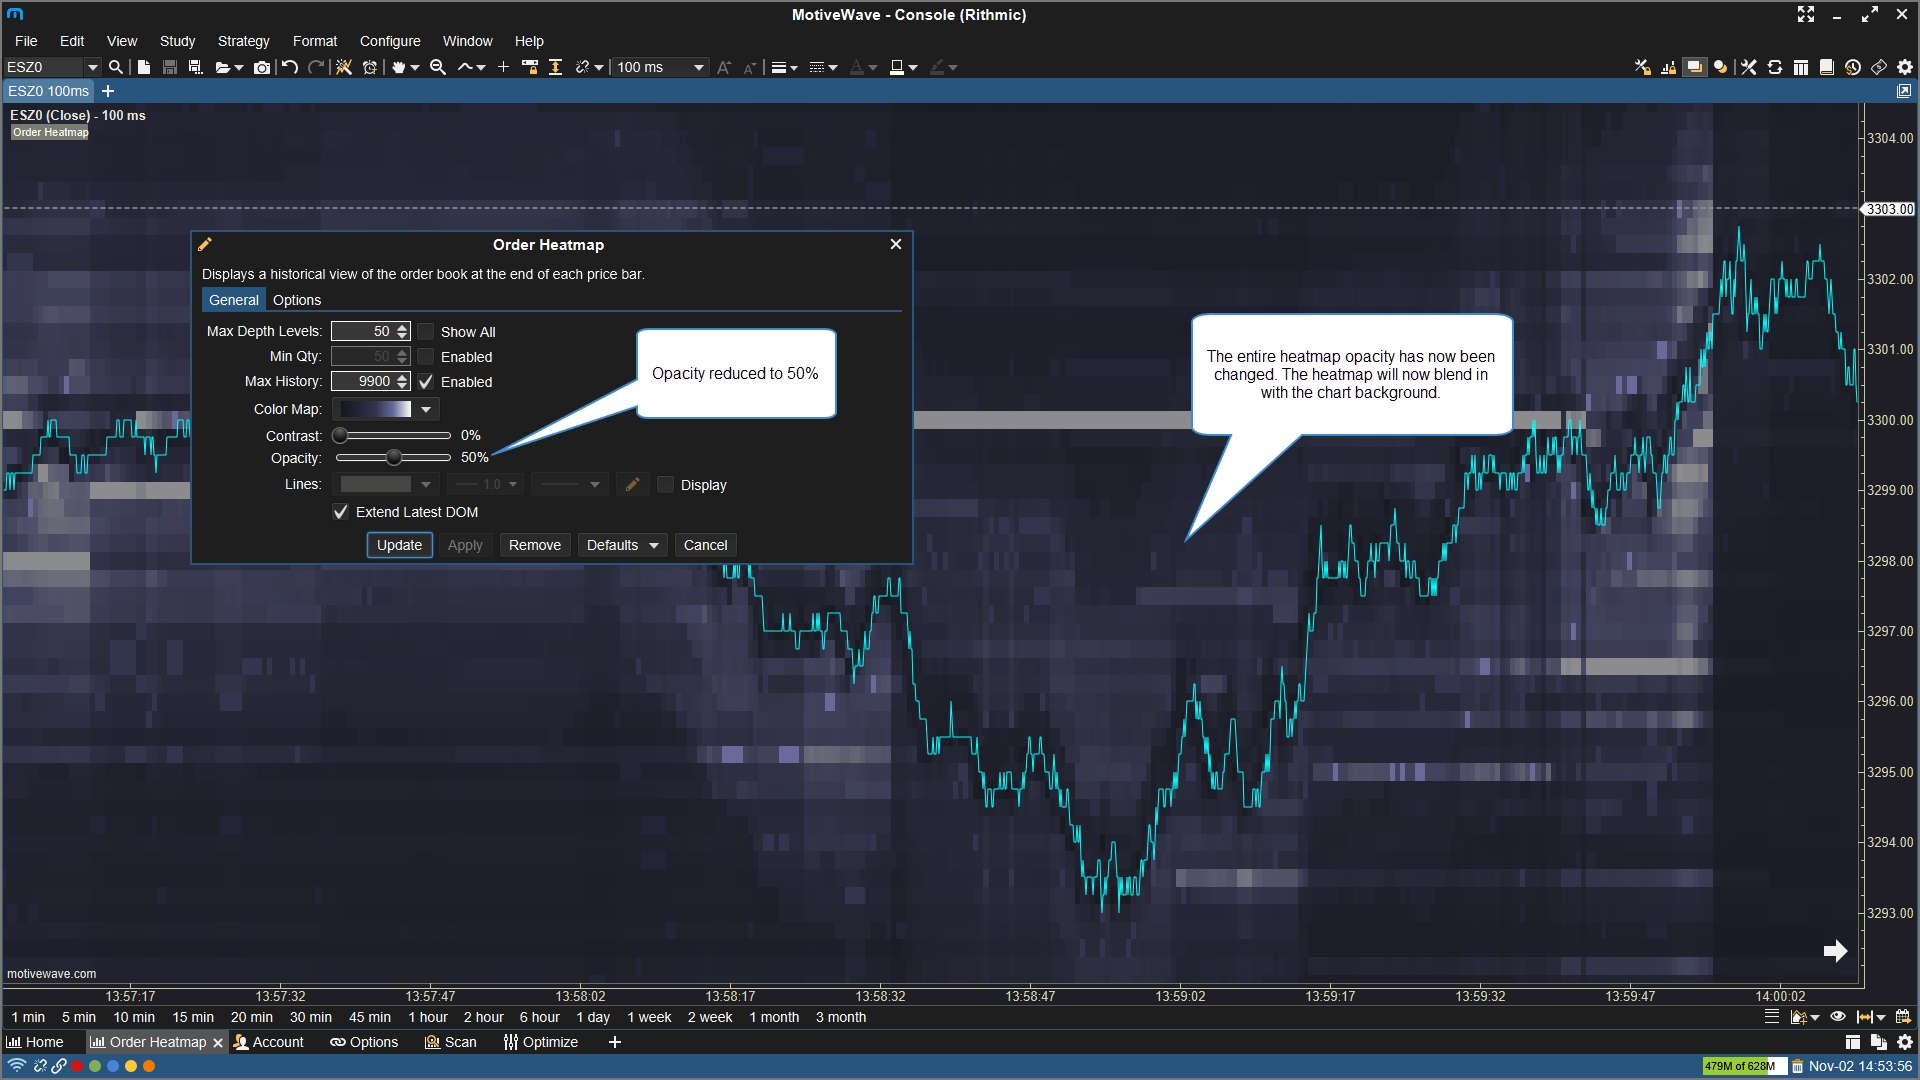
Opacity – Adjust the opacity of the heatmap to allow it to blend in with the chart background.
Extend Latest DOM – Extend the heatmap forward.
The Color Map can be customized with a gradient of colors, they are ordered from low volume to high volume in the color selector:
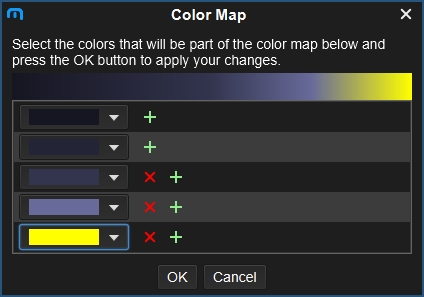
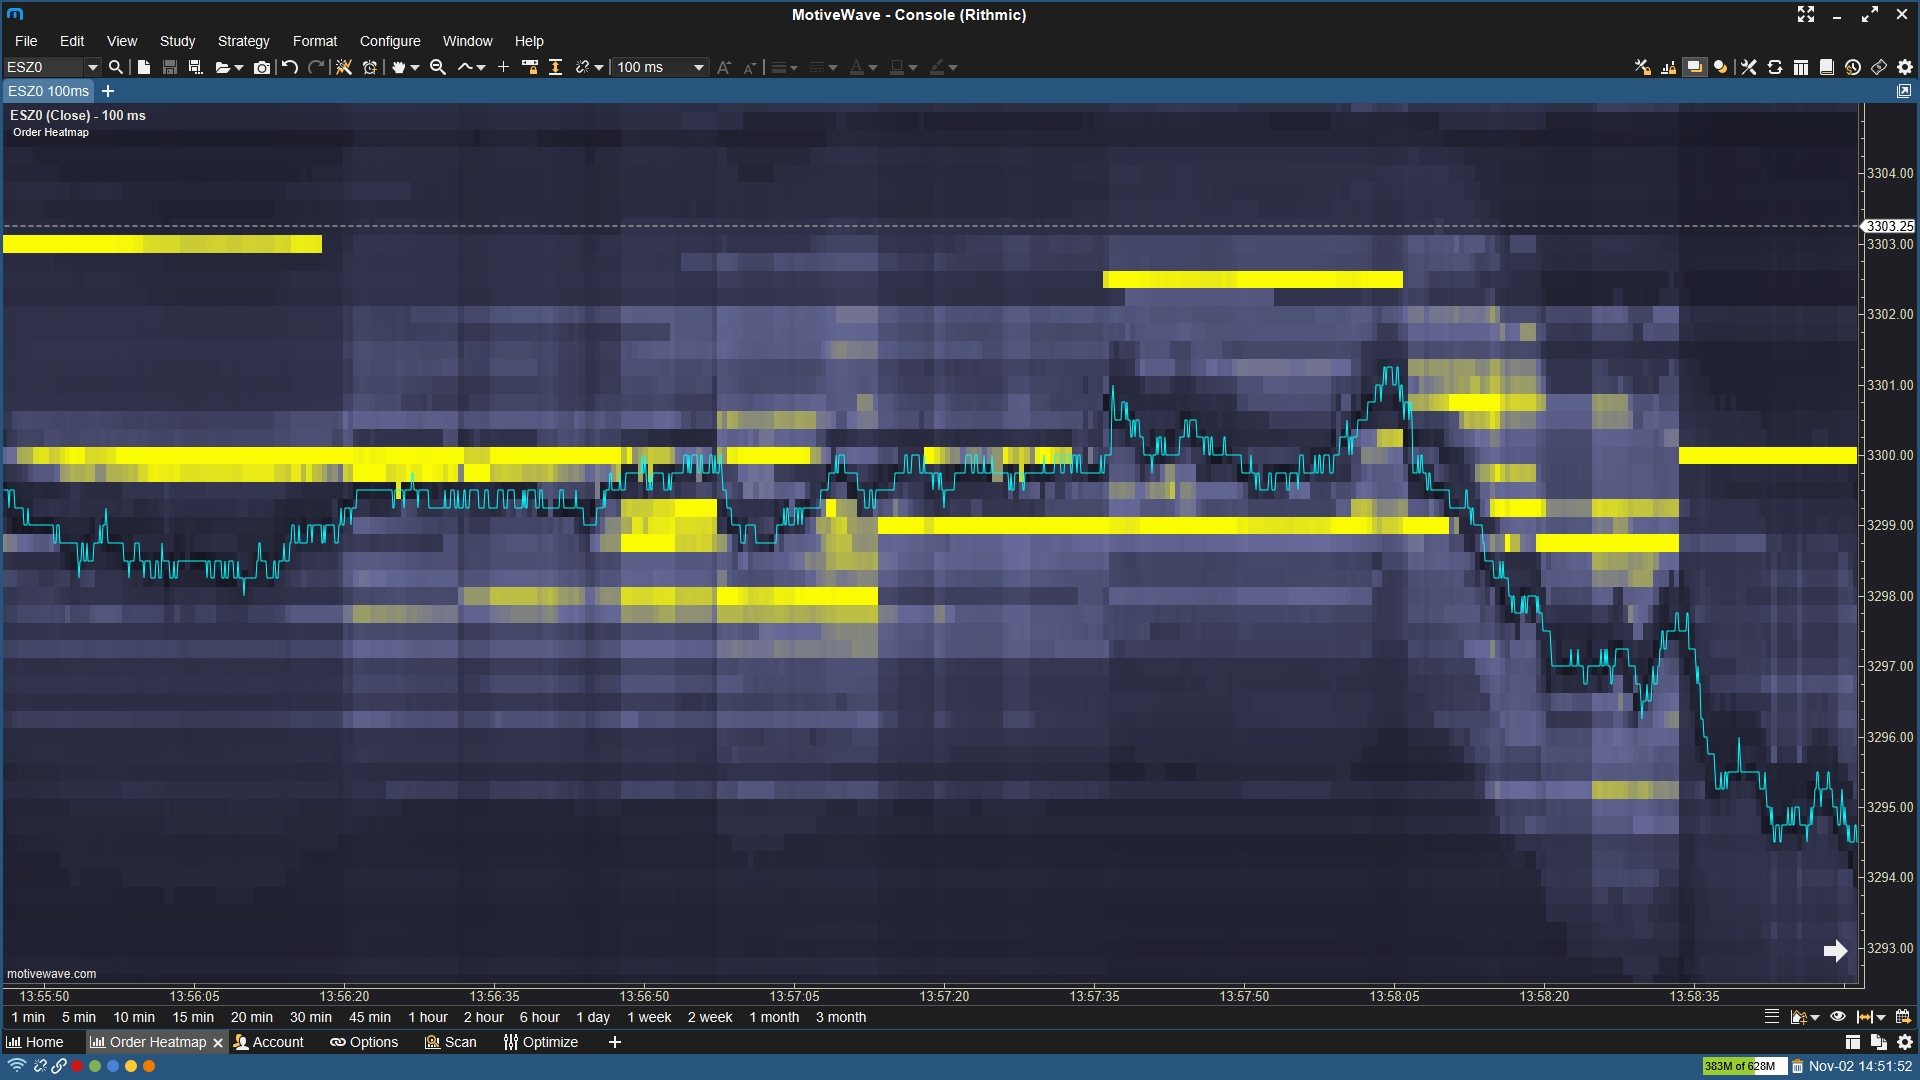
In the example below we have changed the high-volume areas to be colored in bright yellow so they stand out from the low volume areas:
Increasing the Contrast setting will remove low volume areas so you’re able to concentrate on high volume areas only. In the example below I have increased contrast to 50% which has removed the low volume depth levels.
Decreasing the Opacity setting will allow the heatmap to blend in with the chart background. In this example I’ve decreased the opacity to 50%:
Big Trades
The Big Trades study has been updated.
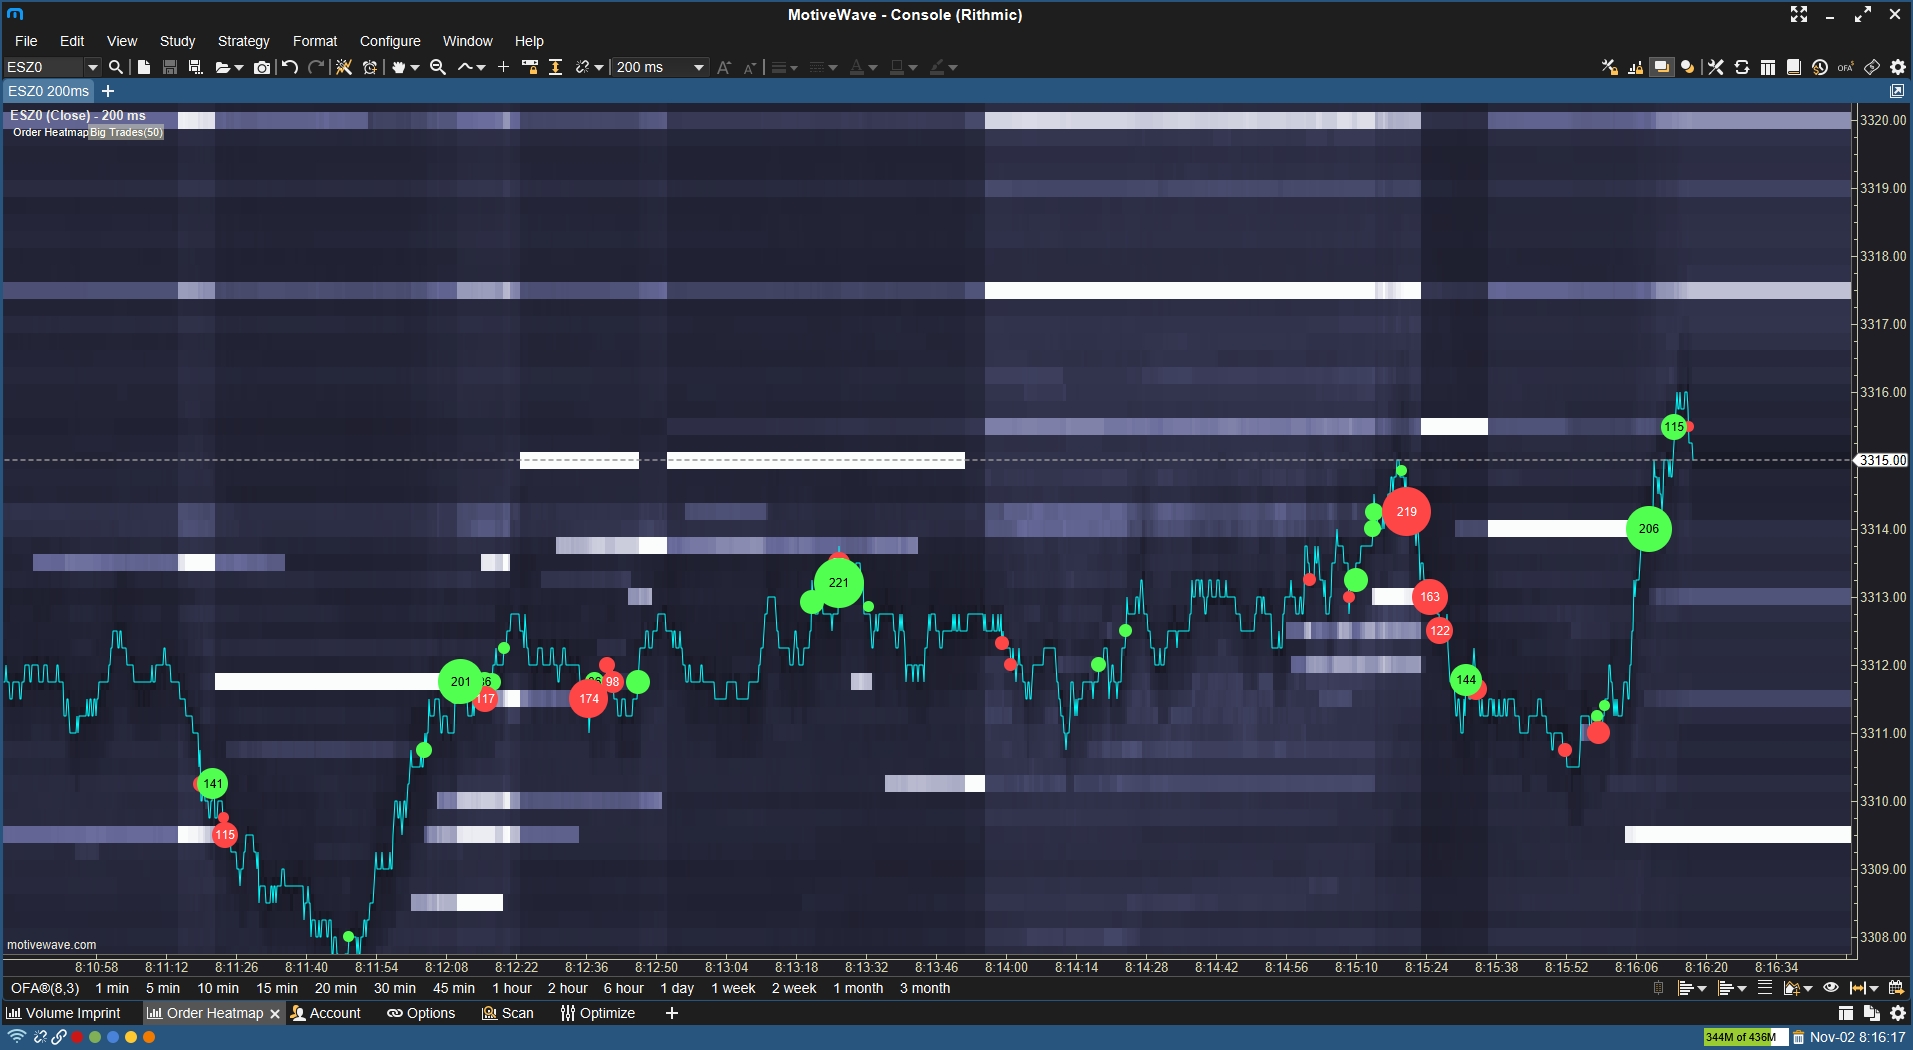
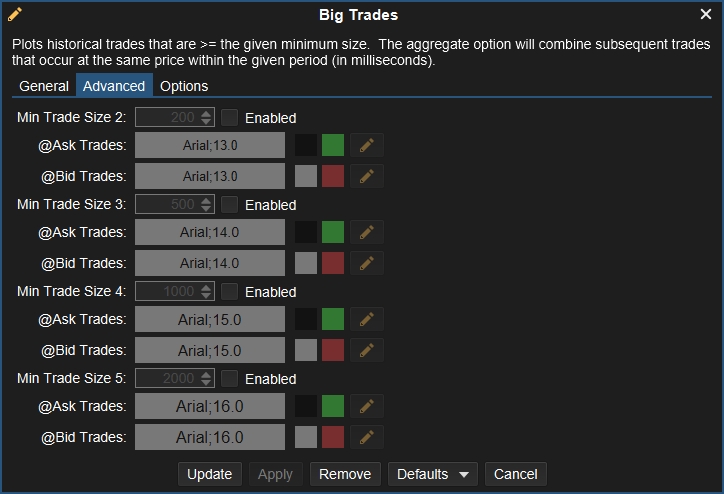
Here are the options available:
Aggregate Period – Aggregate orders that are within the specified interval.
Aggregate By Order – Use Market By Order to aggregate by order number.
Outline – Auto Circle has been added which will automatically size the trade circles according to trade size. All other options will use the Advanced tab settings for trade circle size.
Max Circle Size – Only applicable for the Auto Circle outline.
Max Days – Limit the amount of data that will display for this study.
Min Trade Size – Sets the minimum quantity for a trade to be displayed.
Cloud Levels
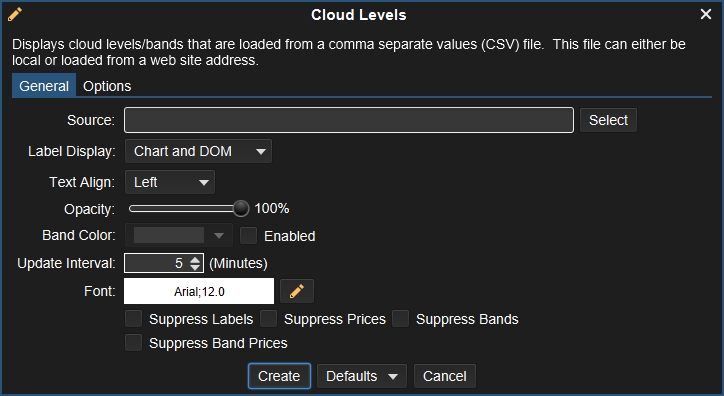
This new study displays cloud levels/bands that are loaded from a comma separated values (CSV) file. This file can either be local or loaded from a website address. This study can be used for subscription services that provide levels/bands.
Current supported formats include: Investor/RT (CSV) and Bookmap (CSV). More formats may be added in the future.
OHLC
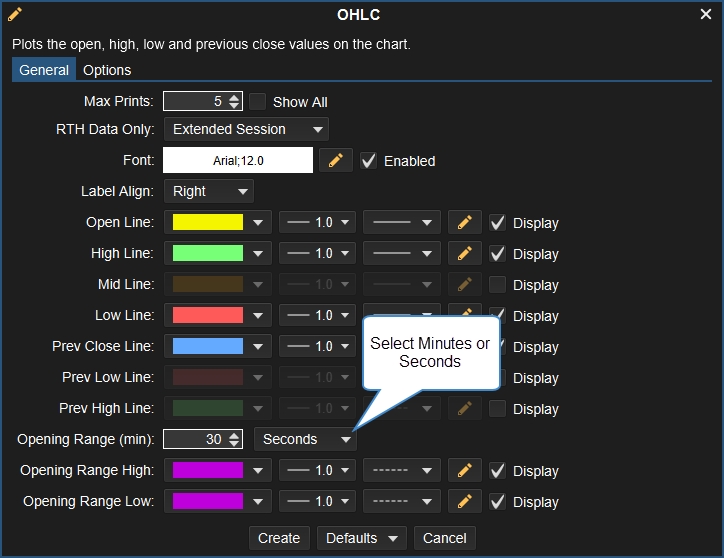
The OHLC study now has an option to set an Opening Range in seconds:
Trade Report
Generates a report that can be filtered by account, instrument, and date. The Trade Report also works for Replay Mode accounts and it can estimate commissions for live accounts (set up commissions in the Edit Instrument dialog).
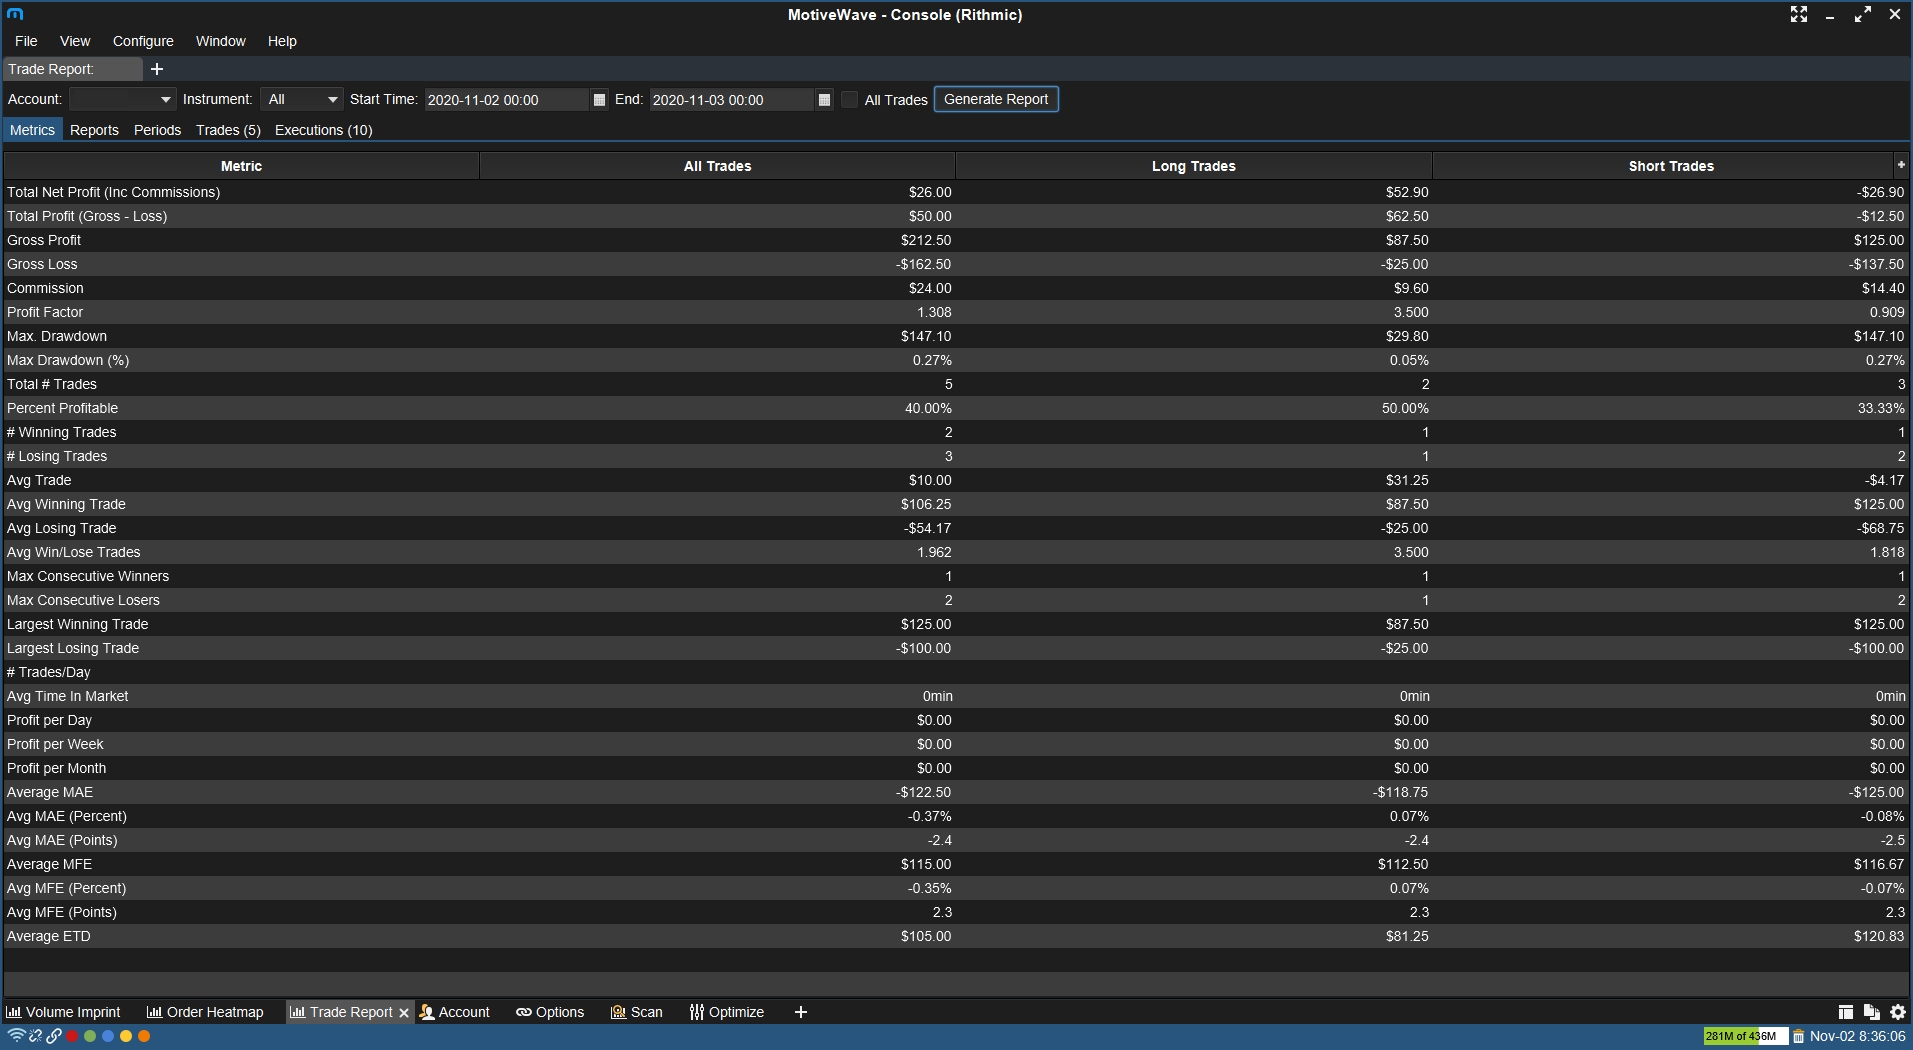
Most of the metrics are self-explanatory, here are a few which may not be:
Profit Factor – Gross profit divided by gross loss.
Max Drawdown – Largest drawdown from equity peak to subsequent equity low.
Average MAE (Maximum Adverse Excursion) – How far on average a trade will go against you.
Average MFE (Maximum Favorable Excursion) – How far on average a trade will go in our favor.
Average ETD (End Trade Drawdown) – How much profit you give back until you exit the trade. The calculation is MFE – Actual exit price.
Creating a Trade Report
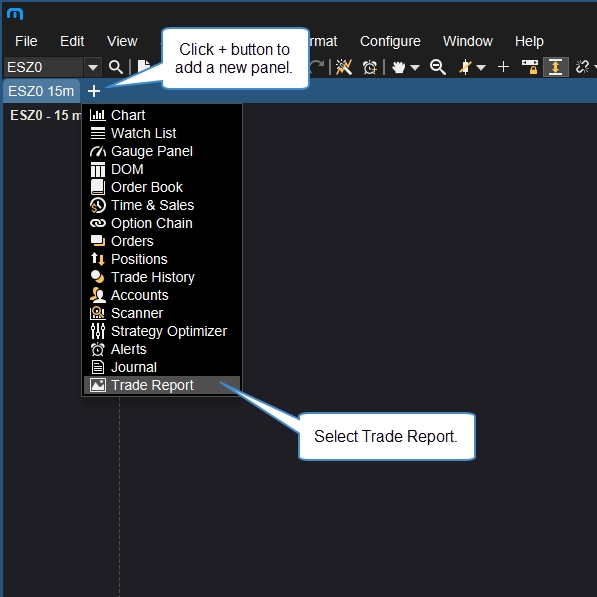
A Trade Report tab can be added by clicking the + button to the right of a chart tab. In this drop-down menu you can then select Trade Report.
To generate a trade report, select an Account, Instrument (All can be selected), and your desired dates/times (All Trades set by default). Click the Generate Report button to show the results.

You can now view your Trade Report stats by selecting the tabs (Metrics, Reports, Periods, Trades, and executions).

Reports in Replay Mode
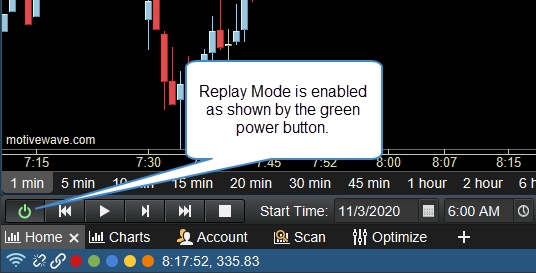
The Trade Report can also be used for Replay Mode trades. Please note, Replay Mode will need to be enabled to be able to generate a report from a Replay Mode session. Once you disable Replay Mode, the trades will no longer be available.
Continuous Futures
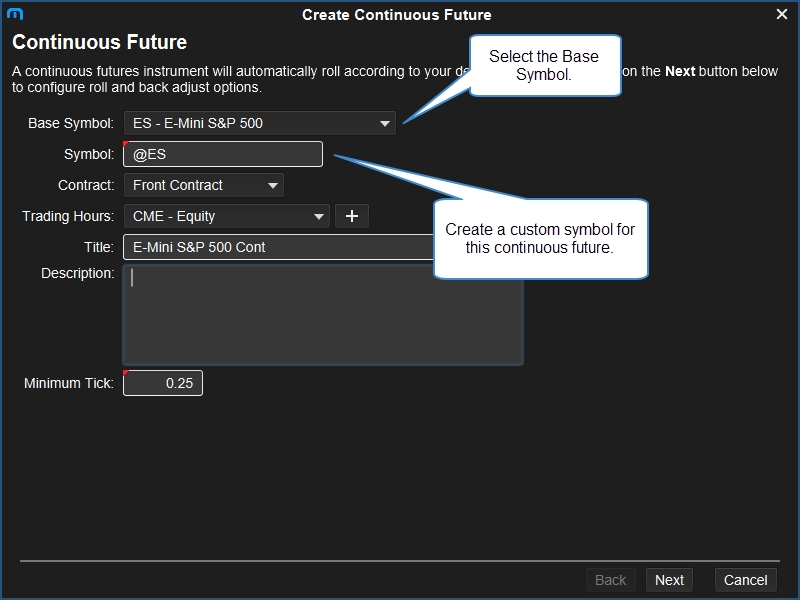
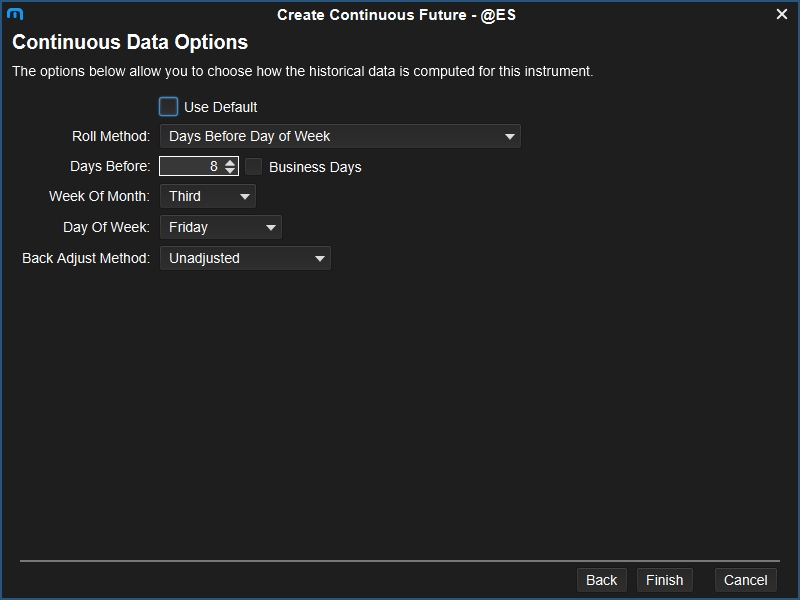
Added support for custom internal continuous contracts that automatically roll based on your selected rollover settings. Choose File > New > Continuous Future to create a new instrument.
Create Continuous Future
Active Contract
You can display which contract is being used for the Continuous Future in two locations:
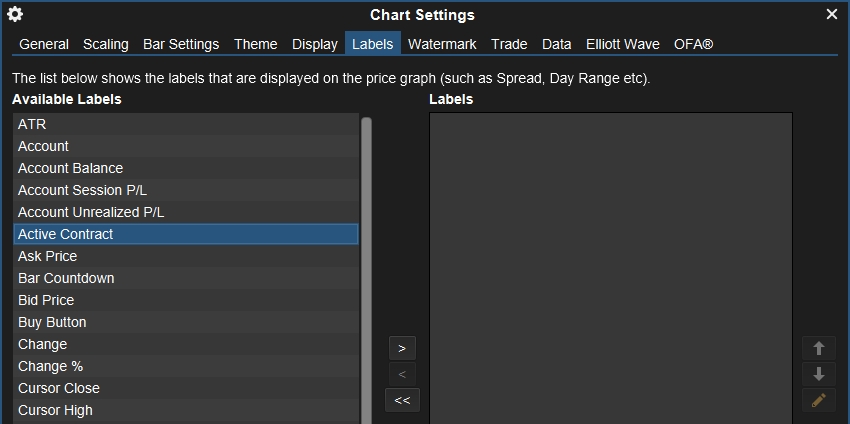
Chart Label – A new chart label has been created for this. See Chart Settings > Labels tab.
Watch List – A new column “Active Contract” has been added to the Watch List, Quote Sheet, Quote Board, and Buy Sell Boxes.

Futures Roll Options
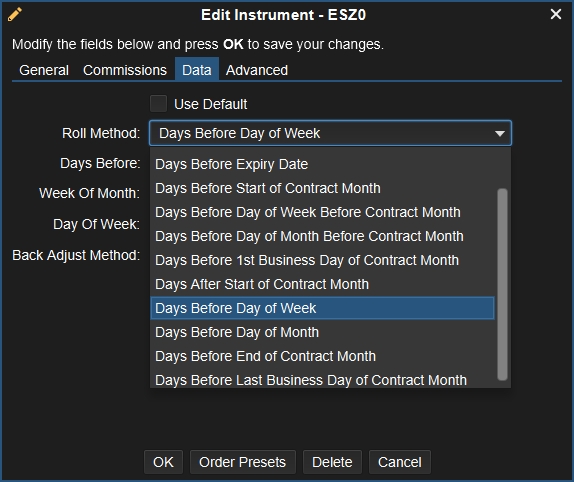
Additional futures rollover options have been added. These new options are for date-based rollover and are now the default rollover option for most major futures contracts. New options include:
Days Before Start of Contract Month
Days Before Day of Week Before Contract Month
Days Before Day of Month Before Contract Month
Days Before 1st Business Day of Contract Month
Days After Start of Contract Month
Days Before Day of Week
Days Before Day of Month
Days Before End of Contract Month
Days Before Last Business Day of Contract Month
Millisecond Bars
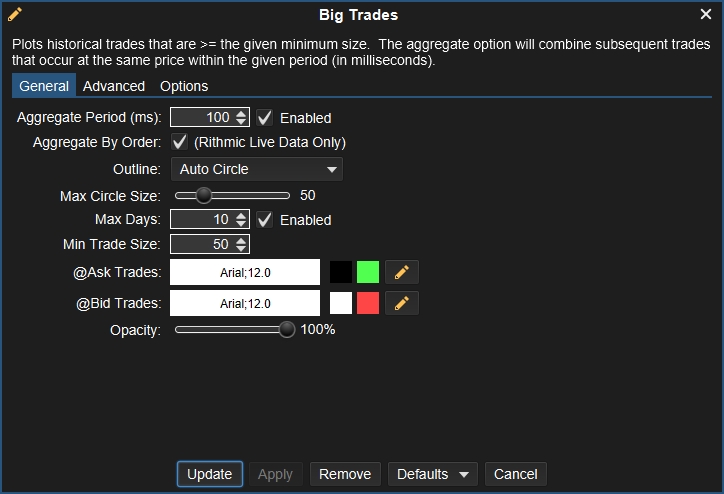
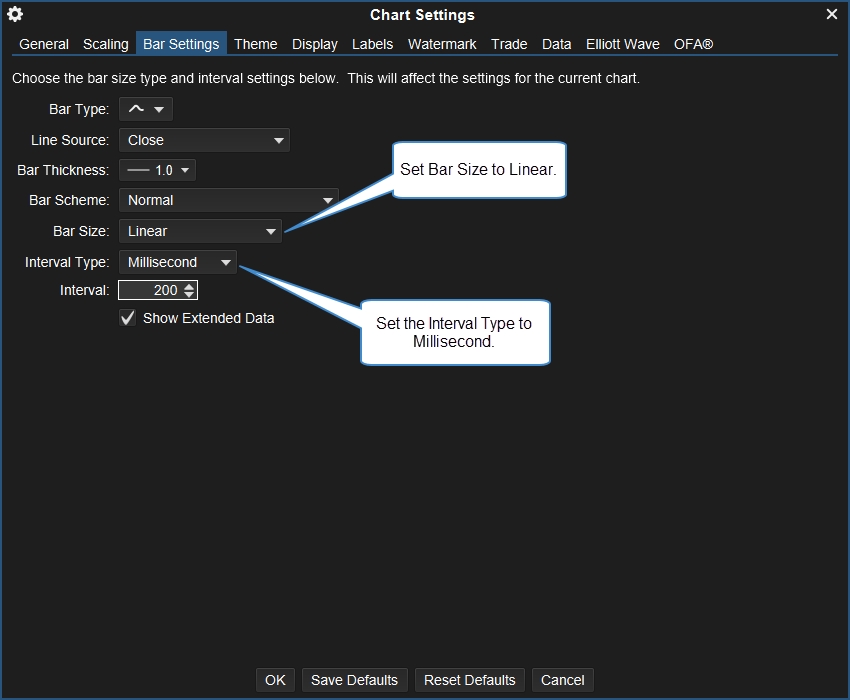
Bar sizes can now be specified in milliseconds (minimum 20 ms). This bar type is best used with the Order Heatmap study to create a continuously scrolling chart for order flow trading.
Auto Move Bar
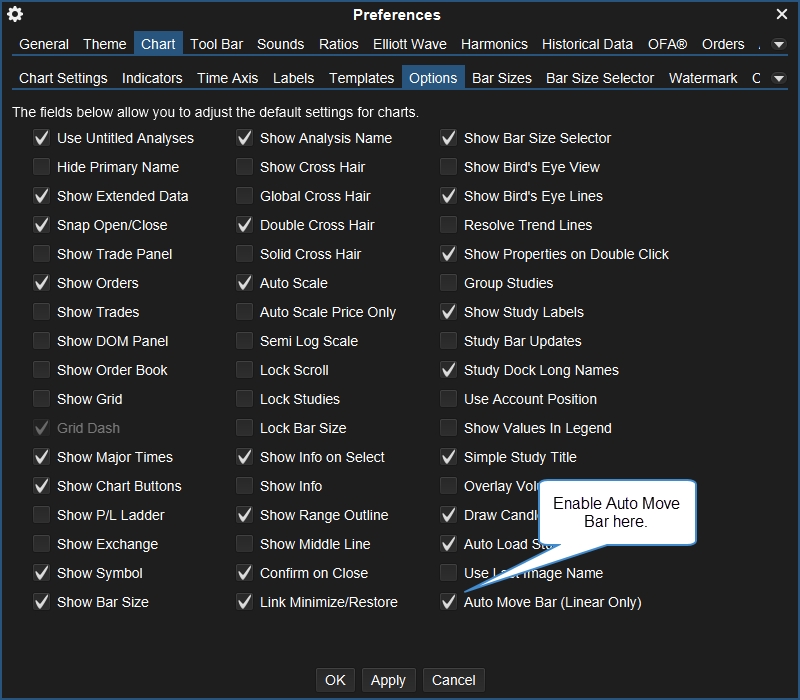
If enabled, this option will automatically create the next bar when the time has elapsed (instead of waiting for the next bar). This is especially useful for millisecond bars (see above) to show a continuously moving chart. See Configure > Preferences > Chart > Options.
Other Enhancements
Here are some other enhancements added between version 6.2 and 6.3:
Time and Sales Aggregate by Order
Added the option to “Aggregate by Order” using Market by Order (currently only offered by Rithmic). If enabled the time and sales entries will be combined if the aggressor exchange order IDs and price match. This applies to consecutive trades only.
Square Line Bar Type
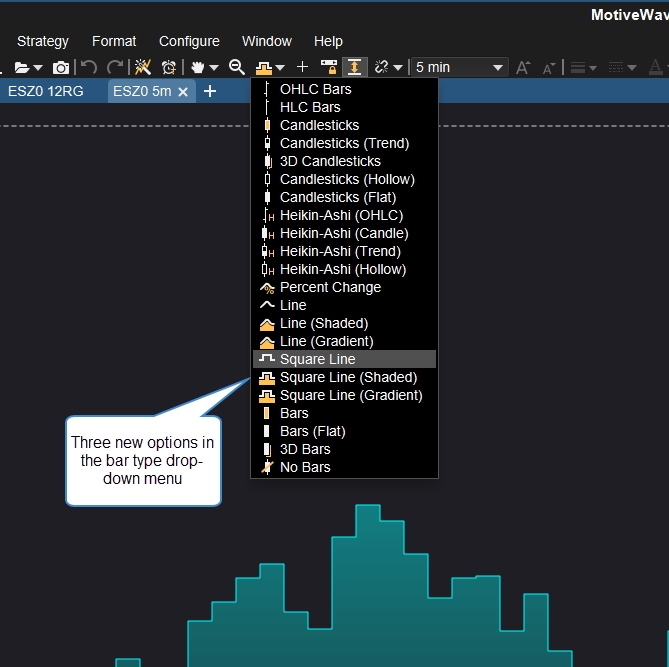
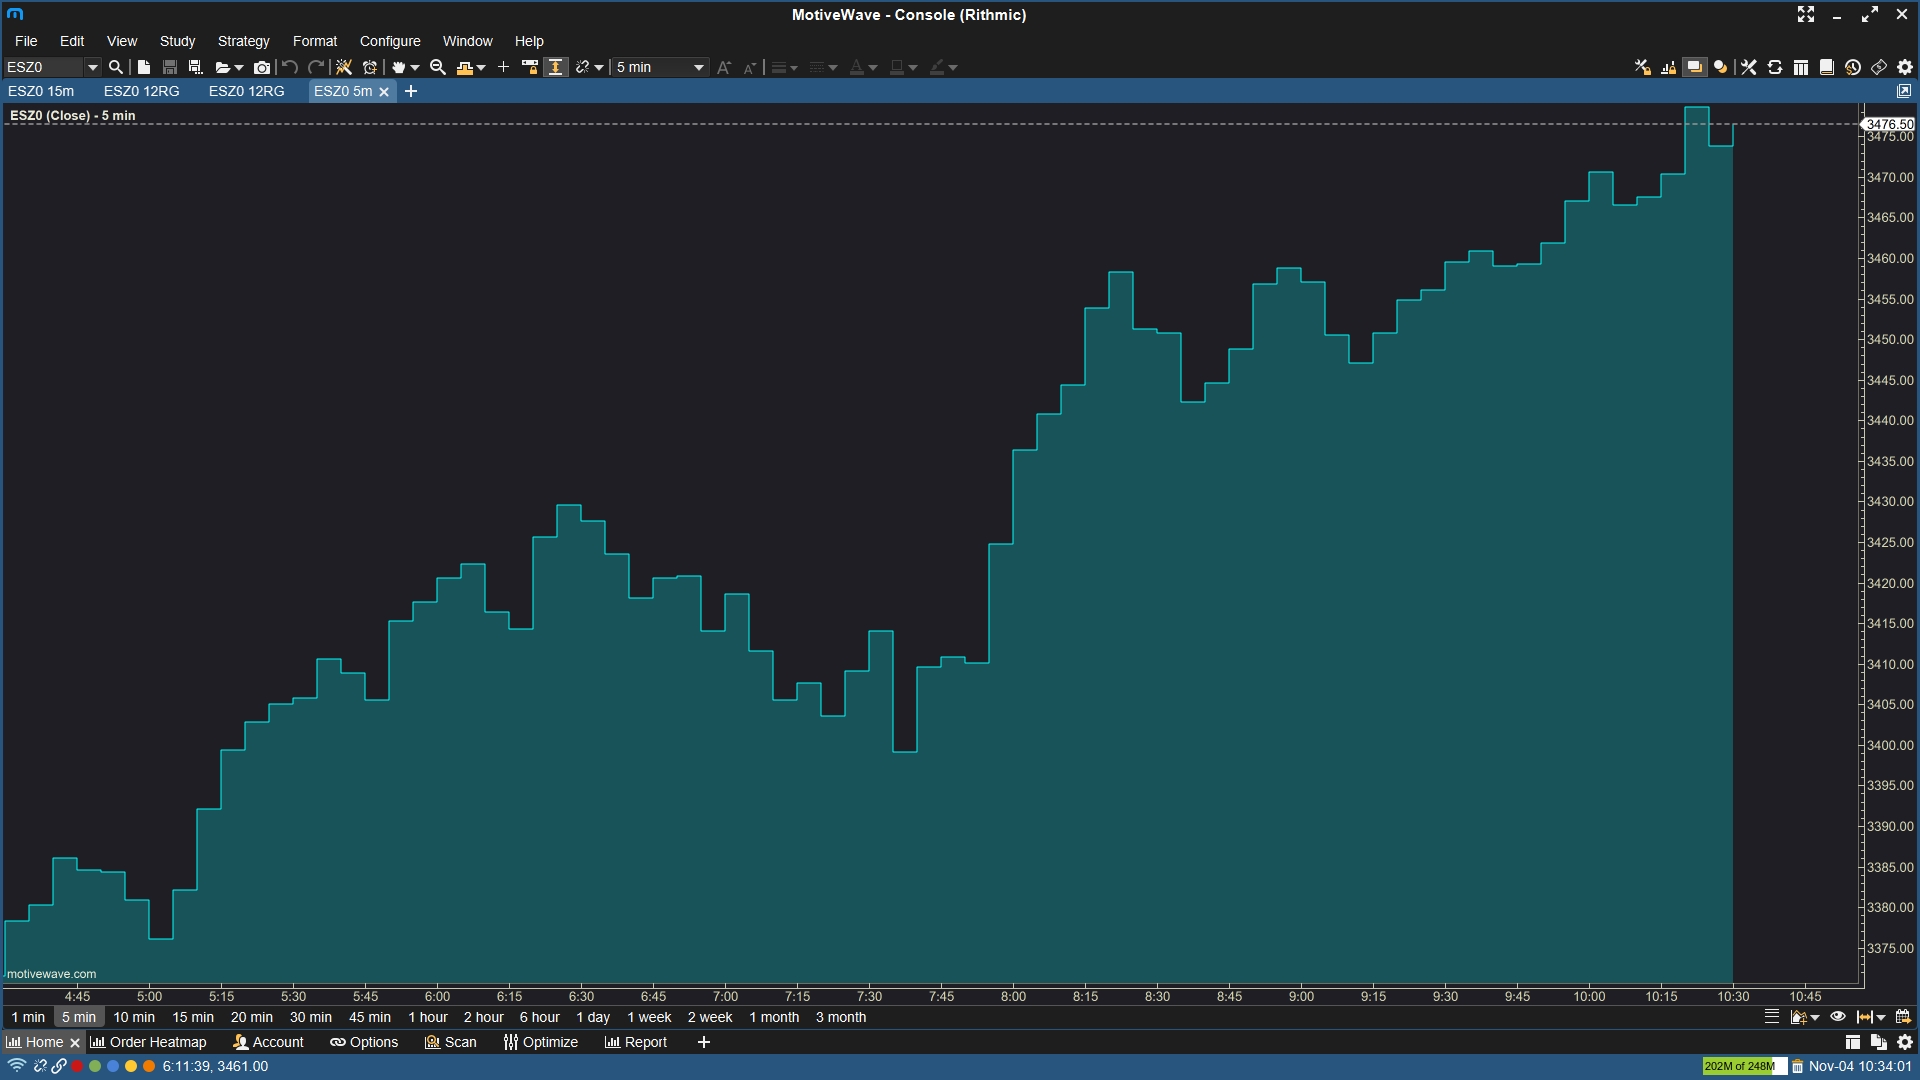
Added new bar types Square Line, Square Line (Shaded), and Square Line (Gradient). These new bars types are like the Line bar type however, they do not draw diagonal lines, instead they draw vertical and horizontal stair-step lines.
To add the new Square Line bar type, click the bar type drop-down menu shown below.
The image below shows the new Square Line (Shaded) option.
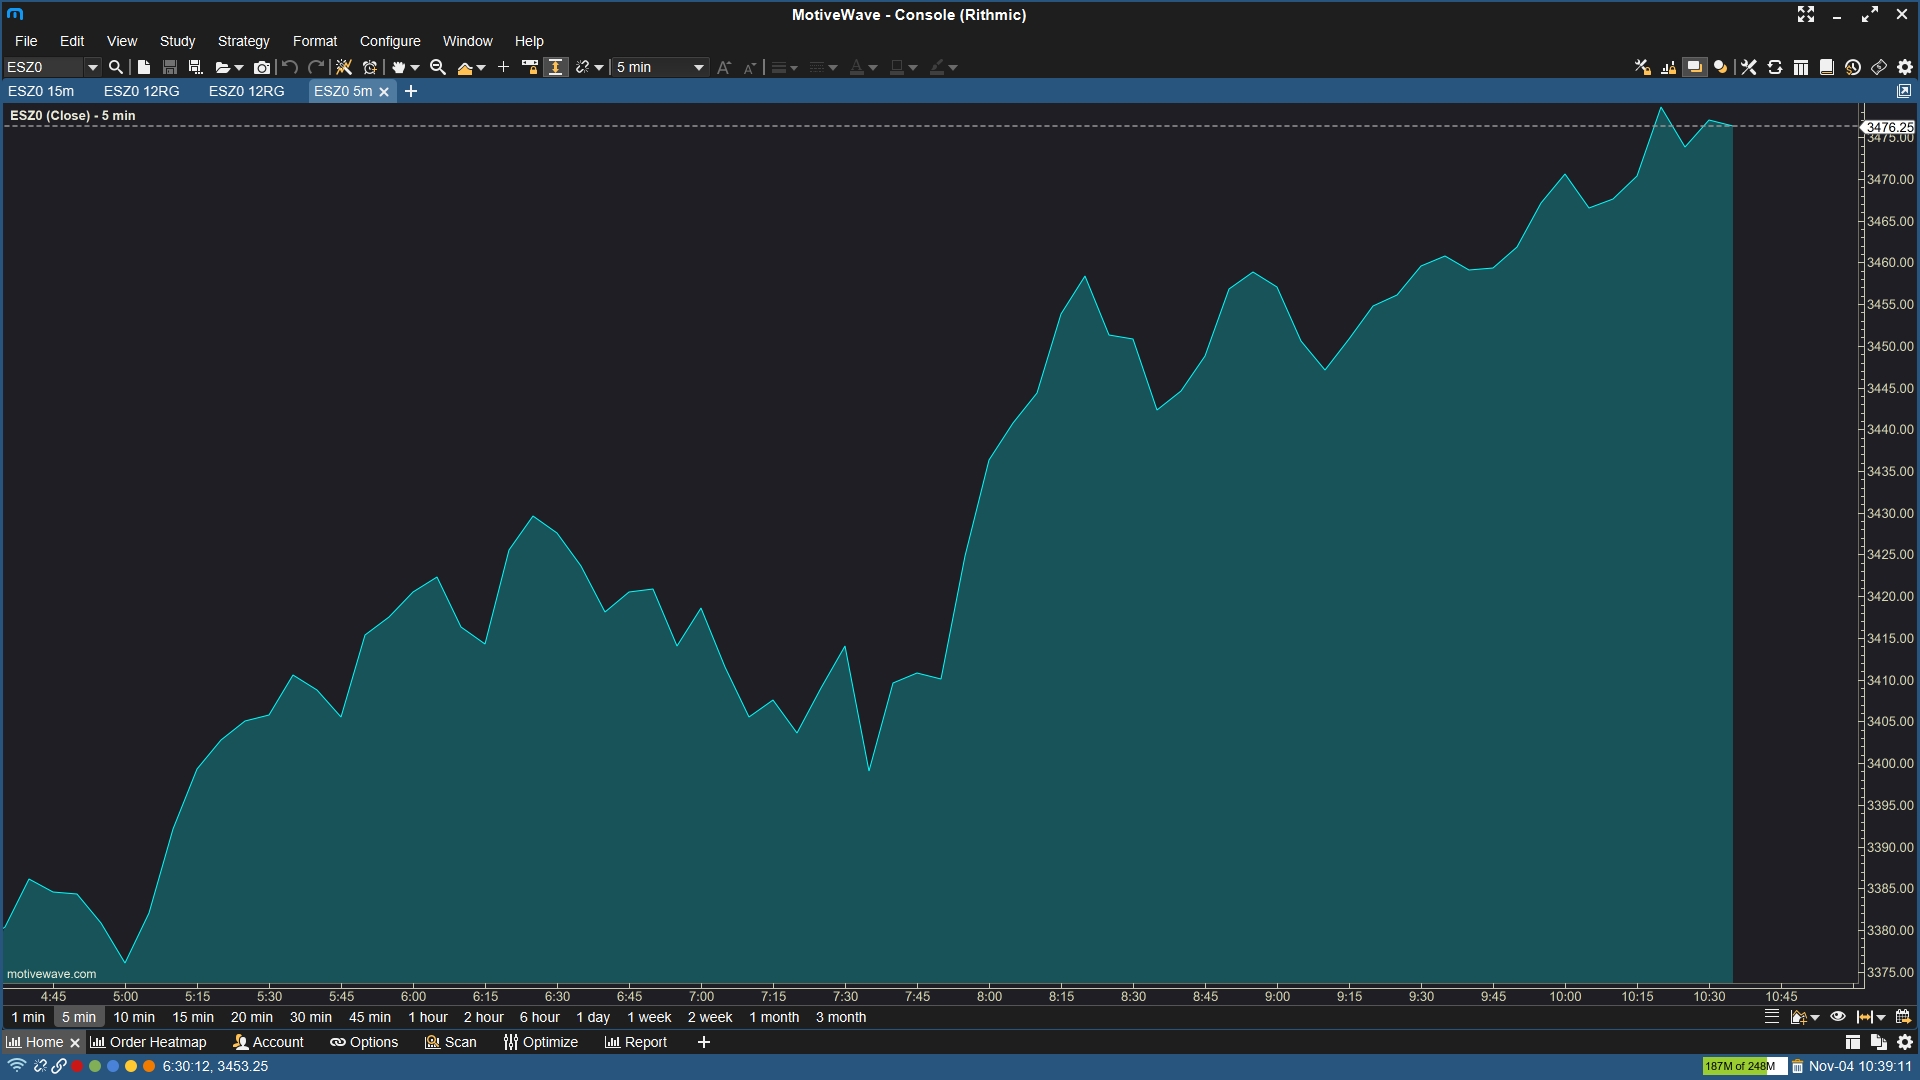
Compared to the Line (Shaded) chart shown below.
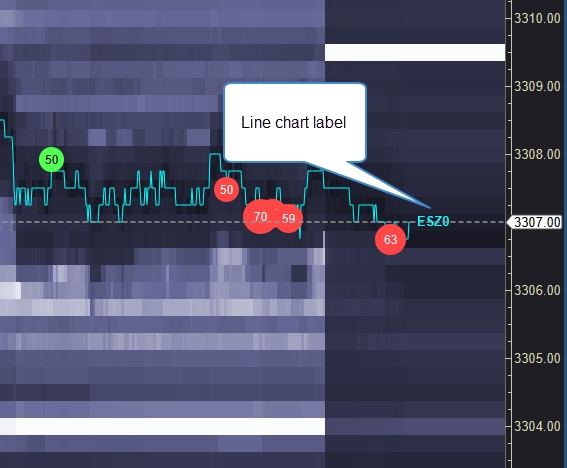
Line Chart Label
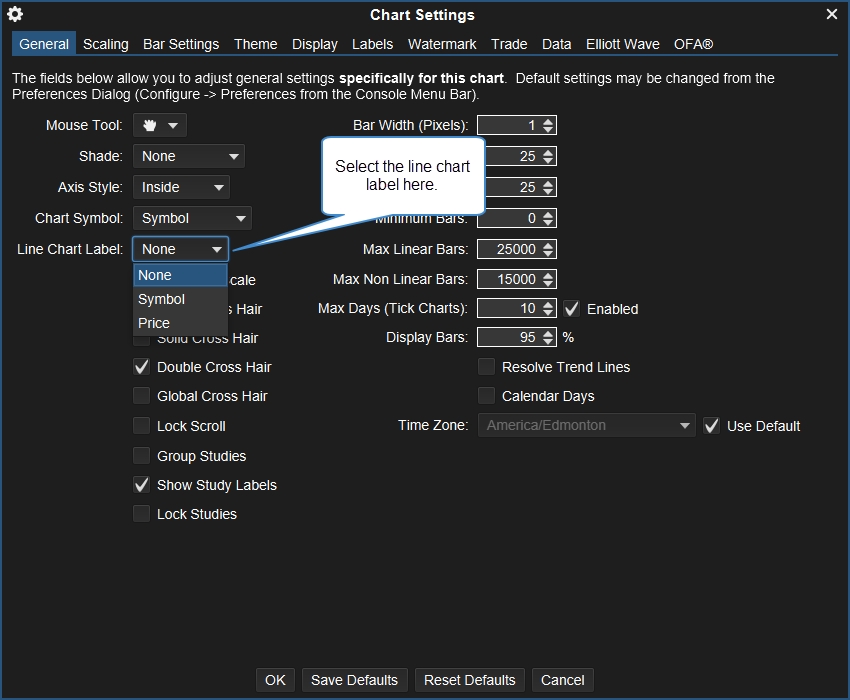
Allows you to change the label displayed to the right of a line chart. Options include: None, Price, and Symbol. This is available from the Chart Settings dialog.
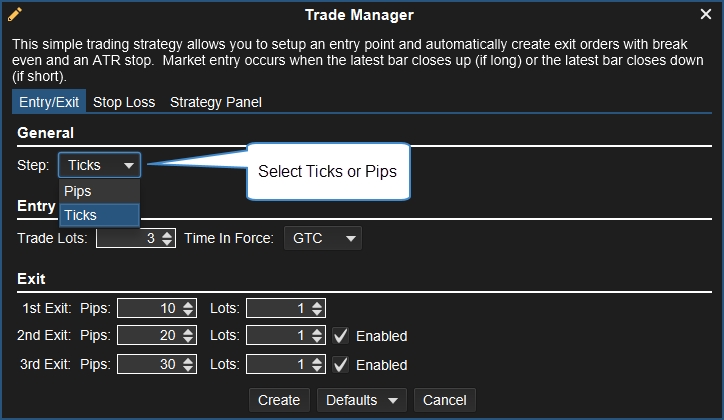
Trade Manager Strategy
Added the ability to specify Ticks or Pips when calculating offsets.
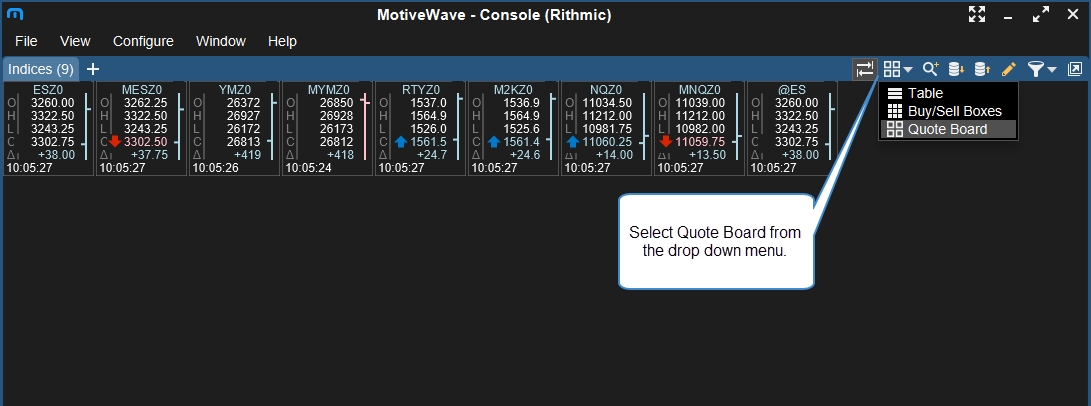
Quote Board
This is a new view for a Watch List/Quote Sheet (in addition to Table and Buy/Sell Boxes). You can change a Watch List to display a Quote Board by choosing Quote Board in the drop-down menu in the Watch List toolbar.
Connections and Brokers
Here is the list of connection updates:
Zytrade – Added a new broker connection for Zytrade (Futures and Future Options), connection is via Rithmic.
Kraken – Added support for Kraken crypto exchange.
Coinbase Pro – Added support for Coinbase pro exchange.
Binance – Added support for Regular and Cross-Margin accounts.
Questrade – Removed support for Questrade.
Rithmic API
Updated to the latest Rithmic library. This update includes significant updates to the performance of loading historical tick data.
Java
Updated to the latest Java and JavaFX 15.0.1
Last updated