What's New in Version 6.0
Welcome to MotiveWave™ version 6.0! There have been many new features and improvements to MotiveWave and we are excited to launch the latest version of our software.
New Product Lineup
As part of Version 6.0, we have streamlined our editions and products to make it easier to choose the product right for you.
We have introduced 2 new editions (Standard, and Elliott Wave Lite).
We have retired 3 editions (Charts, Charts Plus, and Strategy).
All Add-On Modules have been absorbed into one or more editions, so we have also retired the Add-On Modules.
Our product lineup is now simply 5 different editions to choose from.
You can still upgrade to a higher edition at any time (as long as you have active support and updates). We will still put the cost you paid for the lower edition (minus any taxes, discounts or currency conversions) towards the upgrade to the higher edition, so you will only need to pay the remaining difference.
If you own any of the retired editions or modules, don’t worry, they are still supported and you can continue using them. They are just no longer offered for new purchases. Please contact Sales if you have any questions concerning the product lineup change and how it affects you.
Standard Edition
The Standard Edition is our new base charting edition and is a robust, advanced charting platform. The Standard edition features are:
30+ Supported Brokers and Data Feed Providers
One Broker/Data Feed per Workspace
Cloud Workspaces
Comprehensive set of Chart Tools, which include:
General Analysis Components like Trend Line (and extended), Horizontal Line (and extended), Vertical Line (and extended), Price Labels, Time Labels, Fork, Modified Schiff Fork, Channel (and extended), Range, Time and Price Range, Arrows, Support and Resistance Areas, Support and Resistance Zones, P&L Calculator/PL Targets, Cycle, Time Cycle, Wedges, Angles, Curves, Regression Tools, Circles (Radius, Diameter), Triangle, Quad Polygon, Sine Wave, Quadrant Lines, Tirone Levels, Speed Lines, Cross Line
Fibonacci retracement, extension and expansion tools
Advanced Commentary & Markers like Callouts (Balloon, Line, Box), Annotation, Note, Comment, Ellipse, Boxes, Arrows (Straight, Curved), Shapes, Numbers, Letters
Formatting and Visibility Options
283+ Built-in Studies/Indicators, including Multiple Time Frame Studies, Multiple Instrument Studies (Instrument Overlay/Graph, Spread, Ratio), and ability to Choose a Different Instrument for a Study Graph
Free Java SDK for programming your own custom studies/indicators/strategies.
Unlimited Chart Templates and Chart Linking
19 Chart Bar Types, which are:
OHLC bars, HLC bars
Candlesticks, Trend Candlesticks, 3D Candlesticks, Hollow Candlesticks, Flat Candlesticks
OHLC Heikin-Ashi, Candle Heikin-Ashi, Trend Heikin-Ashi, Hollow Heikin-Ashi
Percent Change, Line, Line (Shaded), Line (Gradient)
Bars, Flat Bars, 3D Bars, No Bars
Data Import/Export
Repository
Console Pages
Timeframe Visibility Options
Simple Price Alerts
Replay Mode
Order Flow Tools—only includes Volume Profile (Does NOT include Order Flow 10 Studies Pack -TPO, Depth of Market, Bid/Ask Volume, DOM History, Big Trades Study, DOM Power, Speed of Tape, Speed Gauge, Delta Volume, Cumulative Delta)
Bar Schemes
Harmonic Components
Bull/Bear versions of manual Harmonic Components like Gartley, Butterfly, Crab, Deep Crab, Bat, Alternate Bat, Shark, Cypher, AB=CD, Alternate AB=CD, 5-0, 3 Drives
Gann Components/Tools
Gann Fan, Wedge, Angles (1x1, 2x1, 3x1, 4x1, 8x1, 16x1, 1x2, 1x3, 1x4, 1x8, 1x16), Arc, Half Arc, Circle, Cross Square, Rotatable Square, Grid, Gann Box, Ratio Grid, Gann time and ratio analysis, Pyrapoint, square price scaling, and more
Elliott Wave Lite Edition
The Elliott Wave Lite Edition is the other new charting platform addition to our product lineup and is perfect for the Elliott Wave market analyst. The Elliott Wave Lite Edition includes everything in the Standard Edition above as well as:
Analysis Packs
Elliott Wave Tools Pack
Manual Elliott Wave Tools
EW Components - Allows you to drag a pattern onto the chart and then 'wire up' the points where you want them. You can readjust where the pattern is at any time.
EW Tools - Simply choose the pattern you want to draw from a dropdown menu, then click on the chart where you want each of the points. As you click the points, MotiveWave will draw in the labels and lines for you. You can readjust where the pattern is at any time.
Elliott Wave Markers - A simpler version of the Elliott Wave components, which may be used to place an Elliott Wave label (just a label, no lines) on the chart. This can be useful for showing an alternative wave count on the same chart as the primary count.
Semi-Automatic Elliott Wave Tools
Auto Wave Tool - Select a section of the chart and MotiveWave will automatically fill in the best patterns within that section. You can adjust where the pattern is at any time.
Auto Analyzer - Need help getting started with a wave count? Auto Analyze will automatically plot Elliott Wave patterns over a specified range of data to a specified level of decomposition on one chart, either based on a Data Window or a Start Date.
Automatic Elliot Wave Tools
Auto Elliott Wave Study - Looking for fully automated wave counts? The Auto Elliott Wave Study will create and automatically update a wave count in real time, as new historical bars are generated.
Wave Ratio and Time Analysis
Fibonacci ratios between waves are an essential tool for forecasting price movements. MotiveWave supports all price and time ratios (examples: 2 vs 1, 4 vs 3, B vs A, C vs A+B, X vs W). Multiple ratios can be displayed at the same time and conveniently accessed using keyboard shortcuts.
Decompose Waves
MotiveWave allows you to easily decompose wave formations to multiple levels on all of our Elliott Wave tools
Depending on the Elliott Wave tool you're using, you can tell MotiveWave to automatically decompose to a specific number of levels, to decompose to all possible levels, or MotiveWave will also highlight the possible patterns available to use to decompose a specific pattern you're looking at, if you want to choose the decompose pattern yourself.
Trade Edition
Along with the many new implemented features and enhancements mentioned below for Version 6.0, we’ve also added these additional features into the Trade Edition (vs. Version 5.4.25), as part of our product lineup change:
Exit Strategies (new name, previously entry/exit strategies)
Unlimited Chart Templates
Unlimited Chart Linking (previously limited to Link All/Red Group)
Replay Mode
Data Import/Export
Heikin Ashi
Percent Change Charts
Console Pages
Square Price Scaling
Bar Schemes
Simple Price Alerts
Timeframe Visibility Options
General Analysis Components
Trend Line (and extended), Horizontal Line (and extended), Vertical Line (and extended), Price Labels, Time Labels, Fork, Modified Schiff Fork, Channel (and extended), Range, Time and Price Range, Arrows, Support and Resistance Areas, Support and Resistance Zones, P&L Calculator/PL Targets, Cycle, Time Cycle, Wedges, Angles, Curves, Regression Tools, Circles (Radius, Diameter), Triangle, Quad Polygon, Sine Wave, Quadrant Lines, Tirone Levels, Speed Lines, Cross Line
Advanced Commentary & Markers
Callouts (Balloon, Line, Box), Annotation, Curly Braces, Brackets, Note, Comment, Ellipse, Boxes, Arrows (Straight, Curved), Shapes, Numbers, Letters
Formatting and Visibility Options
Harmonic Components
Bull/Bear versions of manual Harmonic Components like Gartley, Butterfly, Crab, Deep Crab, Bat, Alternate Bat, Shark, Cypher, AB=CD, Alternate AB=CD, 5-0, 3 Drives
Gann Components/Tools
Gann Fan, Wedge, Angles (1x1, 2x1, 3x1, 4x1, 8x1, 16x1, 1x2, 1x3, 1x4, 1x8, 1x16), Arc, Half Arc, Circle, Cross Square, Rotatable Square, Grid, Gann Box, Ratio Grid, Gann time and ratio analysis, Pyrapoint, square price scaling, and more
Professional Edition
Along with the many new implemented features and enhancements mentioned below for Version 6.0, we’ve also added these additional features into the Professional Edition (vs. Version 5.4.25), as part of our product lineup change.
Exit Strategies (new name, previously entry/exit strategies)
Analysis Packs
Custom Order Shortcuts
Timeframe Visibility Options
Harmonic Components/Tools
Bull/Bear versions of manual Harmonic Components like Gartley, Butterfly, Crab, Deep Crab, Bat, Alternate Bat, Shark, Cypher, AB=CD, Alternate AB=CD, 5-0, 3 Drives
Auto Gartley tool
Auto AB=CD tool
Auto Harmonic Study
Harmonic Scanner
Gann Components/Tools
Gann Fan, Wedge, Angles (1x1, 2x1, 3x1, 4x1, 8x1, 16x1, 1x2, 1x3, 1x4, 1x8, 1x16), Arc, Half Arc, Circle, Cross Square, Rotatable Square, Grid, Gann Box, Ratio Grid, Gann time and ratio analysis, Pyrapoint, square price scaling, and more
Ultimate Edition
The Ultimate Edition continues to be our top of the line charting, trading, and Elliott Wave platform, which includes all of our features.
The main difference between Professional and Ultimate, is that Ultimate includes all Elliott Wave functionality and Hurst Cycles.
Cloud Workspaces
Cloud workspaces are hosted on MotiveWave’s server and can be accessed from any computer using the same license key. Cloud workspaces hold all of their data in the MotiveWave™ cloud (including settings, instruments analysis etc.) but also hold a local copy so that the workspace can be opened in “offline” mode. Any changes that are made to the workspace in “offline” mode will be synchronized with the cloud workspace the next time you open the workspace in “online” mode.
Synchronization
Workspace synchronization involves uploading new or changed files and removing deleted files from the cloud repository. For efficiency, untouched files will not be included in the synchronization process. Synchronization occurs at the following times:
Startup – When the workspace is first loaded, it will be synchronized with the cloud to ensure that the latest files are loaded to the local disk.
Interval – MotiveWave™ will run the synchronization process at a constant interval (current every minute) to check for changes and upload them to the cloud. This happens in the background and will not affect your usage of MotiveWave™.
Shutdown – When closing the workspace, any remaining changes will be synchronized with the cloud.
Manual – At any point you can force the synchronization to occur by choosing Configure -> Synchronize Workspace from the Console menu bar.
Limitations
Cloud workspaces currently have the following limitations:
Trial Accounts:
Maximum of 1 Cloud Workspace
Maximum workspace size is 50 MB
Paid Accounts:
Maximum of 3 Cloud Workspace
Maximum workspace size is 200 MB
Creating/Editing Cloud Workspaces
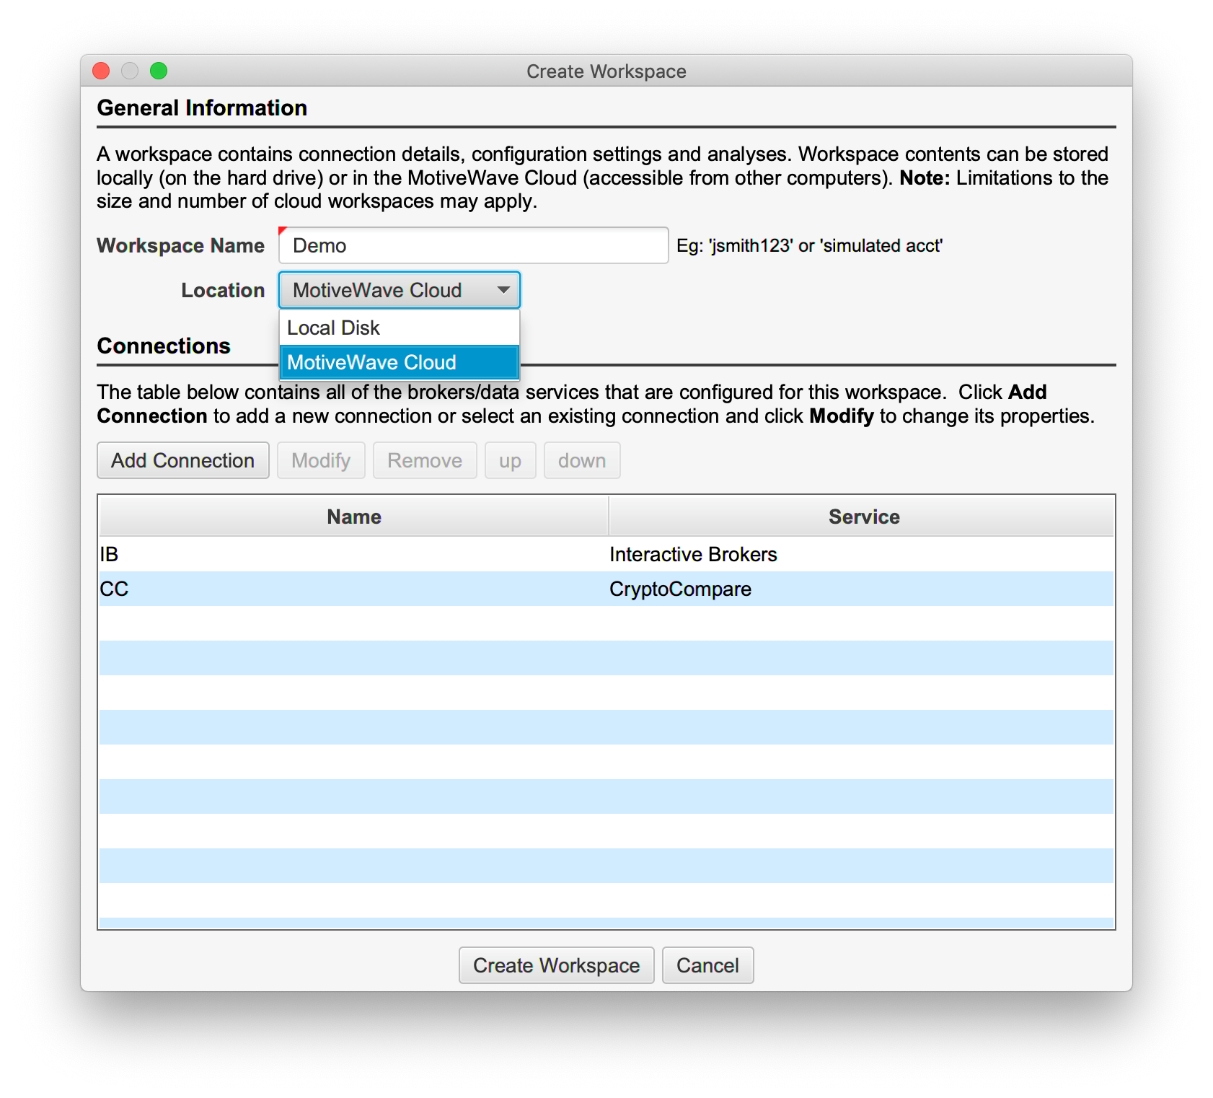
A cloud workspace can be created by choosing “MotiveWave Cloud” from the location drop down in the Create Workspace dialog (see screen shot below). Existing workspaces may also be moved to the cloud in the Edit Workspace dialog. Note: you cannot change the name of a cloud workspace.
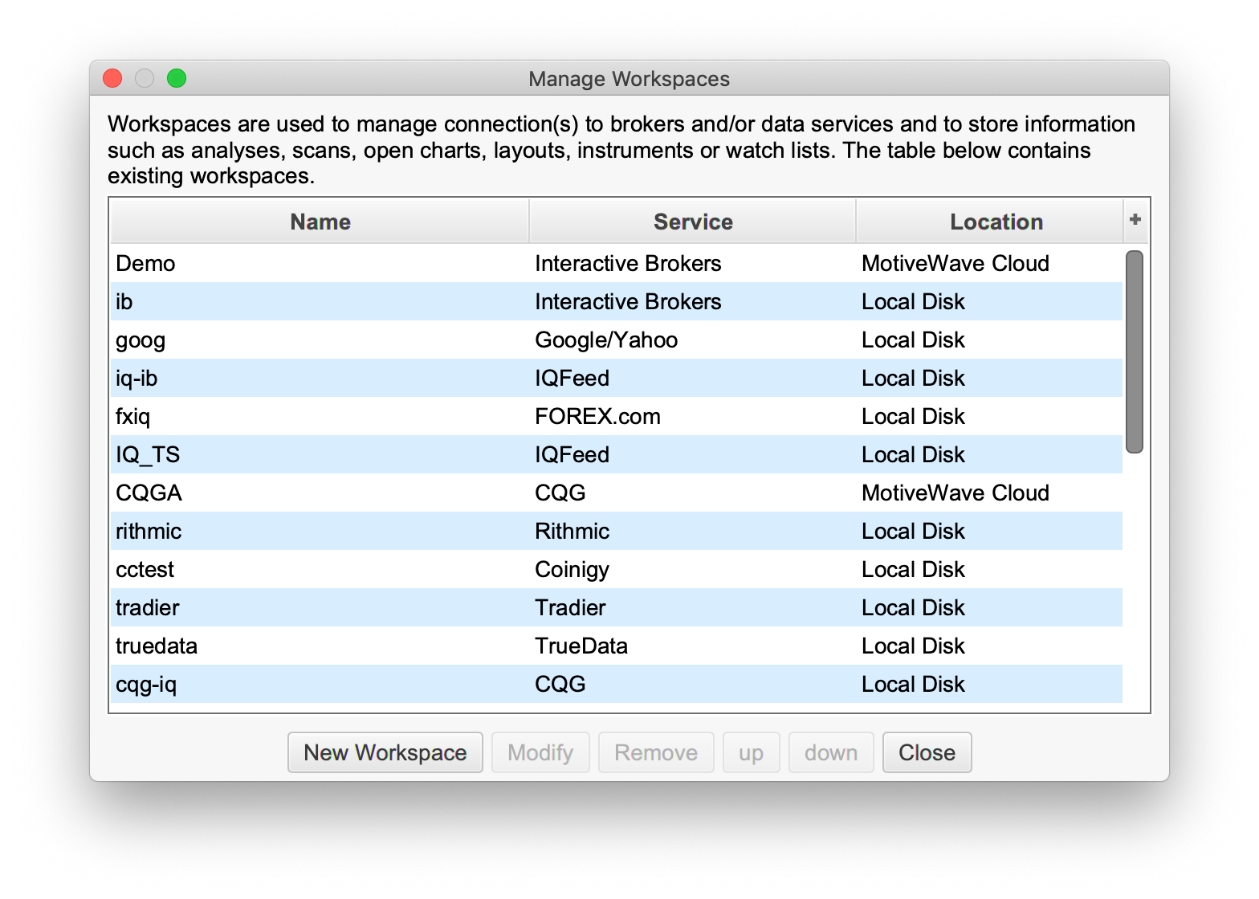
The Manage Workspace dialog has been modified to show local vs cloud workspaces (see below).
Elliott Wave Custom Ratios
Price and time ratios for Elliott Waves may be customized from the Preferences Dialog (Configure -> Preferences from the Console menu bar, see Elliott Wave tab).
Price Ratios
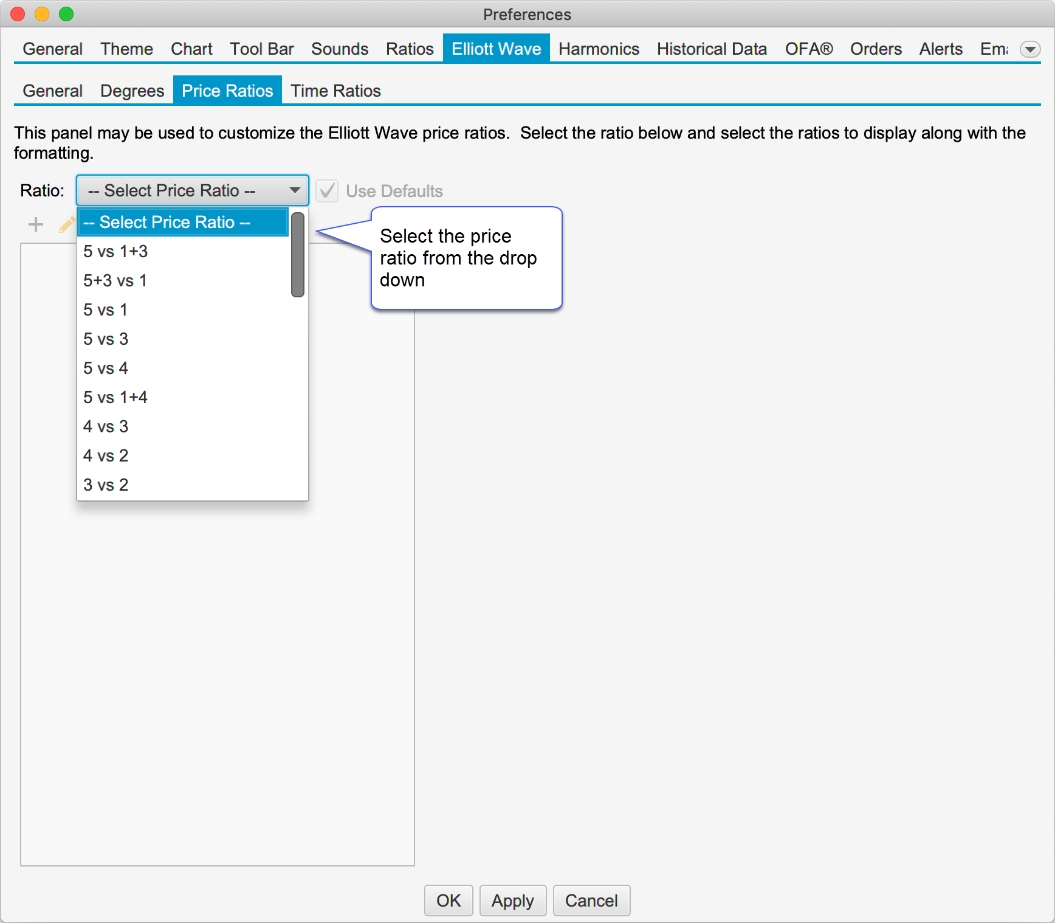
Select the Price Ratios sub tab from the Elliott Wave tab in the Preferences Dialog. Choose a Wave Ratio by selecting it from the drop down.
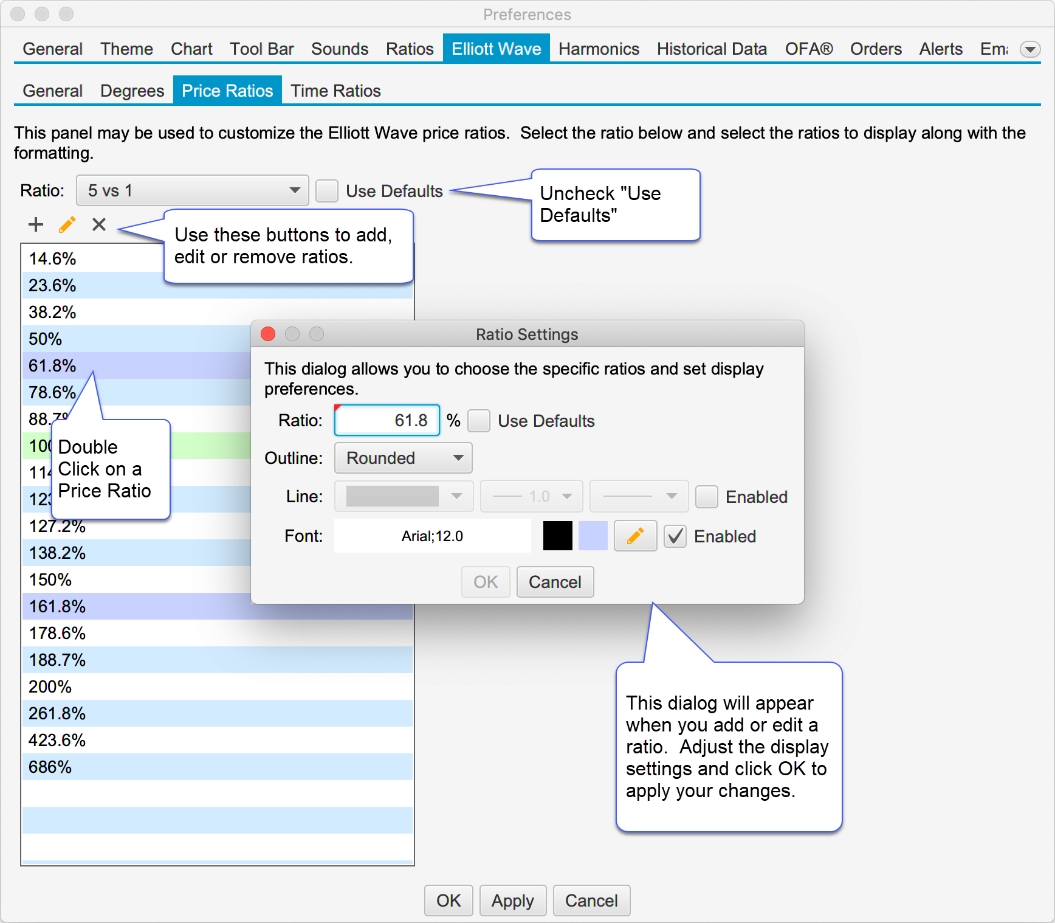
Once you have chosen a wave ratio, the existing settings will be populated in the list box. Uncheck the “Use Defaults” button to modify these ratios.
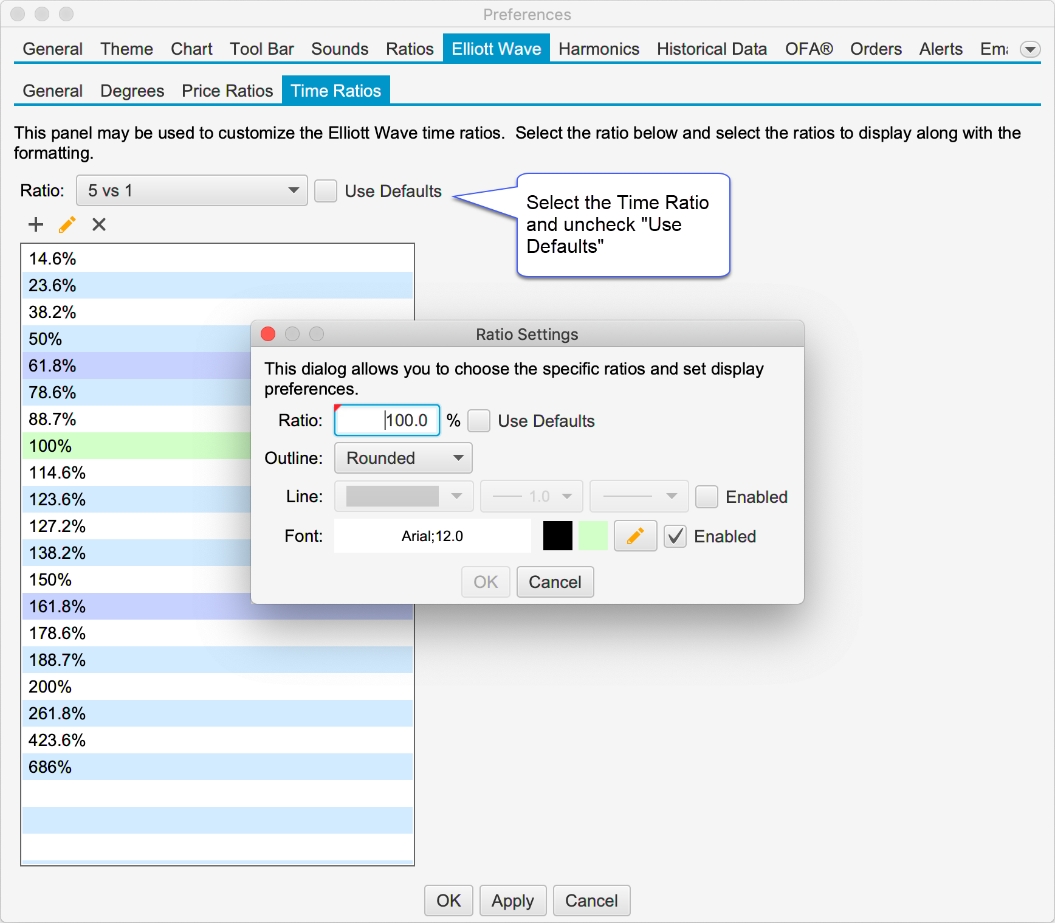
Time Ratios
Similar to the Price Ratios, the Time Ratios can be customized from the Time Ratios tab:
Elliott Wave Enhancements
Elliott Wave Markers
Elliott Wave markers are a simpler version of the Elliott Wave components and may be used to place an Elliott Wave label on the chart. This can be useful for showing an alternative wave count on the same chart as the primary count.
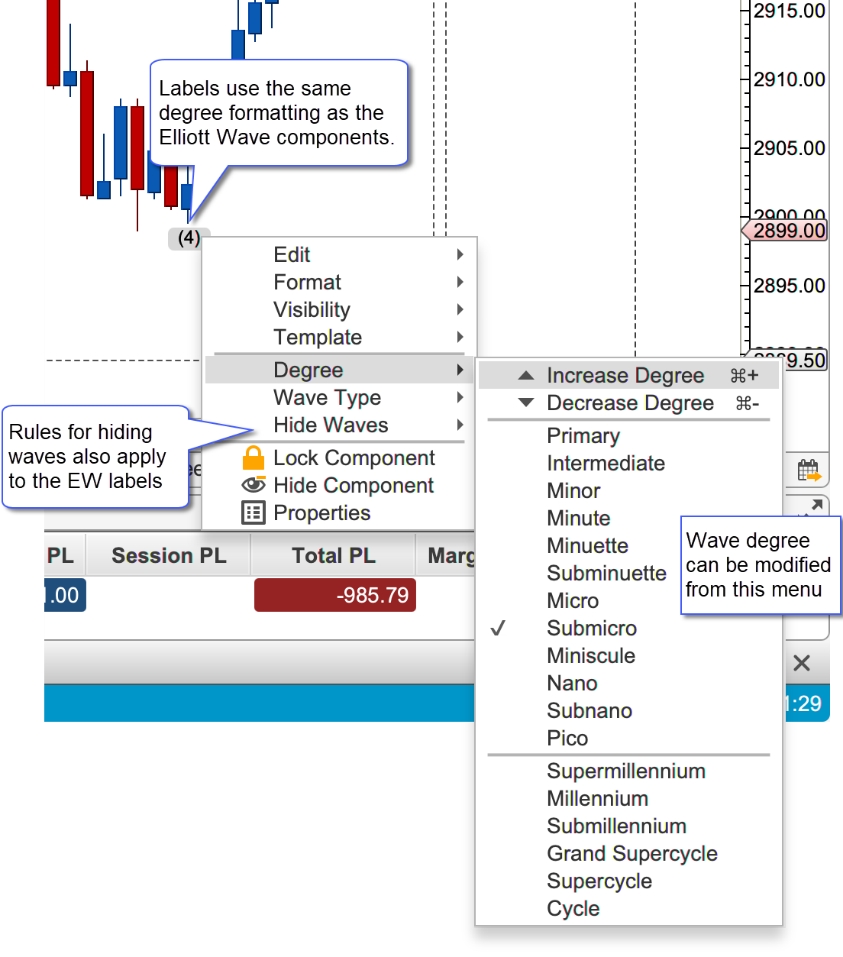
The labels use the same degree label formatting as the Elliott Wave components. These labels also use the same rules for hiding waves above or below a specified degree.

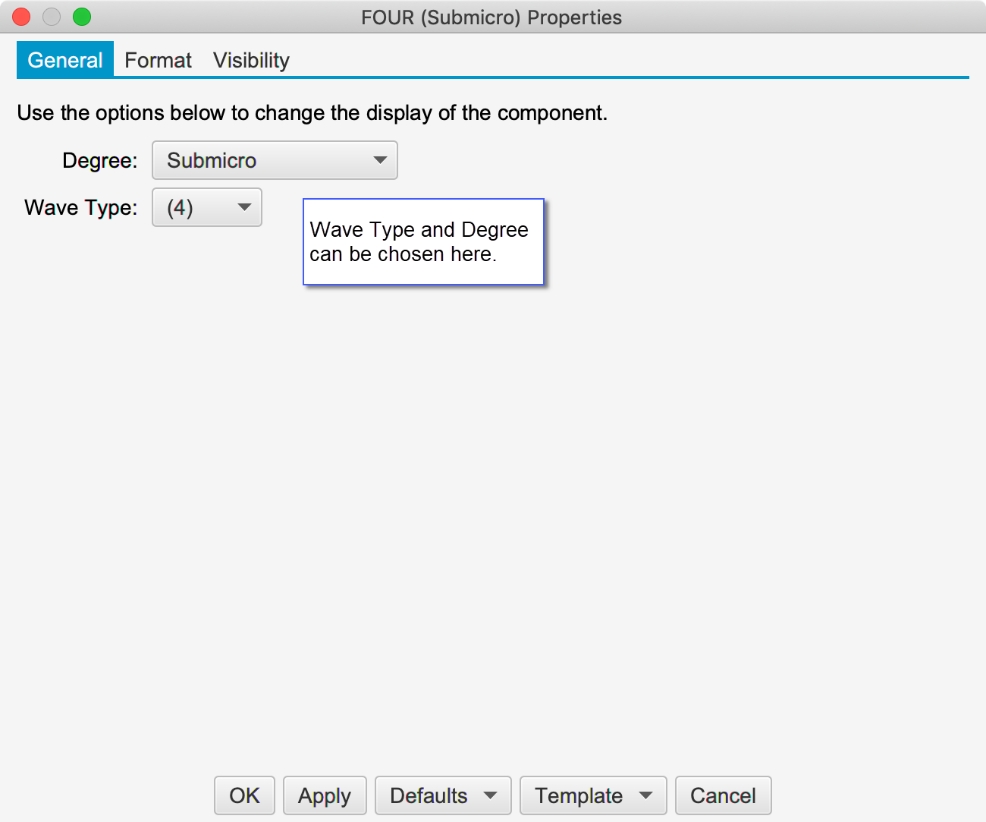
The degree of the label can be chosen from the right click (context) menu or from the Properties dialog (double click on the marker).
Mouse Tools
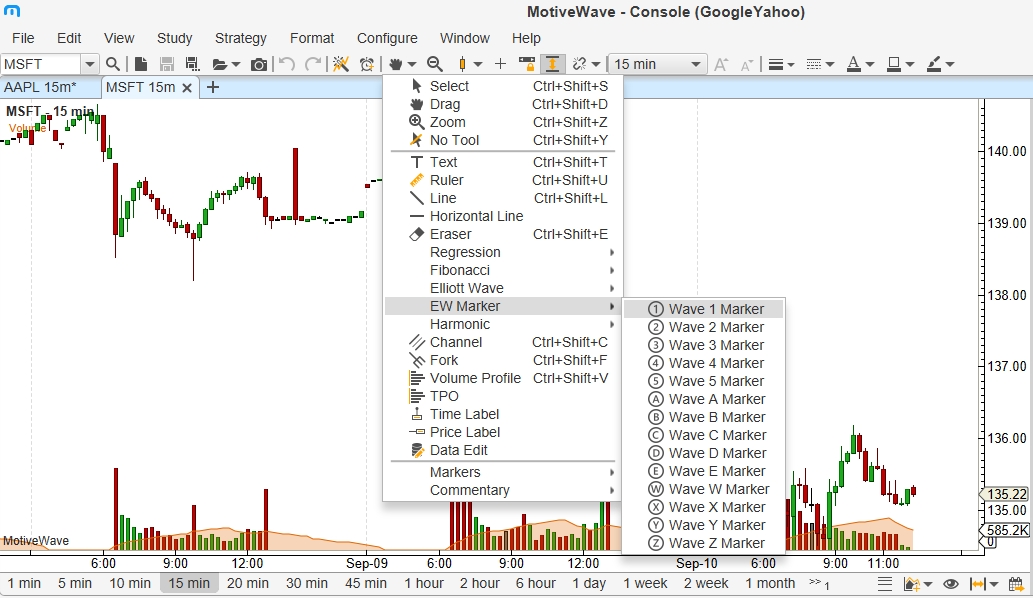
Mouse tools have been added for the Elliott Wave Markers.
Ratio Visibility
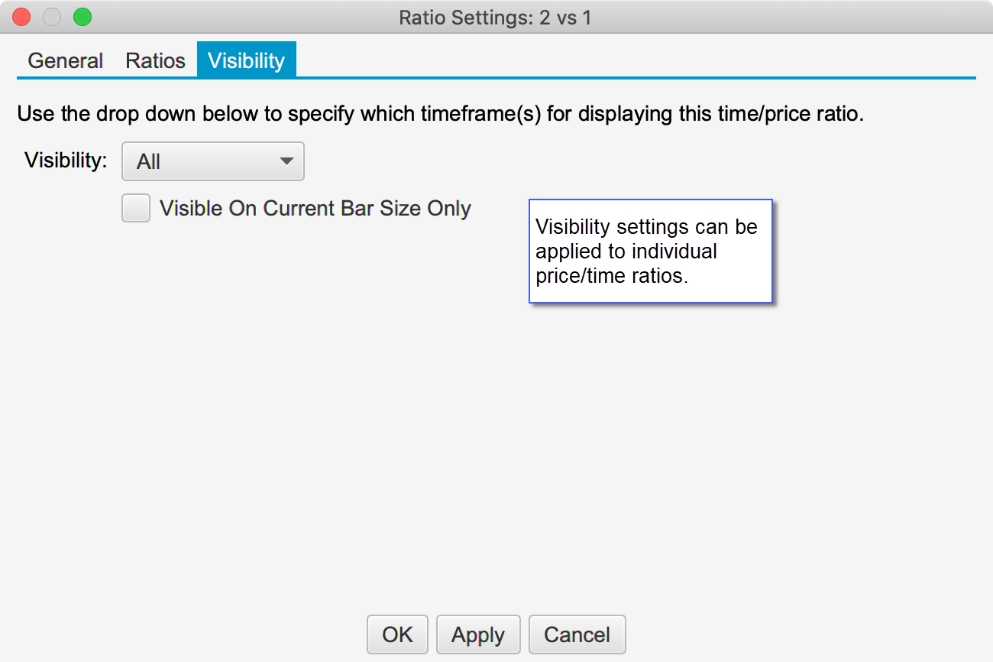
The visibility for individual price and time ratios can be set from the Ratio Properties dialog (double click on a ratio label). This will hide or show ratios depending on the selected bar size for the chart.
Left Adjust for Ratio Lines
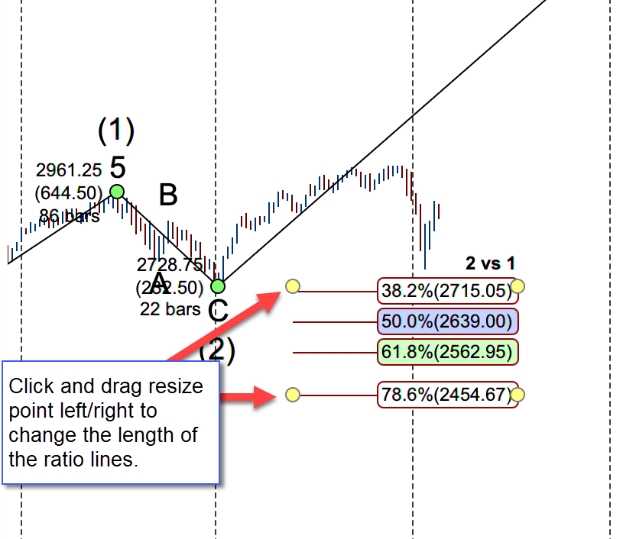
The left side of ratio lines can now be adjusted using the mouse. Two yellow resize points are available on the left side of the ratio lines that can be dragged left or right.
Note: this feature also exists on other ratio components (such as retracements, extensions and expansions).
Wave B vs A for Triangles
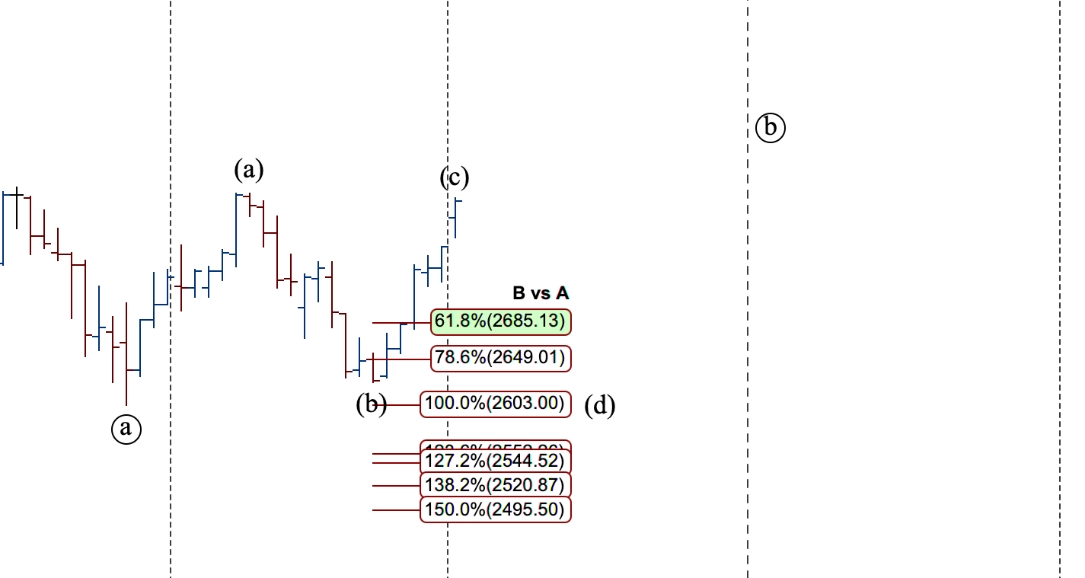
The price wave ratio B vs A has been added for triangle patterns. The main purpose of this ratio is to monitor a developing triangle that may turn into an ABC correction.
Analysis Packs
The Analysis Packs feature provides a more convenient method for sharing or transferring a set of analyses from one computer to another. This is similar to the import/export analysis feature but allows you to include multiple analyses across one or more instruments.
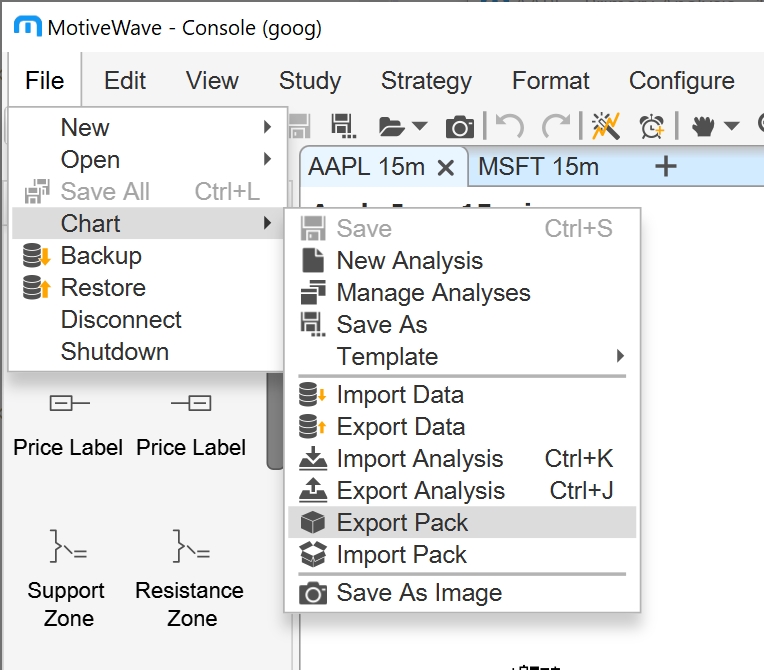
The Export/Import Pack options can be found under the File -> Chart menu of the Console menu bar:
Exporting a Pack
Use the Export Analysis Pack dialog (see below) to select a set of analyses and create a pack file. The pack file is a compressed zip file. Click on the + button to select analyses to add to the pack.
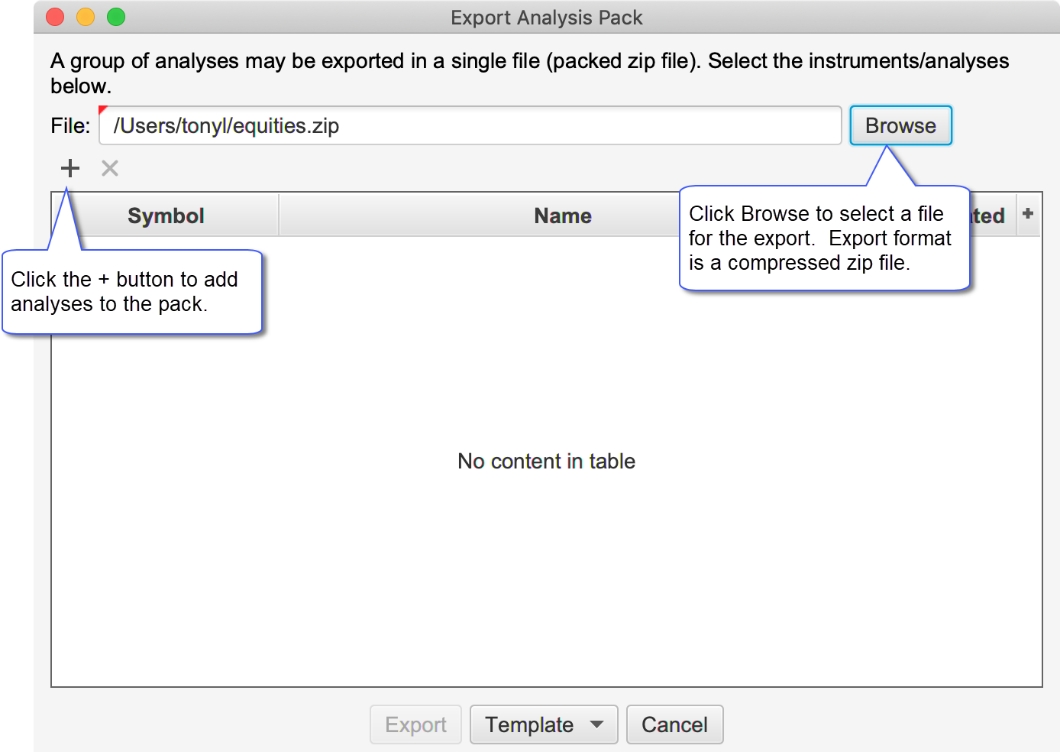
When you click on the + button the Select Analyses dialog will be displayed (see below). Type the symbol in the input box and press Enter or Tab to display the available analyses. Select the analyses you would like to include and press the Add and Close or the Add button.
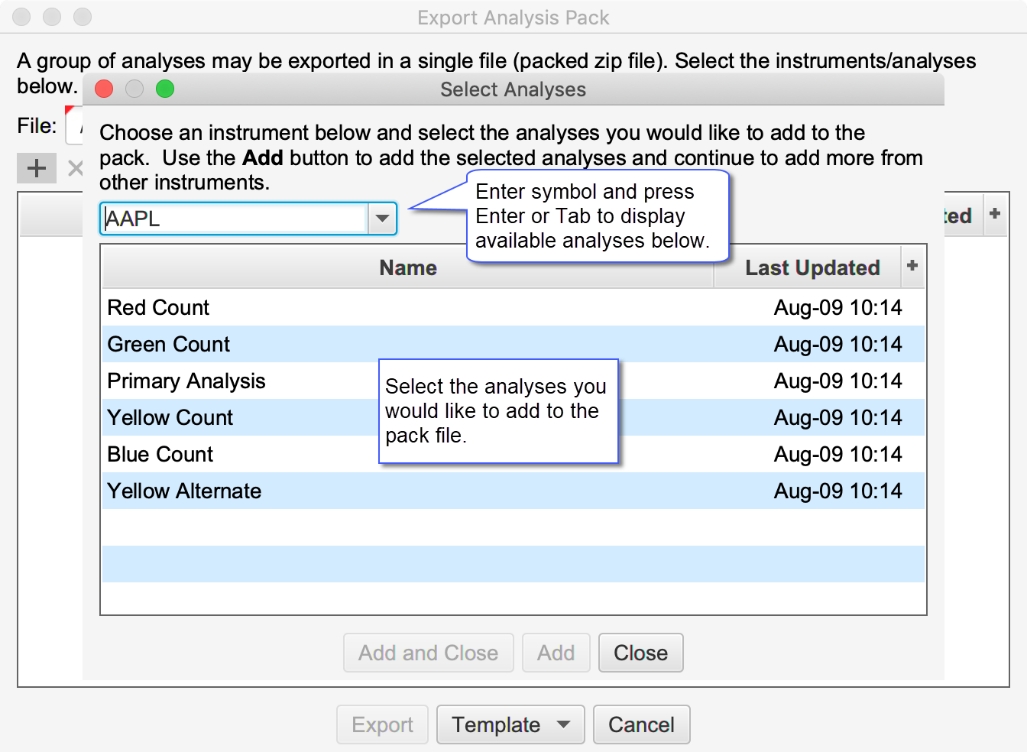
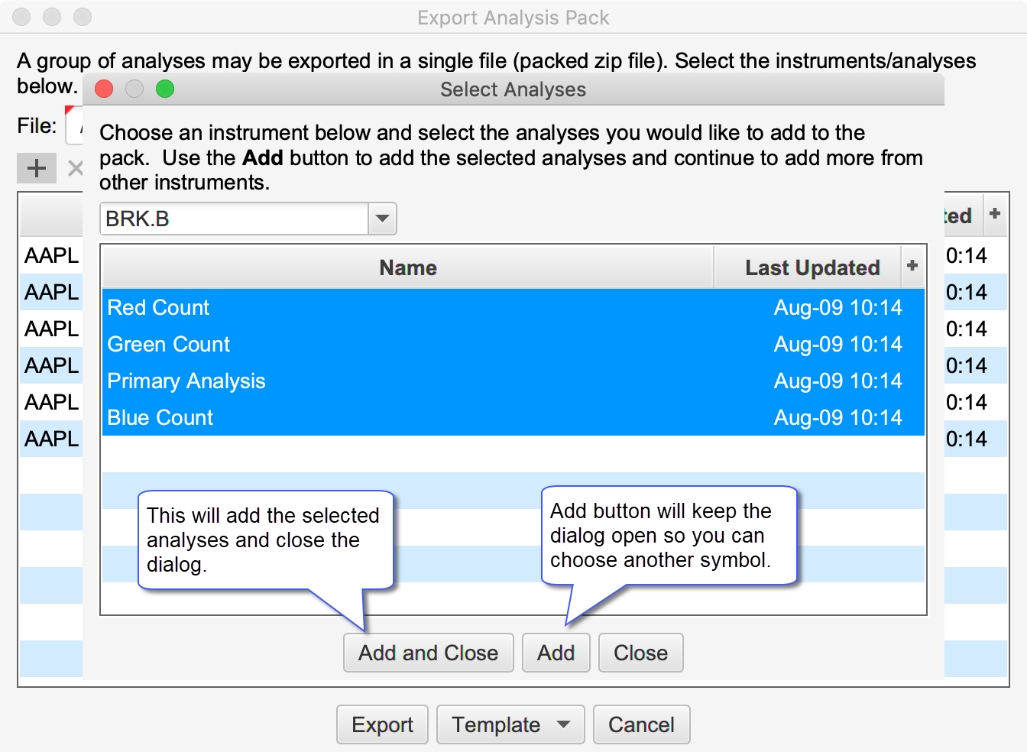
For convenience, the Add button will keep the dialog open so you can choose another symbol. When you are finished, click Add and Close to dismiss this dialog.
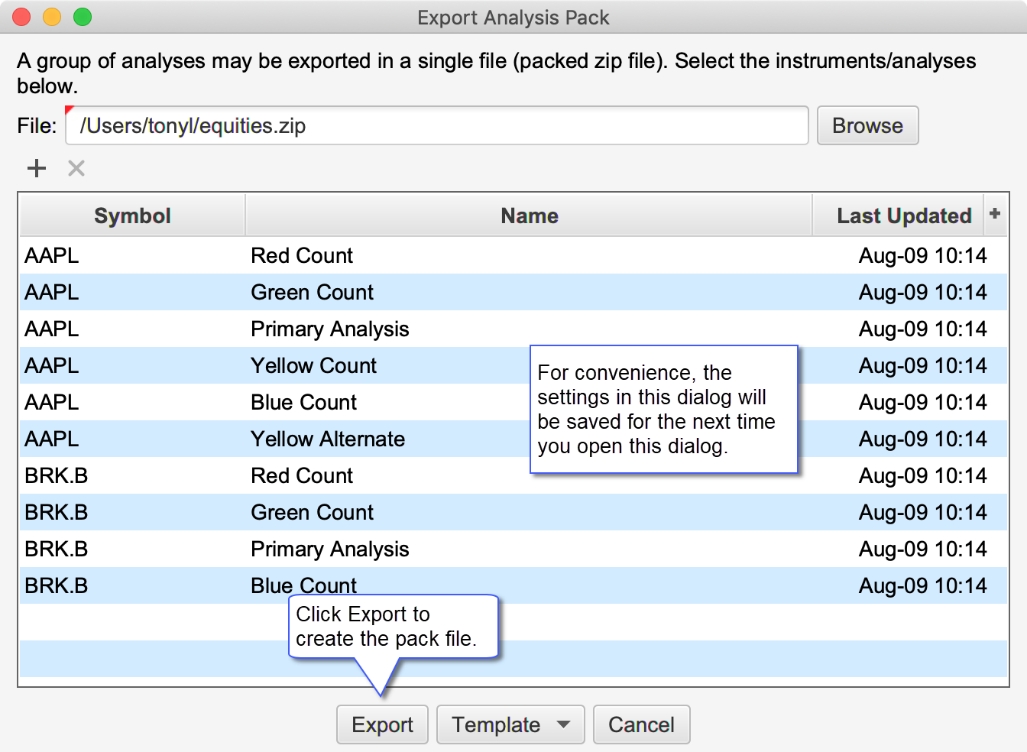
When you have completed selecting all of the analyses for the pack, click on the Export button at the bottom of the Export Analysis Pack dialog. For convenience all of the settings in this dialog will saved for the next time you use it.
Export Templates
Templates are useful in cases where you frequently export different sets of analyses to one or more users or transfer files between computers.
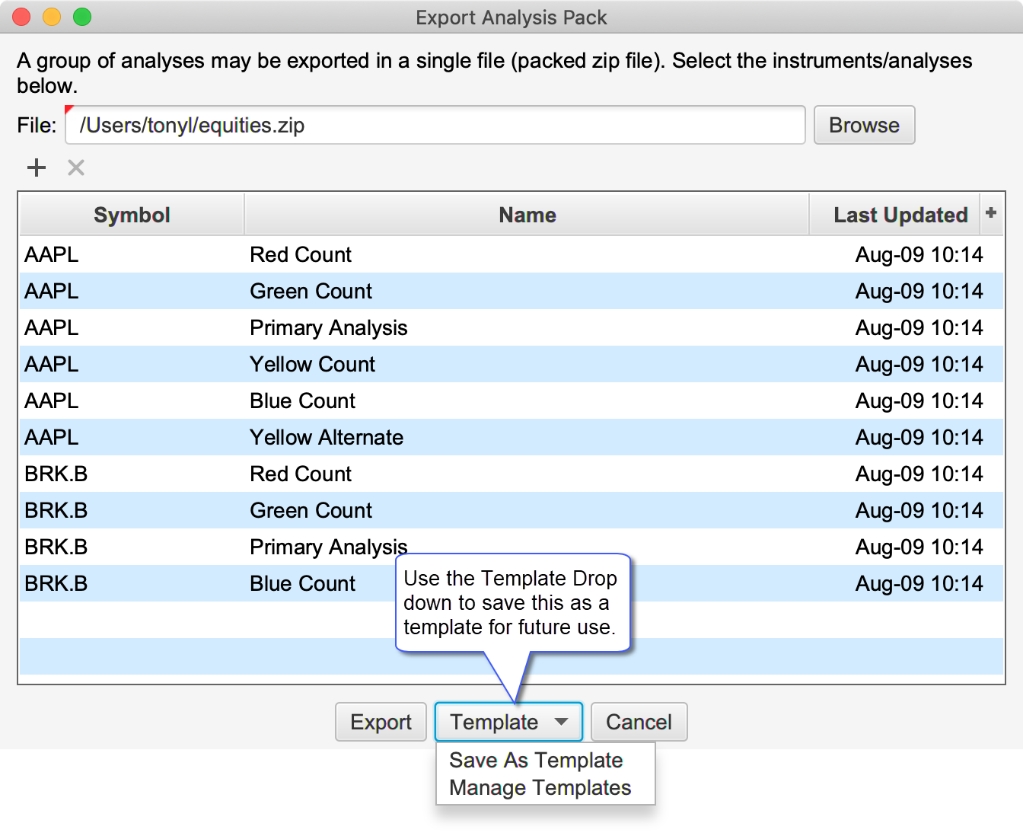
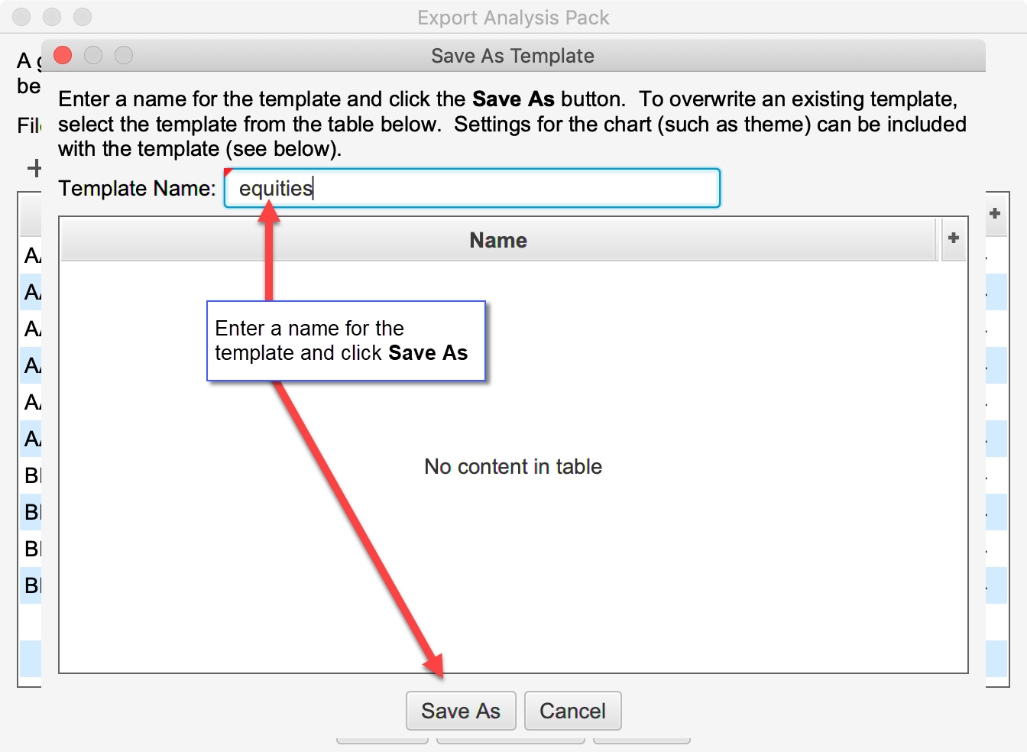
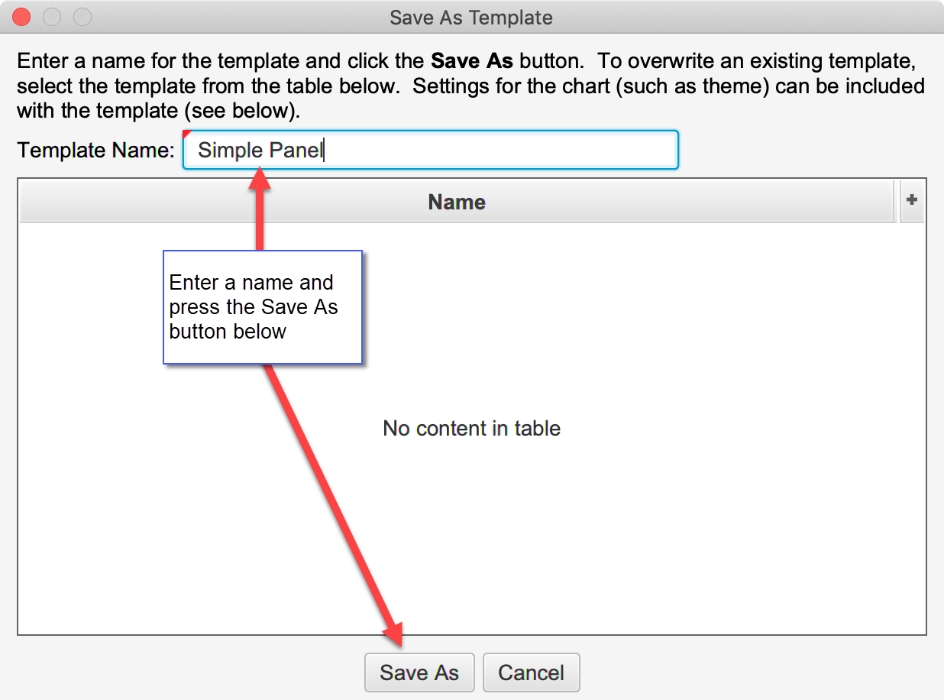
This will launch the Save As Template dialog. Enter a name for the template and click the Save As button (see below).
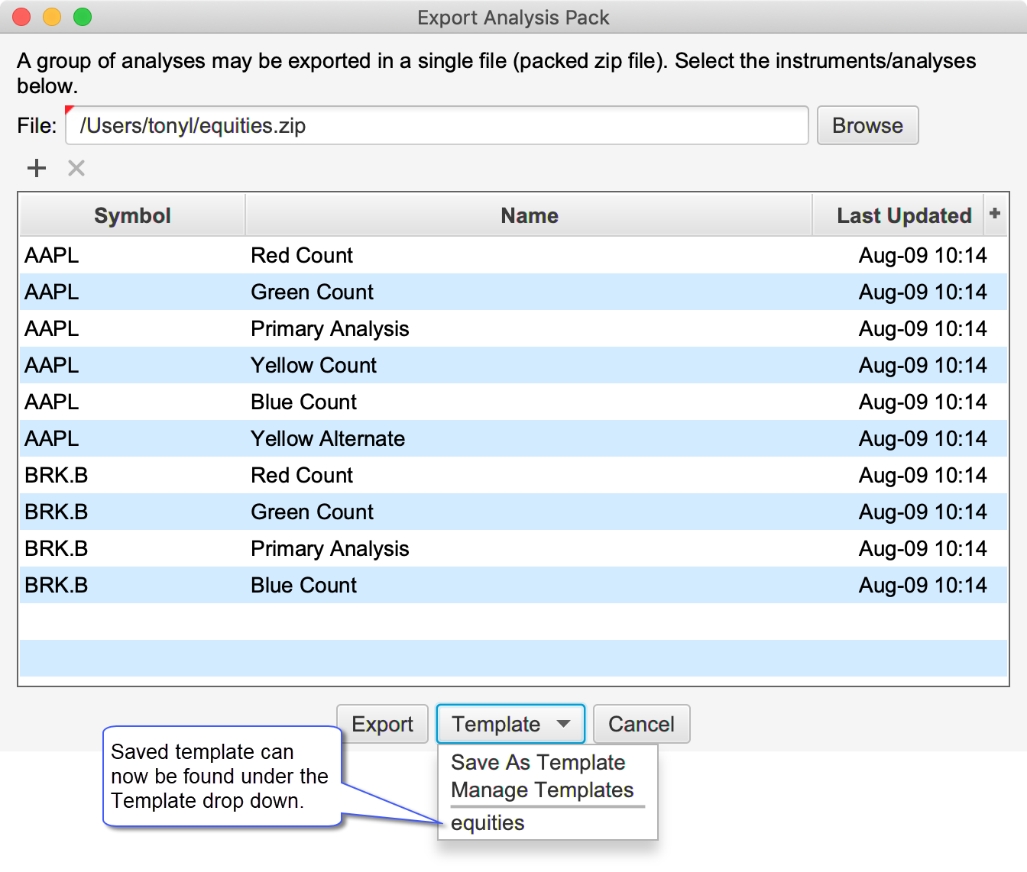
The template can then be applied by choosing it from the Template drop down at the bottom of the dialog.
Importing a Pack
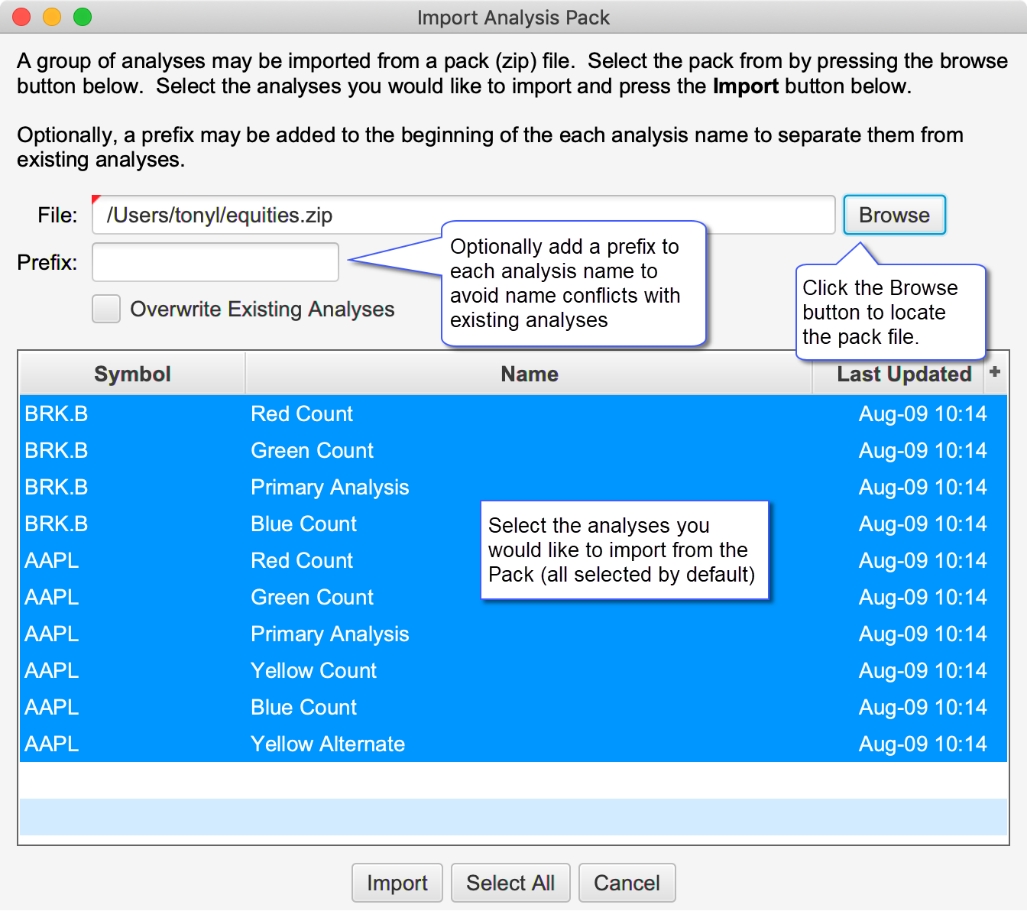
Use the Import Analysis Pack dialog to import analyses from a pack into your workspace. A prefix can optionally be added to each analysis. This can be useful to identify where the analyses came from or to avoid naming conflicts with existing analyses in your workspace. You can selectively choose which analyses to import. By default, all will be selected.
Exit Strategies
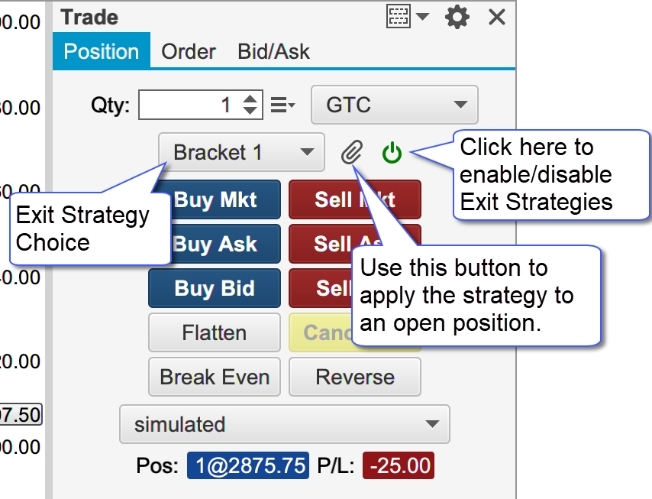
Exit strategies define how an existing position will be closed using a combination of one or more orders. This new feature replaces the existing Entry/Exit Strategies in previous versions of MotiveWave™.
The Exit Strategy control can be found in the Trade Panel as well as the DOM Panel. In the screen shot below, the Exit Strategy control is shown in the Position tab of the Trade Panel.
Executing Exit Strategies
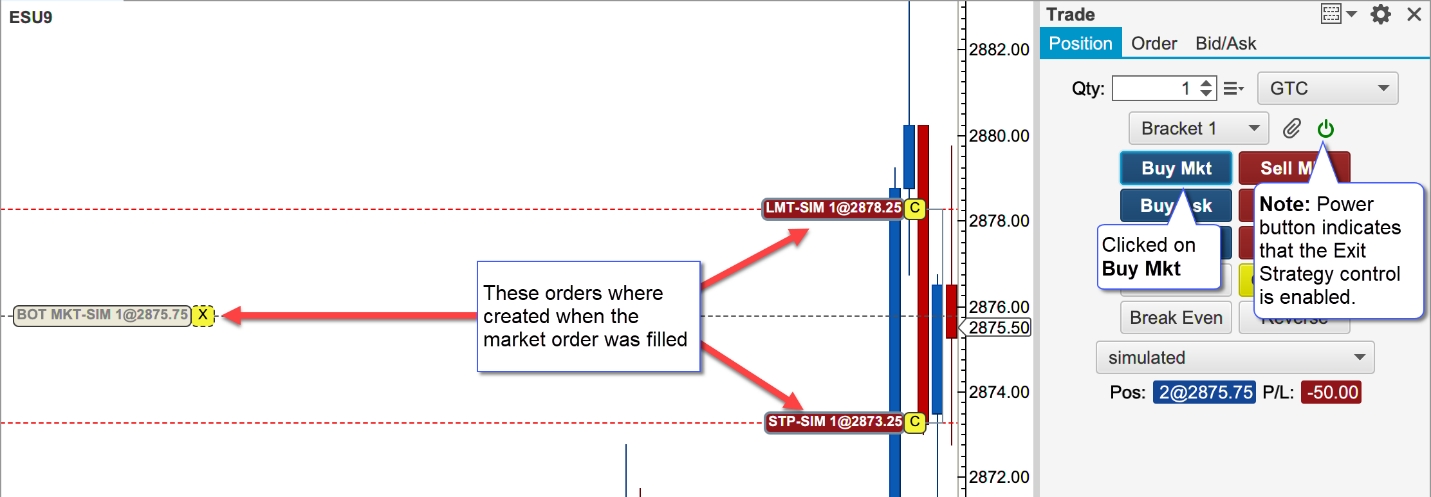
Exit Strategies are applied when clicking on one of the entry order buttons in the panel. Use the green power button in the right-hand side of the control to disable this feature (disabled by default). For example, in the screen shot below if you click on the Buy Mkt button, the Bracket 1 strategy will automatically be applied once the market order is filled.
Apply Strategy to Existing Position
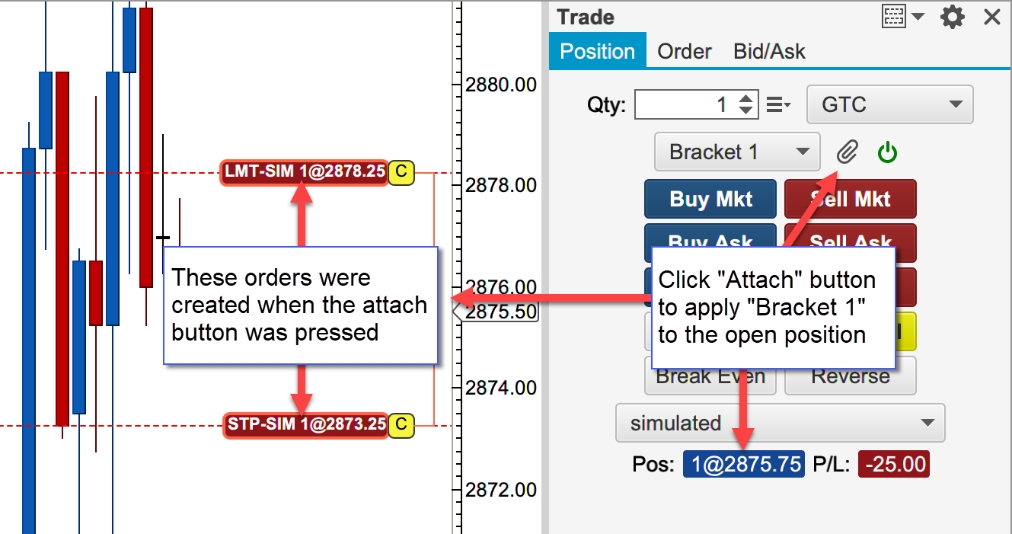
In the case where a position already exists, you can press the attach button (paper clip) to apply the selected strategy to the open position. In the screen shot below the Bracket 1 strategy has been applied to the existing open position ([email protected]). This created two orders: a stop and a limit submitted as OCO (One Cancels Other).
Configuring Exit Strategies
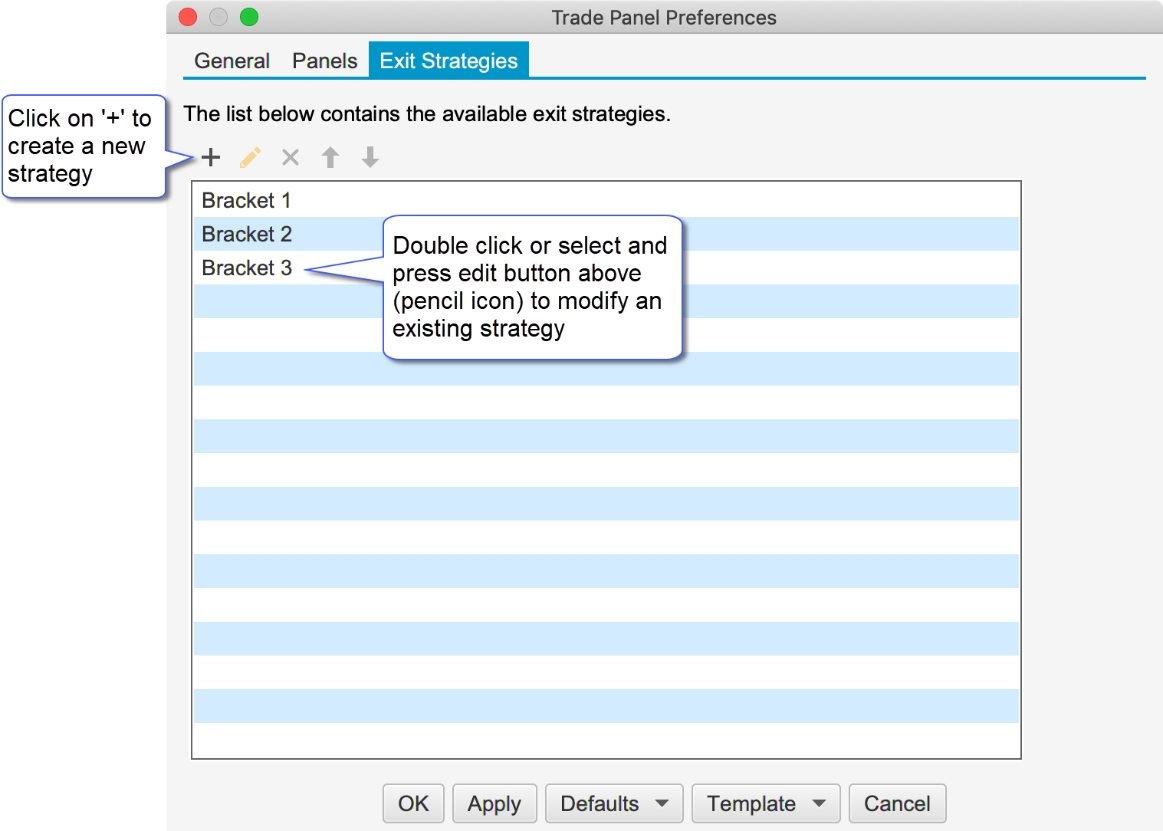
Exit Strategies may be configured from Trade Panel settings or from the DOM Panel settings (see Exit Strategies tab).
Click on the + button to create a new strategy. Existing strategies may be modified by double clicking on them. Three default strategies are available (which may be modified). These strategies implement 1, 2 and 3 bracket orders (stop loss + limit). Existing strategies can also be copied.
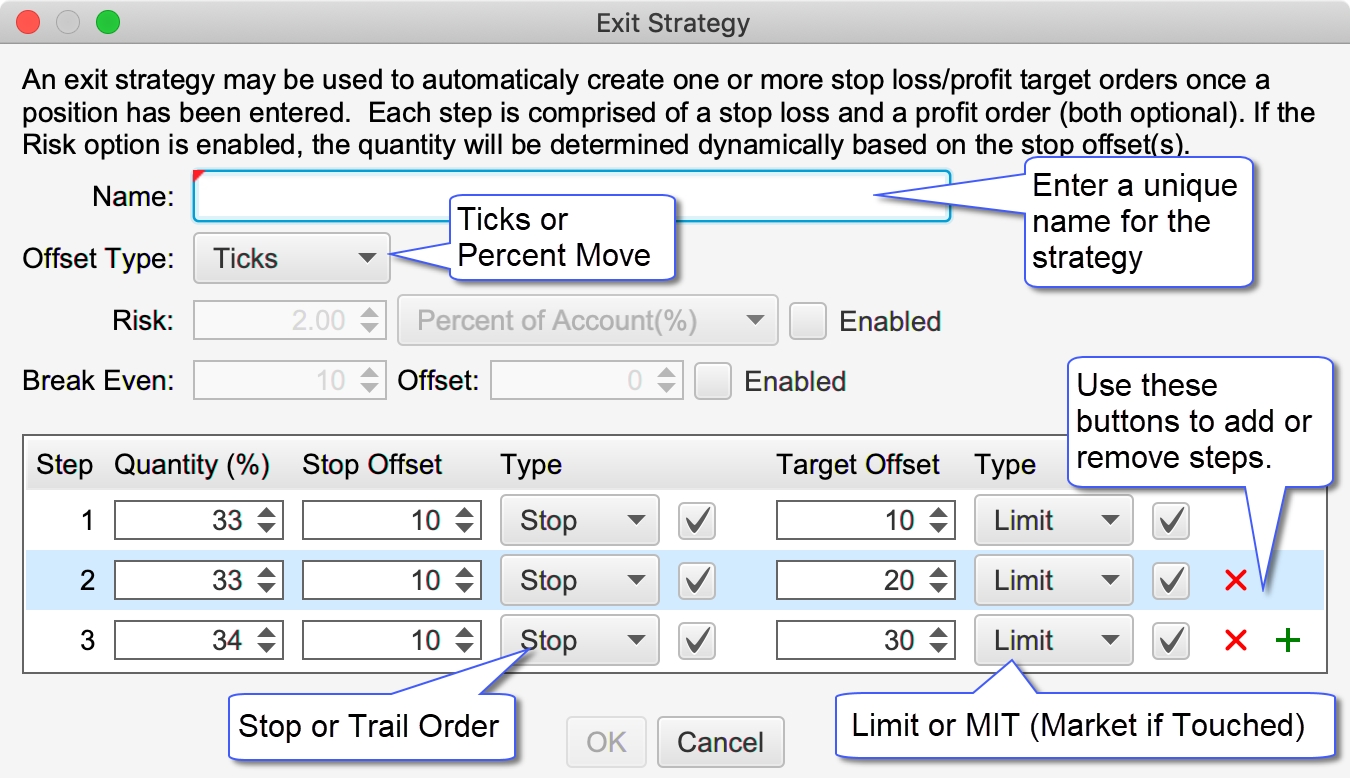
The following dialog is displayed when modifying or creating a new strategy. This dialog has the following options:
Name – Each strategy must have a unique name
Offset Type – Defines the type of offset used (see Stop Offset and Target Offset). There are two options:
Ticks – use a specific number of ticks (minimum price movement for an instrument) from the entry price.
Percent – use a percent of the average entry price. This is often used for stocks. For example, if you set an offset of 1 percent and your average entry on a stock was $10, then the offset would be $10 x 0.01 = 0.10.
Risk – Use these options to automatically set the size (quantity) based on a risk value. There are two risk options that may be used:
Percent of Account (%) – Dynamically calculates the maximum loss based on a percentage of current account balance.
Fixed Amount - Sets the maximum stop loss to the given amount.
Break Even – Sets the number of ticks/percent for the trade to move in a positive (profit) direction before moving the stop loss to break even.
Offset - An additional offset may be specified to set the stop loss above/below the entry price (often used to account for commissions and or spreads).
Step Table – Use this table to define the number of steps (order levels) in this strategy. Each step may have a stop loss and/or target (profit) orders. If both a stop and target order are defined for a step, these orders are submitted as an OCO (one cancels other) order. When one of the orders gets filled the other will be cancelled.
Quantity (%) – This defines the size (quantity) of the order as a percentage of the entry quantity. Quantities are rounded to the minimum step size for the instrument. If all of the steps add up to 100% of the entry quantity then the remaining quantity is assigned to the last step.
Stop Offset – Offset from the average entry price where the stop/trail order will be placed. For a buy (long) position this will be the avg entry – stop offset. For a sell (short) position this will be the entry + stop offset.
Type (Stop Loss) – Two options are available for the stop loss order:
Stop – Regular stop order. When the stop price is hit the order will be filled at market price
Trail – Trailing stop order. The order will follow the price to maintain a maximum of the stop offset away.
Check Box – Use this option to enable or disable the stop order for this step
Target Offset – Offset from the average entry price where the target order will be placed. For a buy (long) position this will be the avg entry + target offset. For a sell (short) position, this will be the avg entry – target offset.
Type (Target) – Two options are available for the target order:
Limit – Limit order. This type of order guarantees the fill price but does not guarantee that the order will be filled when the target price is reached (limit orders are typically filled in the order that they are received by the broker).
MIT – Market if Touched order. This type of order guarantees that the order will be filled when the price is reached. However, the fill price is not (filled at market price).
Check Box – Use this option to enable or disable the target order for this step.
‘+’ or ‘x’ button – use these buttons to add or remove steps.
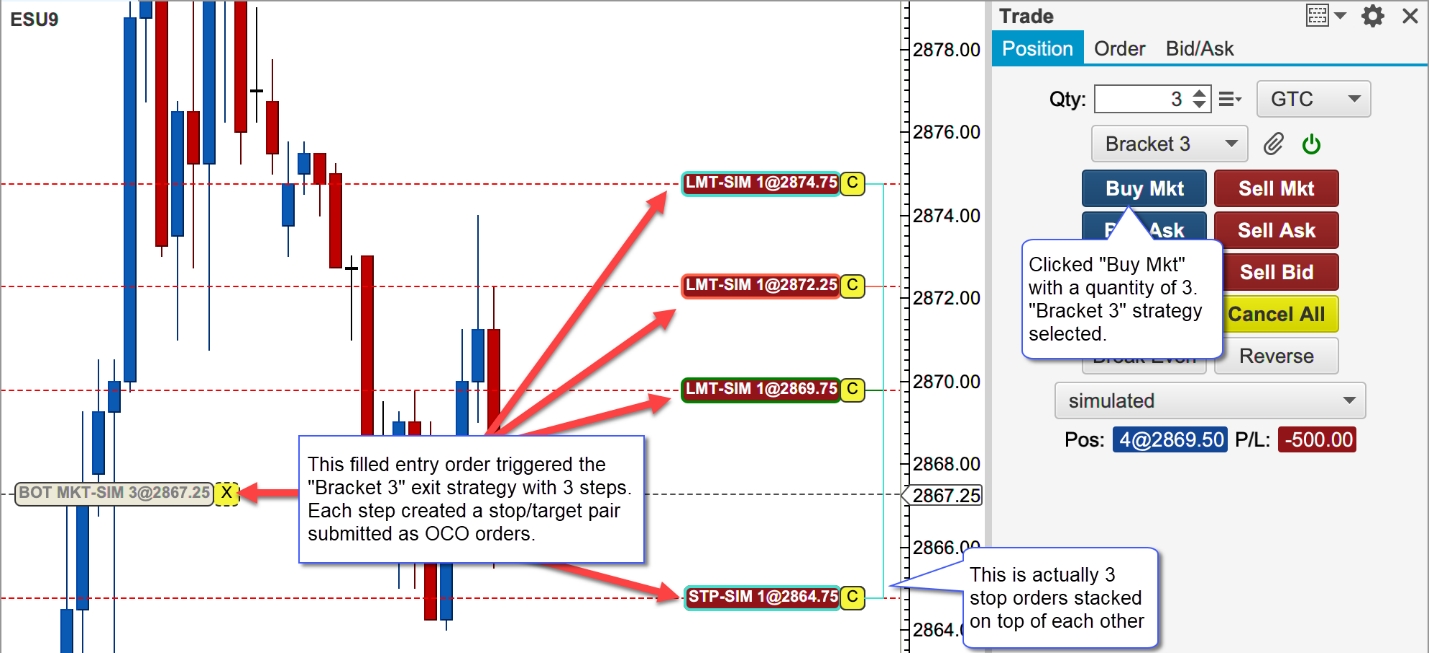
The screen shot below shows the Bracket 3 strategy executed from the Buy Mkt button in the Trade Panel. Three stop/target order pairs were created using the offsets defined above (10 ticks for each stop and 10, 20, 30 ticks for the target orders). Offsets are placed from the average entry price for the filled market order.
Risk Based Strategies
Risk based Exit Strategies are useful for controlling the amount of capital at risk during a trade (see Risk field in the Exit Strategy dialog in the previous section). The risk is controlled by automatically choosing the quantity when placing an entry order. There are two types of risk-based strategies:
Percent of Account – The amount at risk is a percentage of the active account balance. For example, if you had an account balance of $50K and the risk setting for the strategy was 2%, then the amount at risk would be 50K x 0.02 = $1000.
Fixed Amount – With this option you can specify exactly how much money you want to risk in a trade (ie: $500).
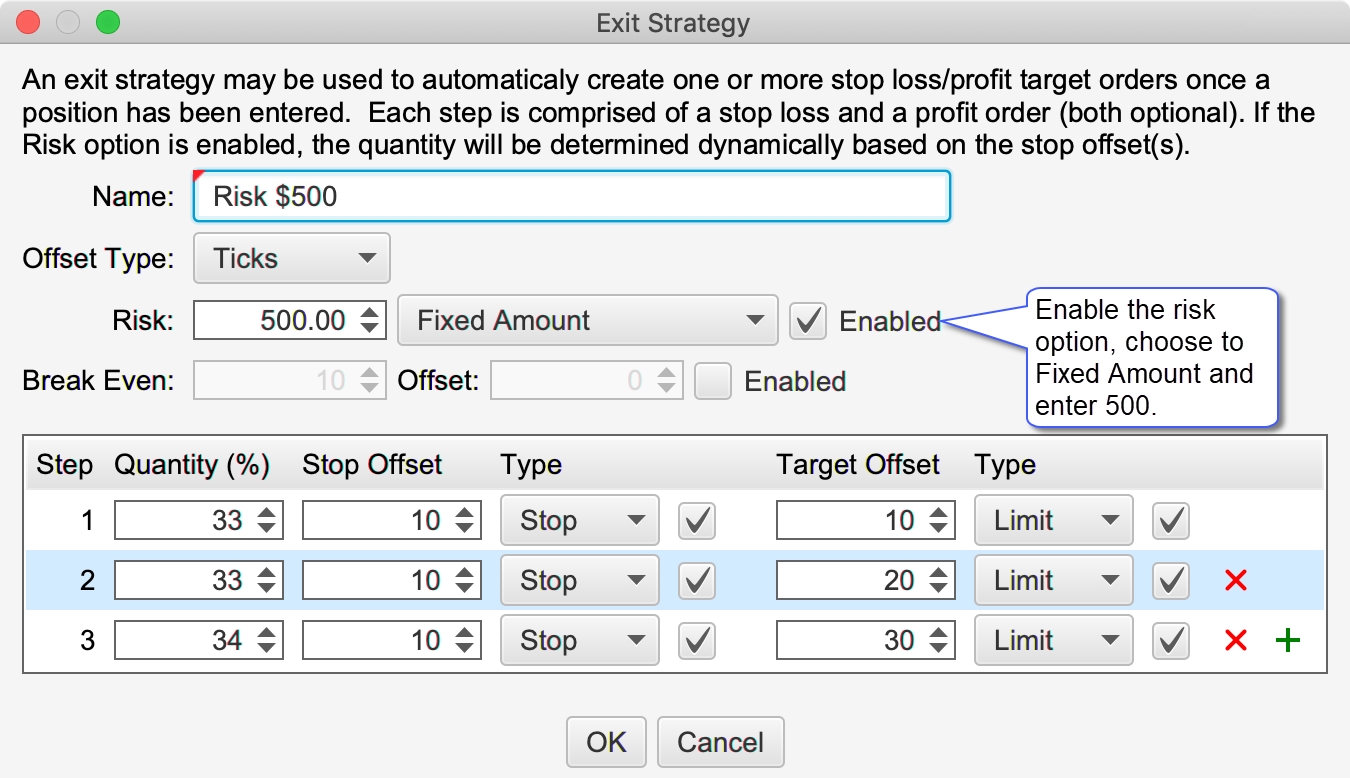
The example below displays the settings for an Exit Strategy that risks a maximum of $500.
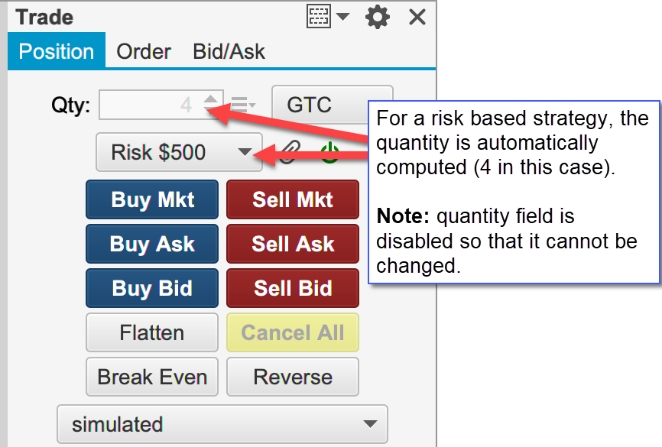
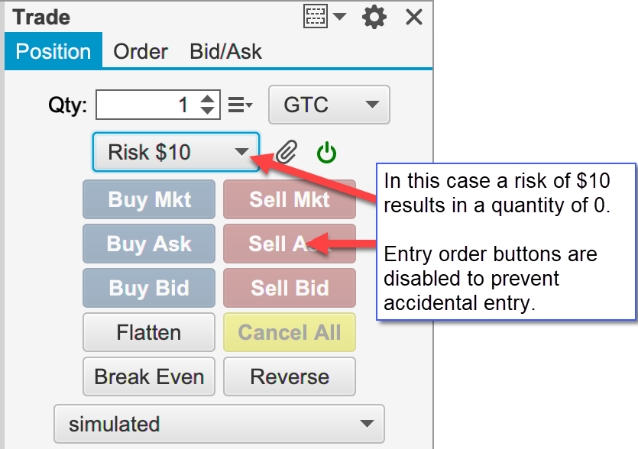
The quantity will be automatically computed when a risk-based strategy is chosen. The quantity field is also disabled so that it cannot be changed. In the screen shot below the “Risk $500” strategy that we defined above has been chosen. Using the stop offsets in the strategy, a quantity of 4 is computed and set in the Qty field.
Depending on the instrument you are trading (and your stop offset settings), it may not be possible to set a quantity that will match exactly the risked amount. In cases like these the quantity value will be rounded down to the nearest valid quantity.
If the risk amount is too low, the quantity may work out to 0. In this case the order entry buttons will be disabled to prevent placing an order since the maximum risk amount cannot be met.
Trade Panel
Note: Customizable features (including defaults and templates) are only available in the Professional Edition and above. Editions below this will use the default trade panel layout.
Default Layout
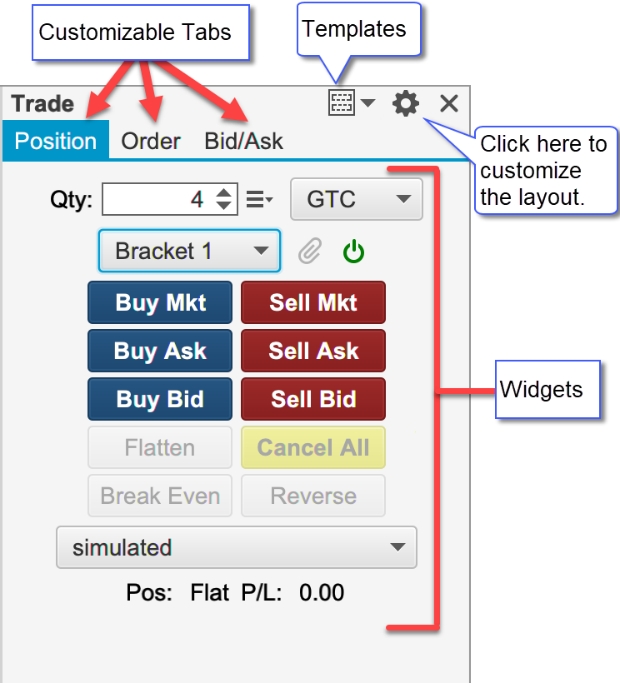
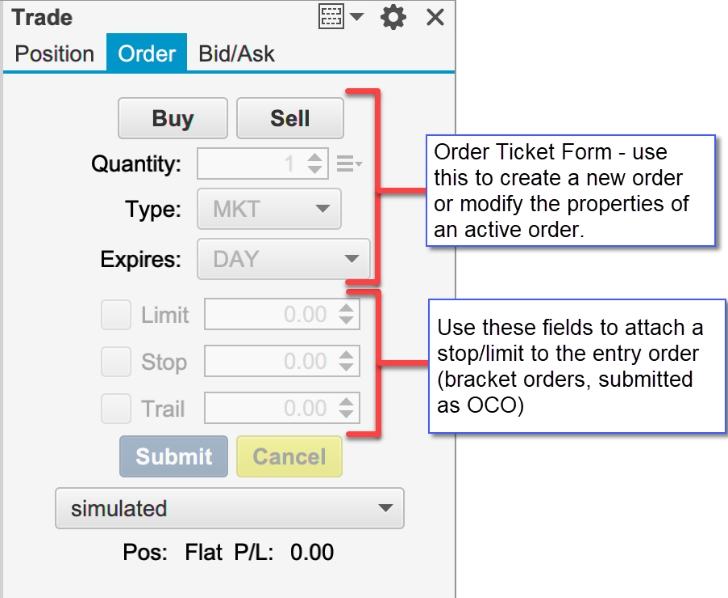
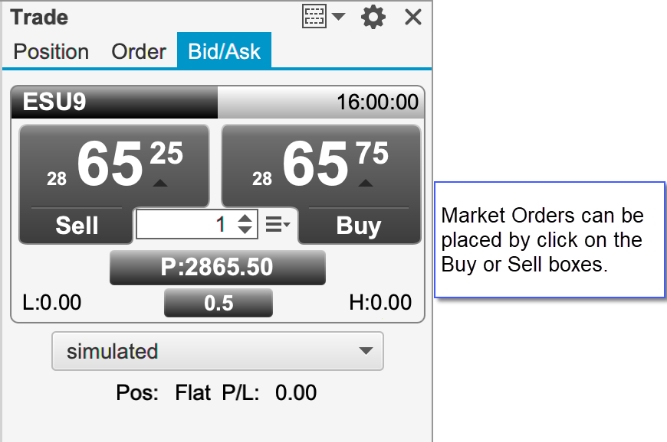
The default layout is very similar to the layout in previous versions of MotiveWave™. This layout consists of three tabs:
Position – Used to create and manage open positions. Several new buttons have been added to this layout. A Time in Force choice and Exit Strategy control have also been added.
Order – Use this tab to place and modify existing orders. Stop/Trail and Limit orders can also be attached for a stop loss and profit target.
Bid/Ask – This tab contains a buy/sell box for quickly placing market orders.
Trade Panel Preferences
Click on the preferences icon (gear) in the top right corner of the Trade Panel to modify the preferences.
The General tab contains the following options:
Location – Left or Right side of the chart
Exit Attach – Determines the base price for computing offset values in the Exit Strategies:
Entry Price – Average Entry Price for the Position. this is the same as the average fill price for an entry order.
Last Price – Last traded price
Show Order Ticket Panel When Selecting an Order – If this is checked, the Order tab will be shown when an order is selected in the chart. The order ticket form will be filled with the order properties.
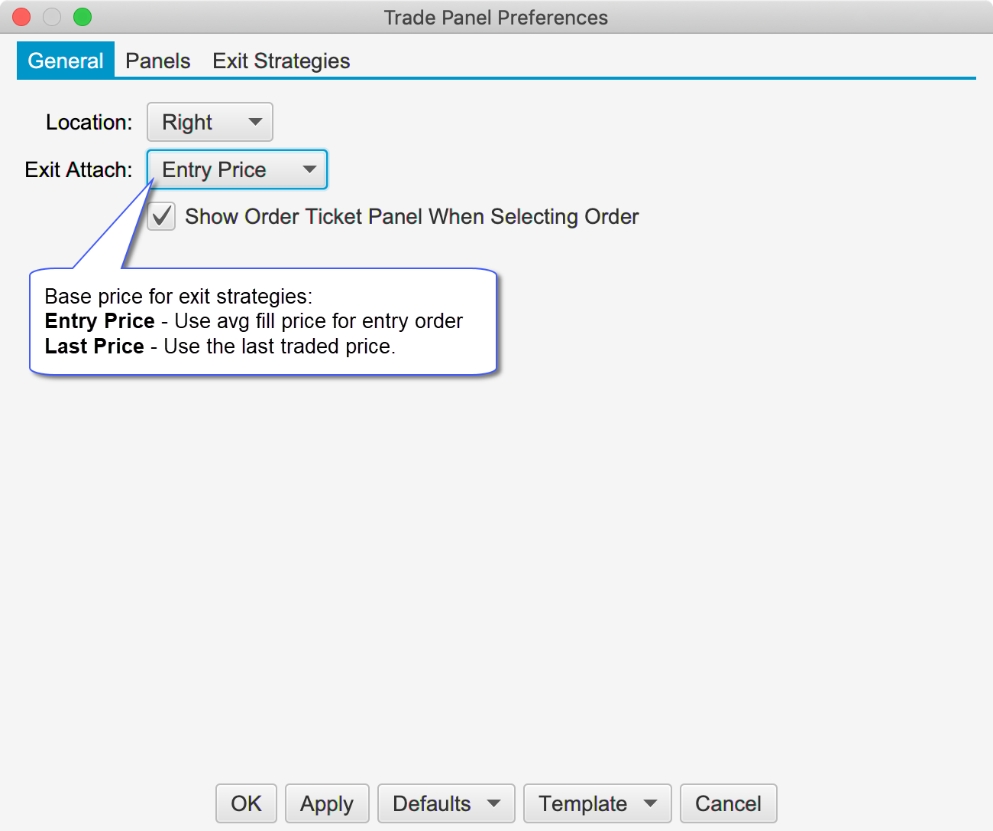
Customizing the Layout
The layout of the Trade Panel can be customized from the Panels tab. Existing panels can be modified or deleted. New panels can be added by clicking on the + button.
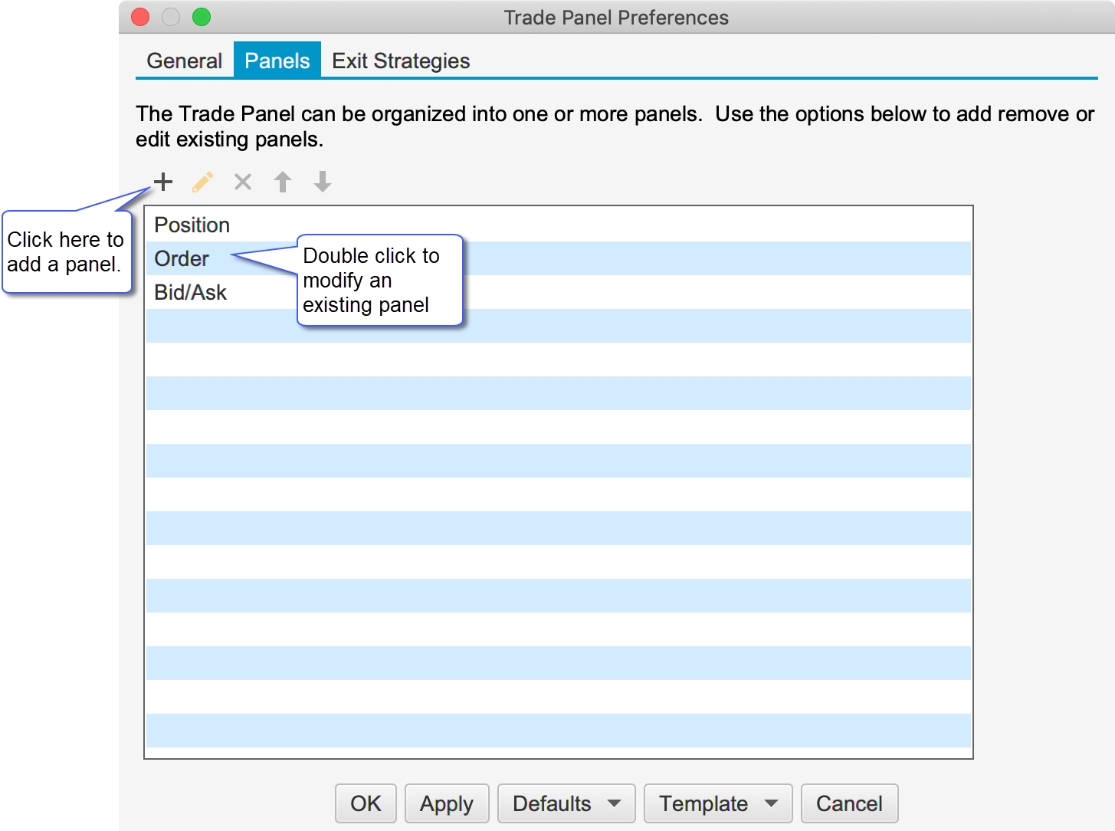
The Edit Panel dialog contains a table of widgets (form controls). Each row in the table represents a row in the panel (arranged vertically). Optionally a row can have one of the following layouts:
Grid – Widgets within the grid are centered in the row with a fixed number of columns. Optionally a widget may span multiple columns.
Flow – Widgets are arranged from left to right in a row. If there is not enough space, the widgets are wrapped around to the next line.
The screen shot below shows the Edit Panel dialog for the existing Position panel. Rows may be added to the layout by clicking on the + button. Existing rows may be modified or removed by selecting and pressing the edit/delete buttons.
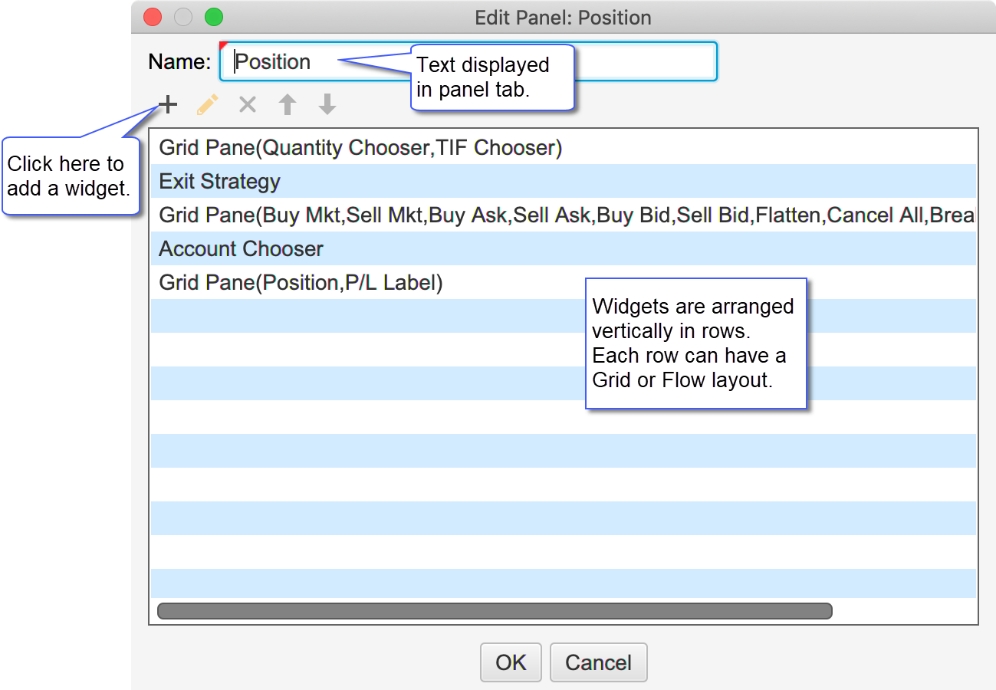
The screenshot below shows how to add a new widget to a panel. The vertical order of the widgets can be adjusted by dragging them up/down or selecting and using the up/down arrow buttons.
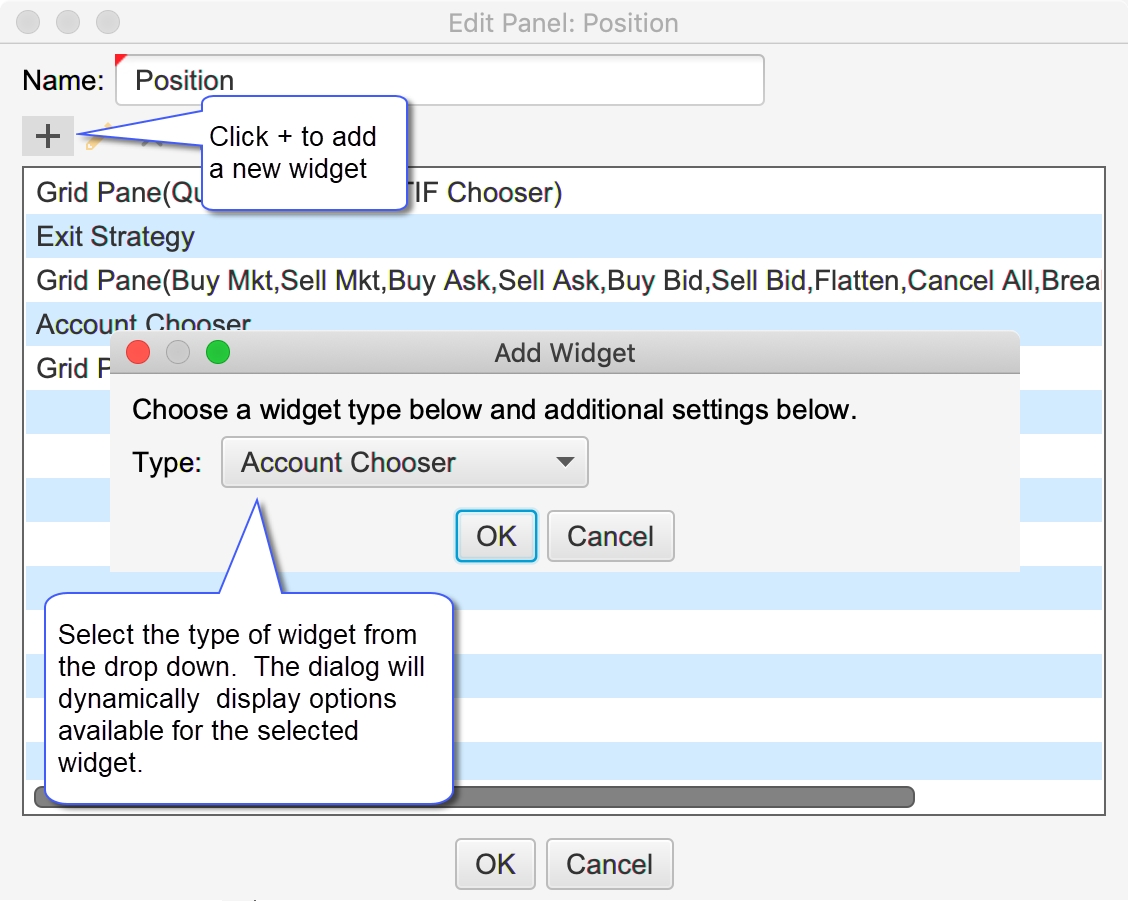
Widgets
A widget is a generic name for a control, button, label or layout/formatting that can be added to a panel. The following widgets are currently supported:
Controls
Controls are used to execute actions or set properties. The following controls are currently supported:
Account Chooser – Selects the active account for the chart. This account will used for placing, modifying or cancelling active orders.
Buy/Sell Box – Buy/Sell box for placing market orders. This control also contains a quantity chooser and labels for display information such as Day High/Low/Last Price etc.
Exit Strategy – Selector for the active exit strategy and buttons for attaching to an existing position and enabling/disabling the control
Order Ticket – Order ticket form. This may be used to create new orders or modify/cancel existing orders
Quantity Chooser – Allows you to set the quantity for placing an order.
Quantity Selector – Contains preset quantities (in horizontal tab format) for quickly selecting a quantity for order placement.
TIF Chooser – Selects the Time in Force attribute for placing new orders.
Buttons
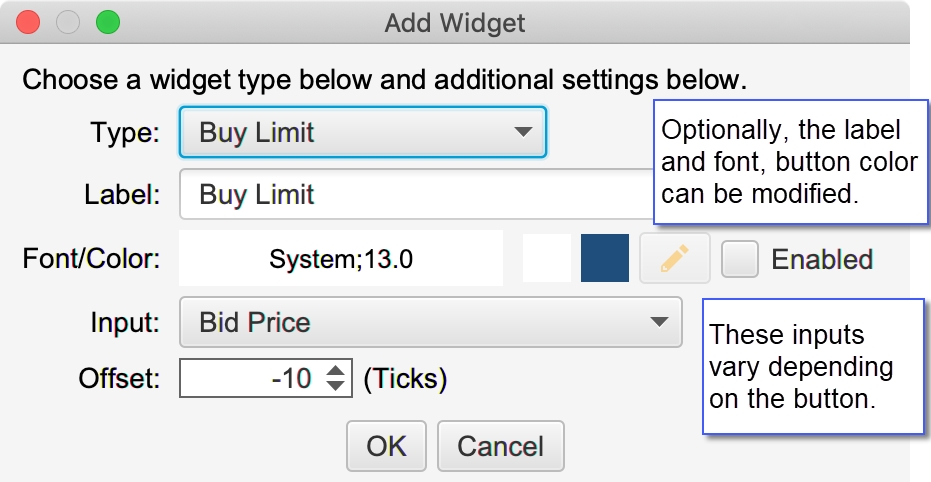
Buttons are used to execute an action such as placing or cancelling an order. The label, font and color can be customized for any button. Some buttons include additional parameters (such as offset) for customizing the behavior.
Break Even – Creates a stop or limit order at the break-even price for an open position (stop if you are showing a profit, limit if showing a loss). The optional Offset will add an offset (in ticks) to your breakeven price, this can be used for breakeven +1 tick to cover commission costs.
Breakout – Creates two stop orders above and below the current market price with the given offset. When one of the orders is filled the other is canceled (OCO orders). This may be used to enter the market in the direction of trend when it breaks out of a fixed range.
Break Down/Fade Up – Creates a sell stop order below the market and a sell limit above the market with the given offset. These orders are submitted as OCO (One Cancels Other)
Break Up/Fade Down - Creates a buy stop order above the market and a buy limit below the market with the given offset. These orders are submitted as OCO (One Cancels Other)
Buy Ask – Submits a buy limit order at the ask price. Optionally an offset may be set to place the order a given number of ticks below the ask.
Buy Bid – Submits a buy limit order at the bid price. Optionally an offset may be set to place the order a given number of ticks below the bid.
Buy Limit – Submits a buy limit order at a given number of ticks from the input value (Bid Price, Ask Price, Last Price, Day High, Day Low, Open or Previous Close)
Buy MIT – Similar to Buy Limit, but places a Market If Touched order instead.
Buy Mkt – Places a Buy Mkt order
Buy Stop – Similar to Buy Limit, but places stop order instead.
Cancel All – Cancels all active orders for the given instrument and account.
Cancel Buys – Cancels all active buy orders for the given instrument and account.
Cancel Sells – Cancels all active sell orders for the given instrument and account.
Fade – Creates a Sell Limit above the market and Buy Limit below the market using a given number of offset ticks (submitted as OCO orders). This may be used to trade an instrument that is range bound (stays within a given price range).
Flatten – Closes an open position at market price (for the given instrument and account).
Flatten All – Same as Flatten, but also cancels active orders.
Reverse – Closes an open position and opens a new position in the opposite direction (with the same quantity).
Sell Ask – Similar to Buy Ask, but submits a Sell order instead.
Sell Bid – Similar to Buy Bid, but submits a Sell order instead.
Sell Limit – Similar to Buy Limit, but submits a Sell order instead.
Sell MIT – Similar to Buy MIT, but submits a Sell order instead.
Sell Mkt – Similar to Buy Mkt, but submits a Sell order instead.
Sell Stop – Similar to Buy Stop, but submits a Sell order instead.
The screen shot below shows an example of a button dialog. The available parameters (such as input or offset) will be different depending on which button is selected.
Labels
Labels display live information:
P/L Label – Current Profit/Loss for the given instrument and account.
P/L Price Label – Current Profit/Loss measured in price movements instead of a dollar amount.
Position – Current open position and entry price for the given instrument and account.
Spread – Difference between the best bid and best ask prices for the given instrument.
Formatting
Formatting widgets are useful for controlling how the other widgets are arranged on the panel:
Flow Pane – Contains a set of widgets that are arranged from left to right. When there is no more room to display on the current row, the remaining widgets are wrapped onto the next line.
Grid Pane – Contains a set of widgets that are arranged in a grid with a fixed number of columns. The number of rows depends on how many widgets are in the pane.
Horizontal Spacer – Adds horizontal space between widgets
Divider – Draws a horizontal divider (typically displayed on a single row)
Vertical Spacer – Adds vertical space between rows.
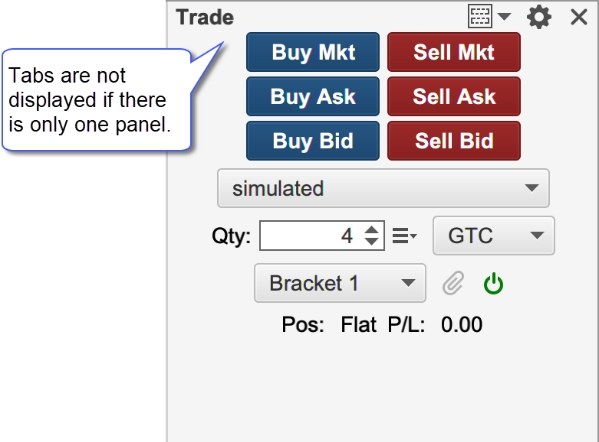
The screen shot below shows an example of customizing the trade panel. In this case there is only one panel, so the tabs are not displayed.
Cancel Existing Orders
An option has been added to cancel existing orders on the same account before executing a button action. This applies to the following custom buttons in the Trade Panel/DOM: Break Even, Flatten and Reverse.
Defaults
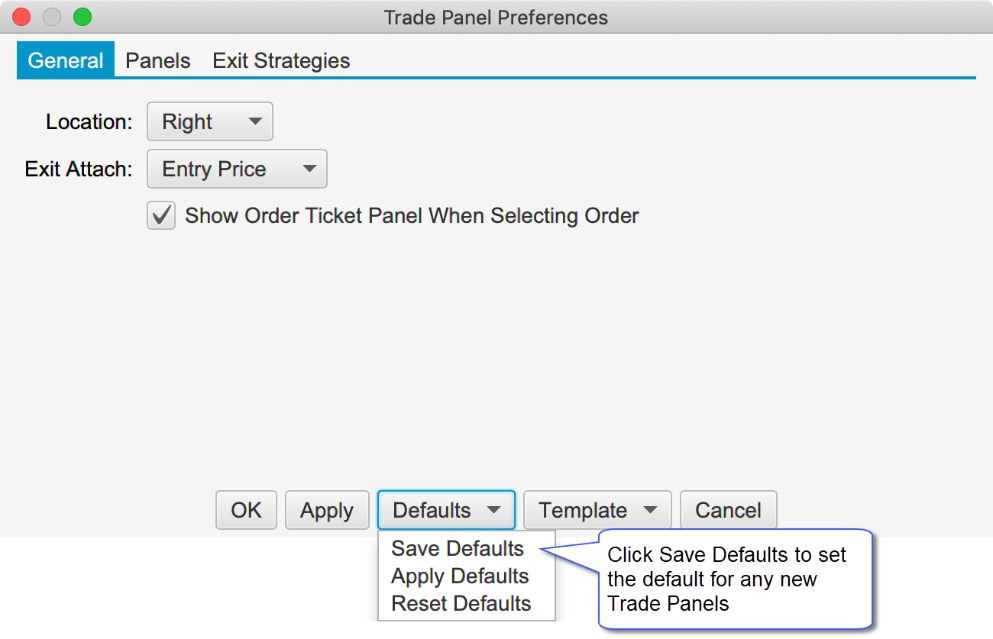
When the trade panel is modified, the changes are only applied to the active trade panel within the chart. The default layout can be modified from the Preferences Dialog (click on the gear icon in the top right corner of the trade panel). At the bottom of the dialog, click on the Defaults button. This will set the default for any new Trade Panels that are created (but will not affect existing Trade Panels).
Reverse Button
The functionality of this button has been changed to cancel all open orders (for the instrument/account) before reversing the position.
Templates
Templates can be very useful for creating and applying multiple layouts. If you are trading different instruments you may want to have one or more Trade Panel layouts. From the template drop down button at the top of the Trade Panel there are options to Save, Manage or apply templates (there is also a Template button at the bottom of the Trade Panel Preferences dialog).
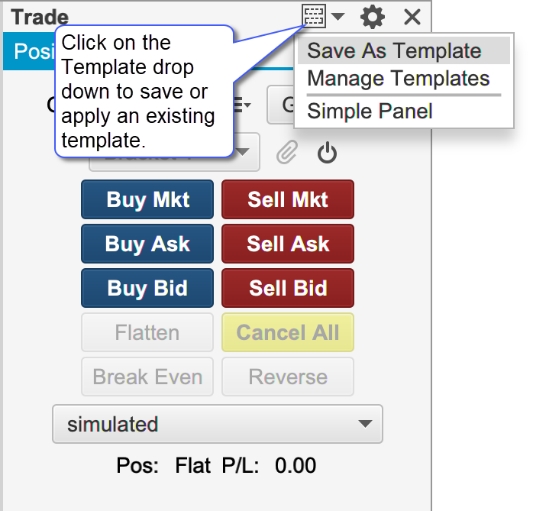
In the screen shot below we are saving the customized Trade Panel that we created in a previous section as “Simple Panel”. This new template can then be applied to another trade panel by selecting it in the Templates button drop down.
Advanced Depth of Market (DOM)
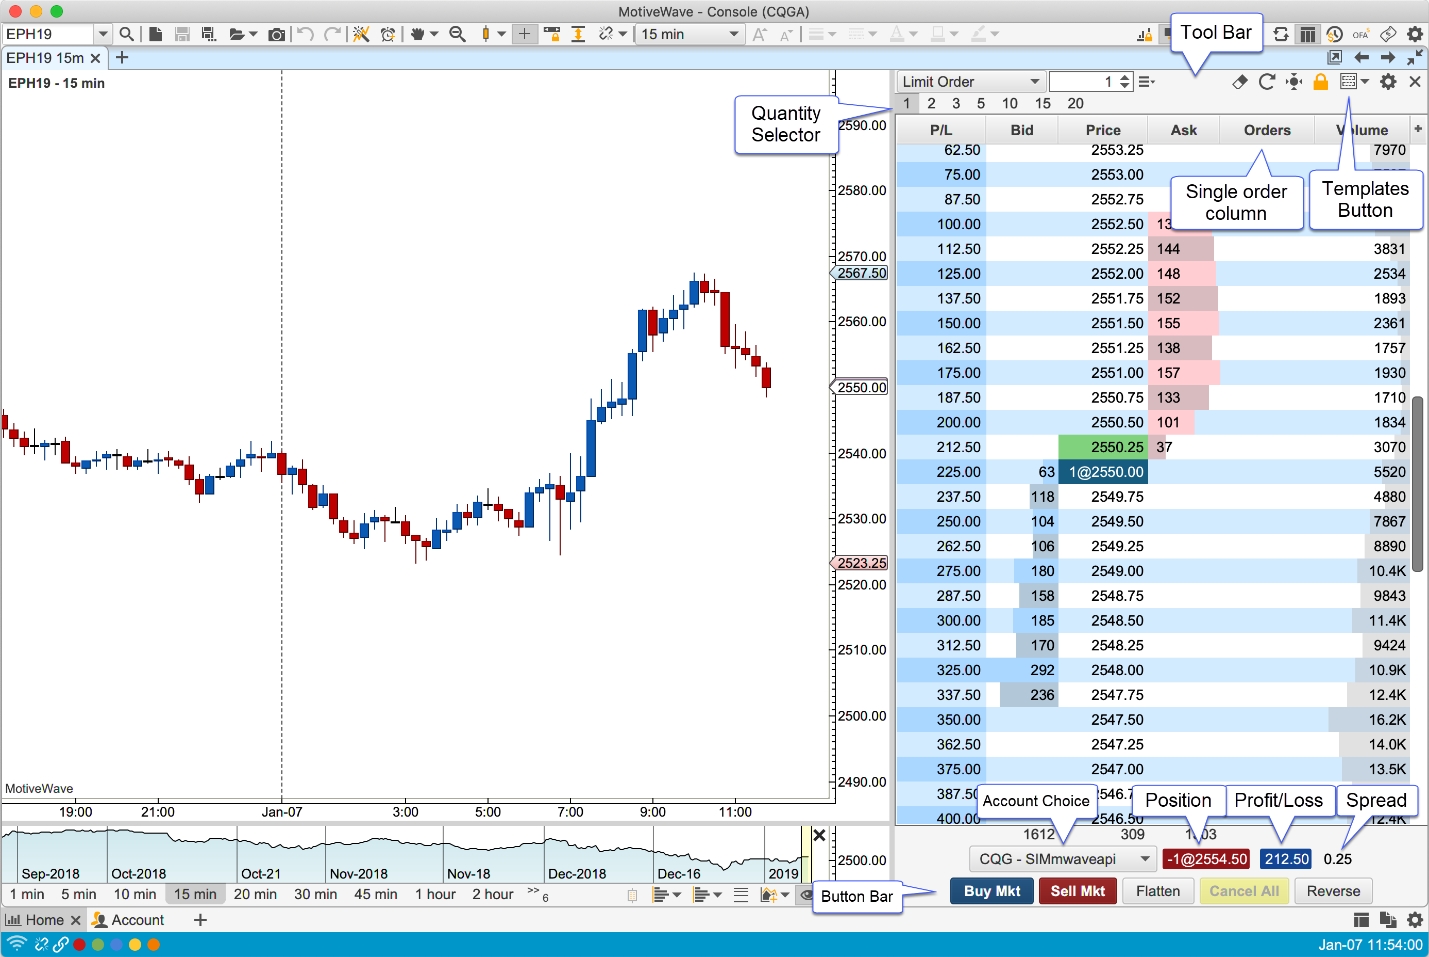
Some significant enhancements have been added to the Depth of Market panel (DOM). The default DOM layout is similar to the version 5 DOM with the exception of a single order column and 3 extra buttons added to the tool bar.
DOM Columns
Columns may be added/removed from the DOM table by click on the ‘+’ button in the top right corner of the table (to the right of the column headers).
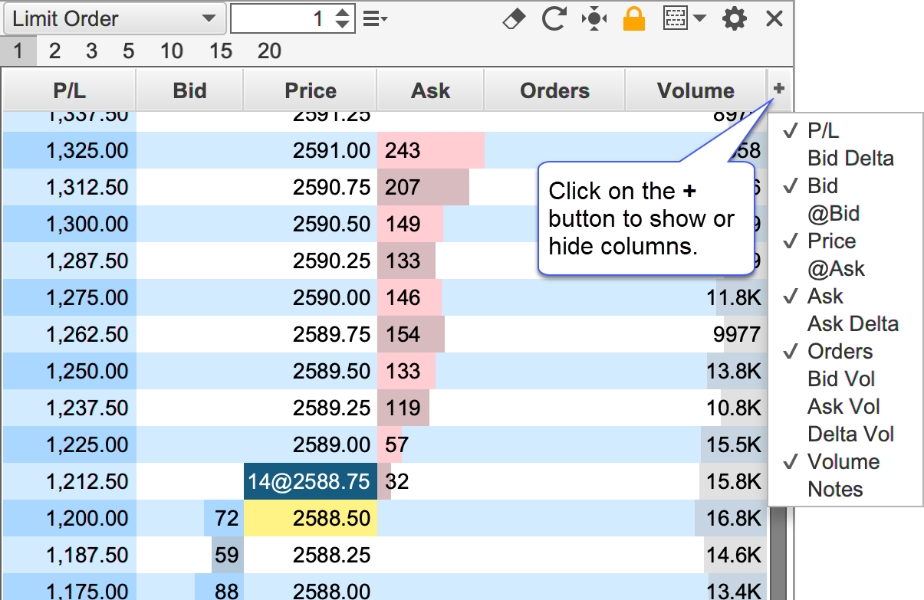
The following columns are available:
P/L – Profit/Loss calculated for each price level using the current open position.
Bid Delta – Tracks the difference in contracts added/removed from the current bid size (see Bid column) for all depth levels in the DOM book (see bid column). These values are calculated on every DOM book update and are reset when the last price changes.
Bid – Displays the quantities of the current buy orders at the given price.
@Bid – Tracks the contracts traded at the bid price since that last reset (see reset button on the tool bar).
Price – Displays the price level for the row. If “Show Pips Only” is enabled (see General tab of the Properties dialog), this will be rounded to the nearest pip (FOREX only).
@Ask - Tracks the contracts traded at the ask price since that last reset (see reset button on the tool bar).
Ask – Displays the quantities of the current sell orders at the given price.
Ask Delta - Tracks the difference in contracts added/removed from the current ask size (see Ask column) for all depth levels in the DOM book (see bid column). These values are calculated on every DOM book update and are reset when the last price changes.
Orders – Displays active orders at each price level. If “Single Order Column” is unchecked (see General tab of the Properties dialog below), then there will be two of these columns (buy and sell orders).
Bid Vol – Daily volume traded at the bid price.
Ask Vol – Daily volume traded at the ask price
Delta Vol – Difference between the ask and bid volume at the given price.
Volume – Daily volume traded at the given price.
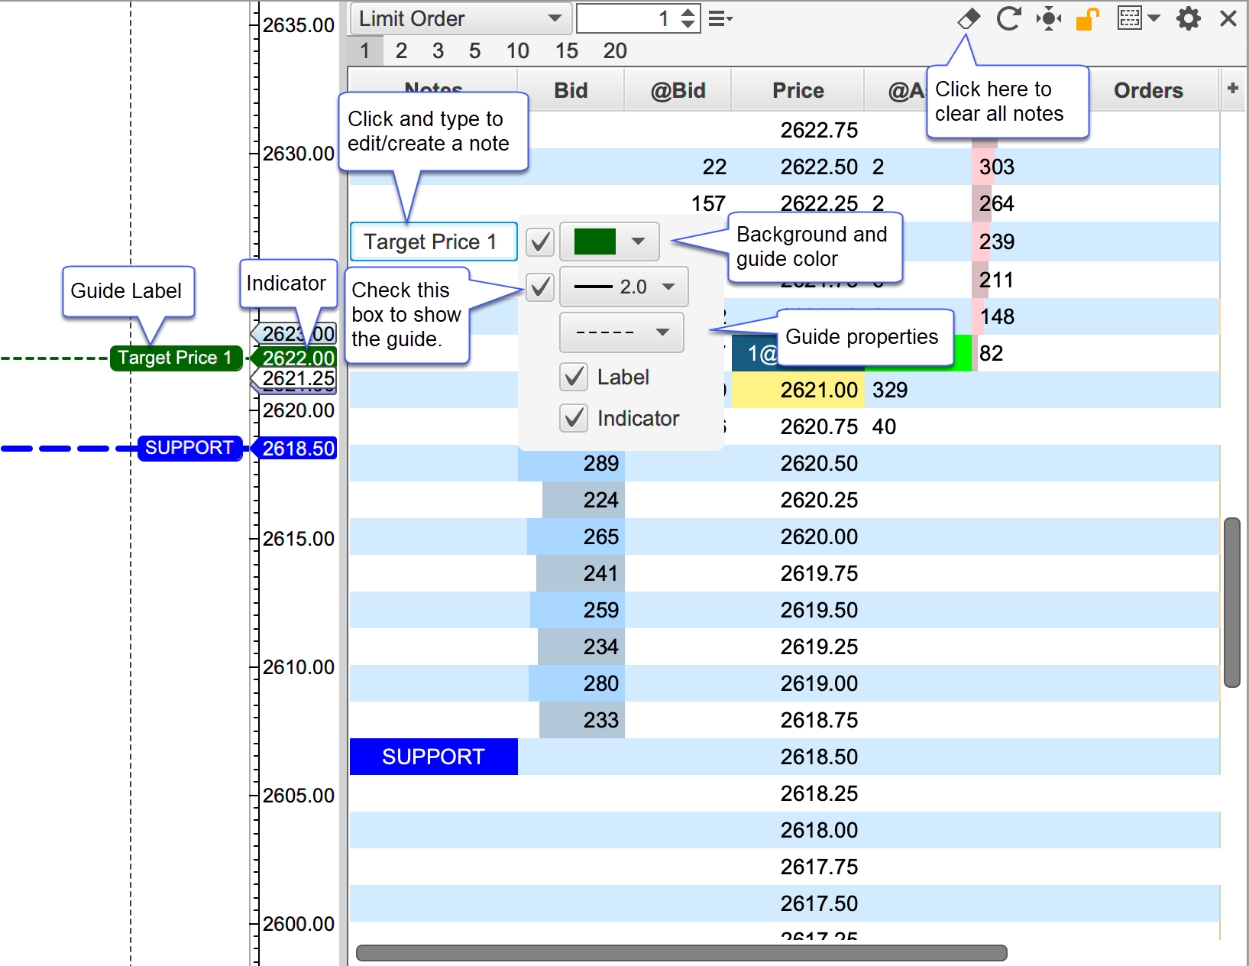
Notes – Displays a text note that you can add to each price level (click on the field and type). All notes can be removed by pressing the eraser button on the tool bar.
Preferences
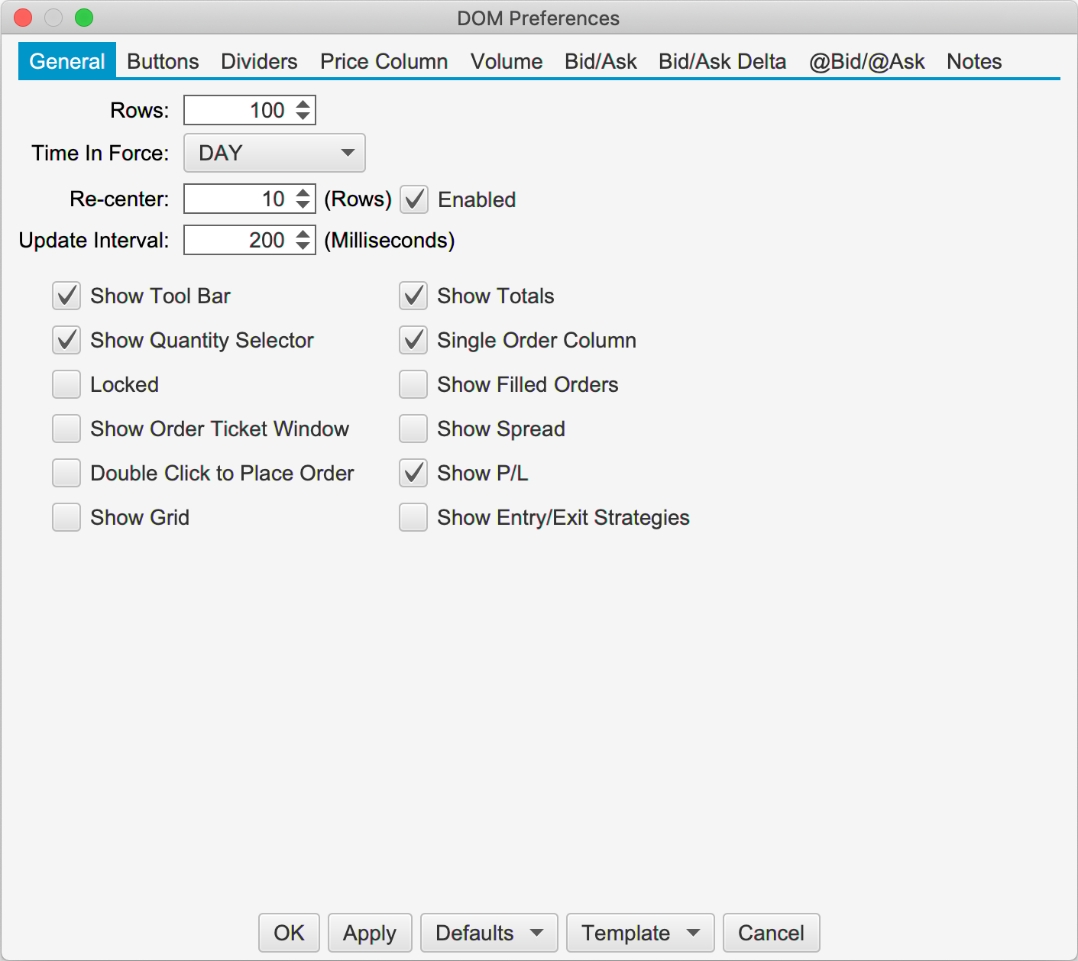
Configuration information for the DOM panel can be found in the DOM Preferences dialog (click on the gear icon in the toolbar). The dialog contains several tabs which are described in the following sections.
General Preferences
The following configuration options are available from the General tab:
Rows – Number of rows to display in the DOM (default 100).
Time in Force – Time in force setting for orders placed from the DOM.
Re-center – Defines the range (number of rows above/below the current center) for resetting the center point for the DOM. When the last price (or midpoint) crosses the top or bottom of the range the DOM will be centered on the current price.
Update Interval – Sets the update threshold for depth of market updates (bid/ask quantities). By default, the table will be updated a maximum of once every 200 milliseconds.
Show Tool Bar – Toggles the display of the tool bar at the top of the DOM panel. If this is turned off, the preferences button (gear icon) will display in the button bar at the bottom.
Show Quantity Selector – Toggles the display of the preset order quantities.
Locked – If the DOM is locked, you cannot place or modify orders. Uncheck this option if you want to manage orders in the DOM.
Show Order Ticket Window – Displays the order ticked window when placing an order from the DOM.
Double Click to Place Order – Place orders on double click (as opposed to single click).
Show Grid – Toggles the display of the grid in the DOM table.
Show Totals – Toggles the display of the totals for Bid/Ask Sizes and the delta at the bottom of the DOM table.
Show Pips Only – Rounds each price level in the table to the nearest pip. (FOREX only, not shown in the screen shot below).
Single Order Column – Displays all orders in a single column (instead of having separate buy and sell order columns).
Show Filled Orders – Displays filled orders in the order column(s).
Show Spread – Toggles the display of the spread field.
Show P/L – Toggles the display of the current unrealized profit/loss label.
Show Entry/Exit Strategies – Toggles the display of the Entry/Exit strategy panel (for customized order entry/exit).
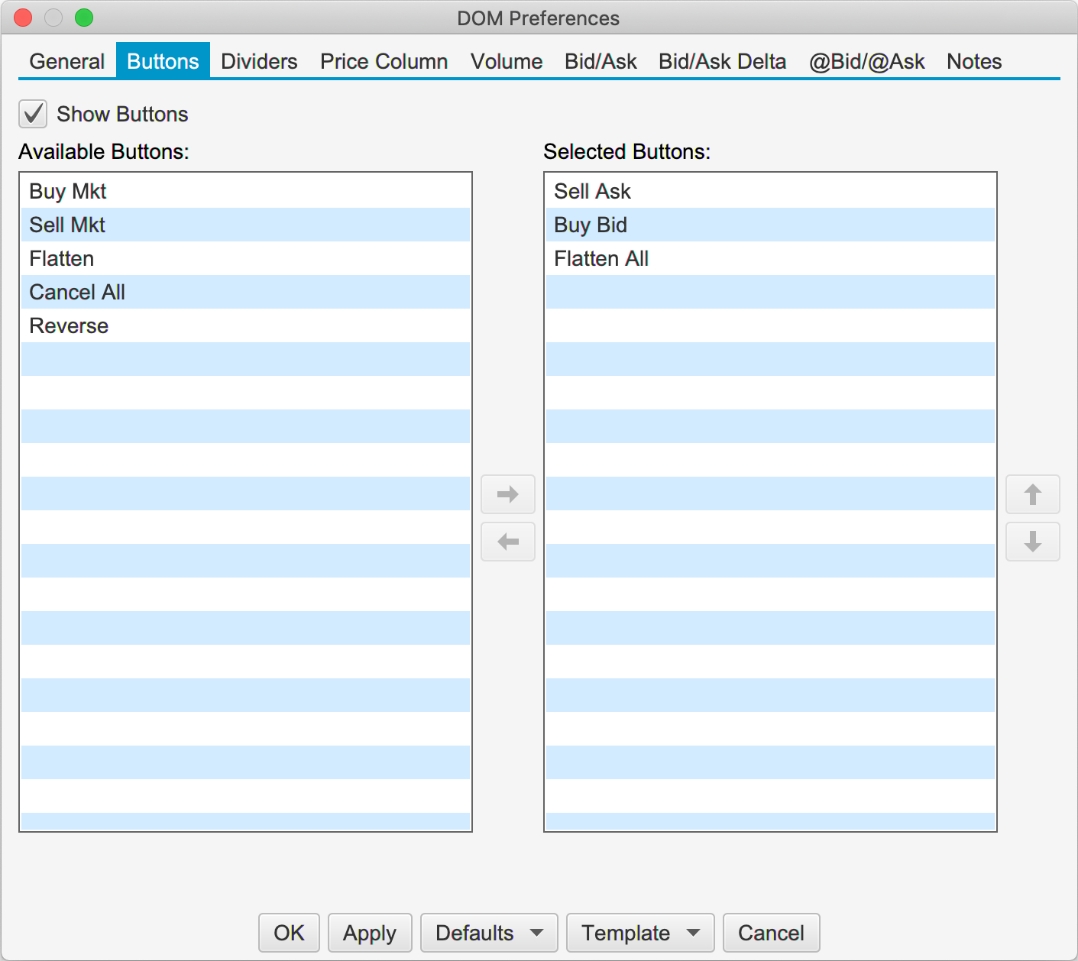
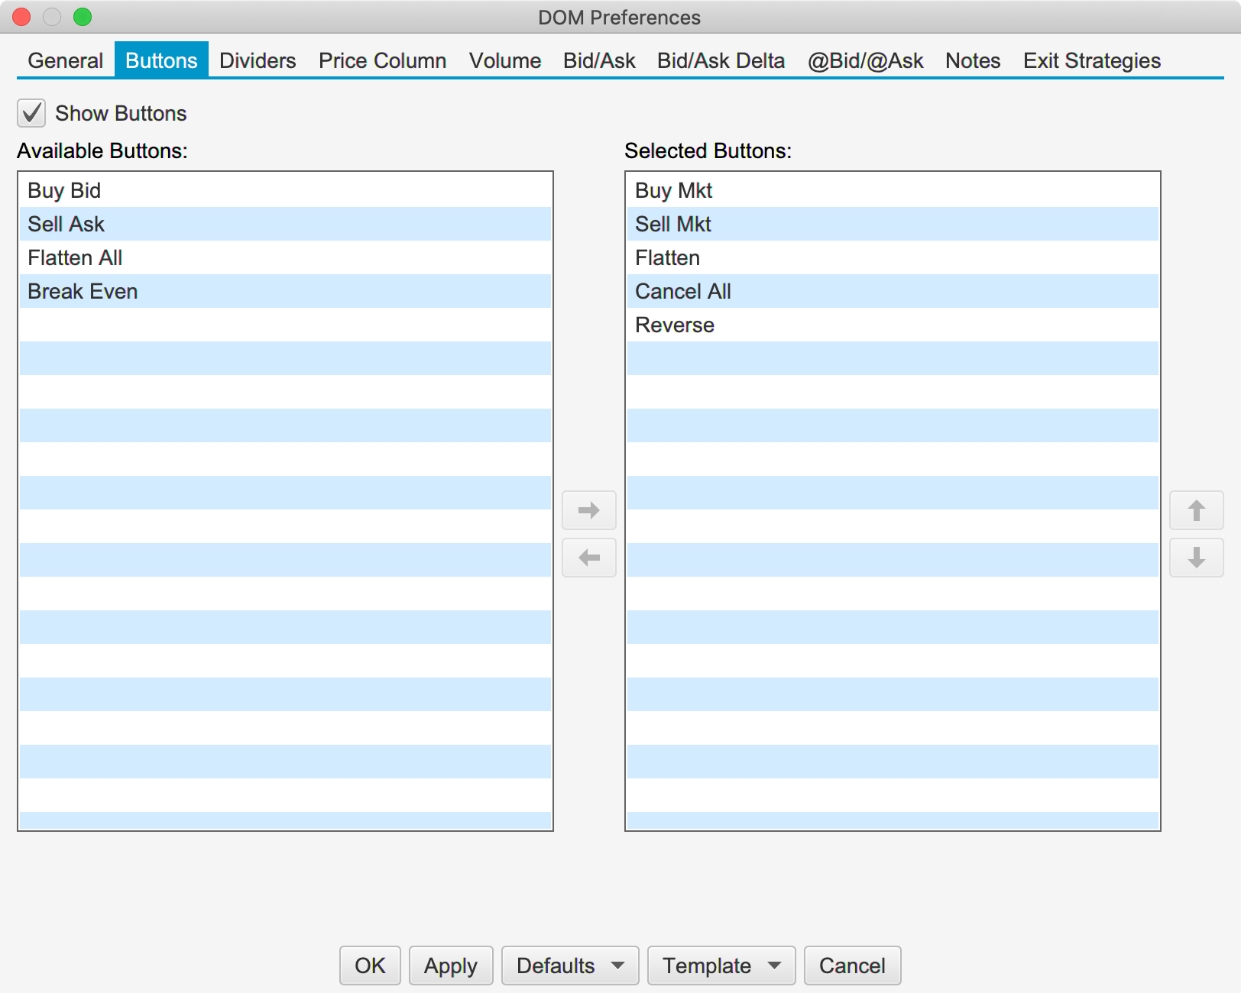
Buttons
The order buttons available at the bottom of the DOM may be customized from the “Buttons” tab of the preferences dialog. Orders placed using these buttons will use the current quantity in the tool bar and the Time in Force setting from the General tab.
Show Buttons – Toggles the display of the order button section (see bottom of DOM panel).
Buy Bid – Creates a limit order at the current bid price.
Sell Ask – Creates a sell limit order at the current ask price.
Flatten All – Cancels all open orders (for the given instrument and account) and closes the open position at market price. This is the same as pressing Cancel All and Flatten (see below).
Buy Mkt – Places a buy market order.
Sell Mkt – Places a sell market order.
Flatten – Closes the open position at market price.
Cancel All – Cancels all open orders for the given instrument and account.
Reverse – Reverses the current position. For example, if you were long 3 contracts, this will close the open position and create a short position of 3 contracts at market price.
Dividers
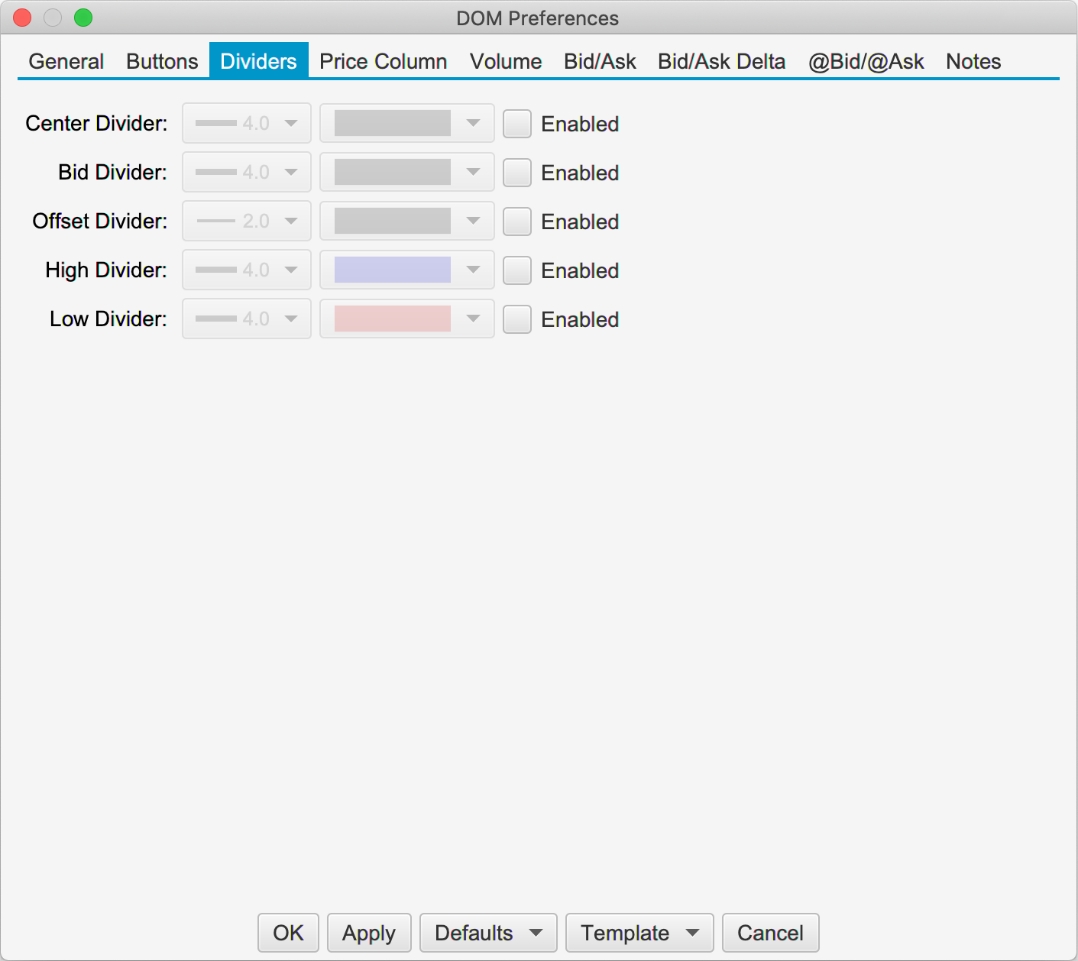
Dividers may be used to highlight key price levels in the DOM table. The divider is placed between the rows and can be assigned a thickness and color:
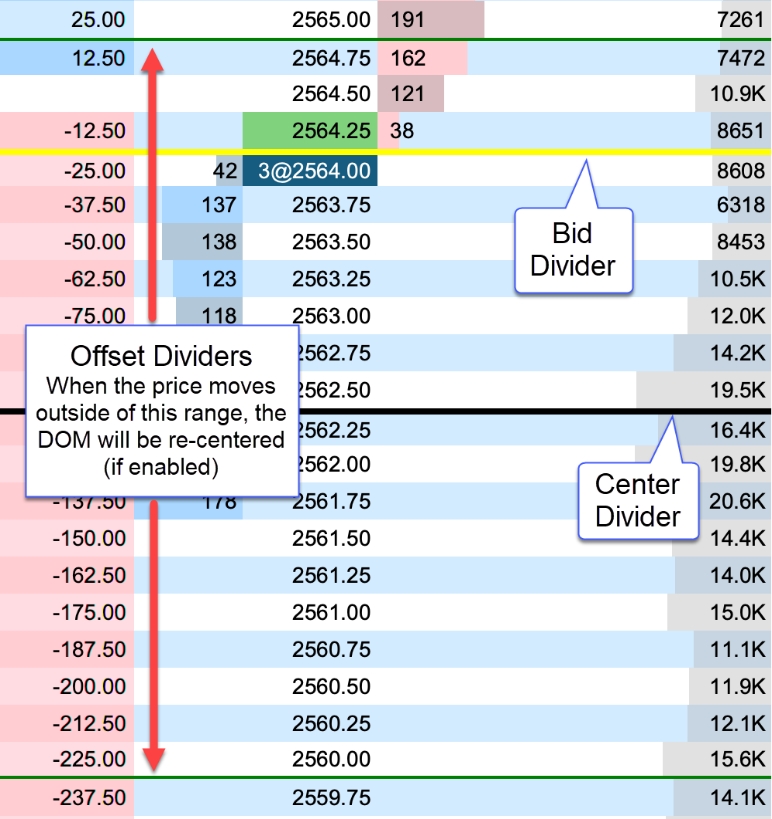
Center – Center of the DOM. This will change when the DOM is re-centered.
Bid – Divider is placed just above the current bid price.
Offset – Shows the re-center threshold above and below the center price (see re-center option in General tab).
High – Daily high price. The divider is placed above this row.
Low – Daily low price. The divider is placed below this row.
The example below shows the bid, center and offset dividers enabled in the DOM. The offset dividers indicate when a re-center will occur (green dividers below).
Price Column
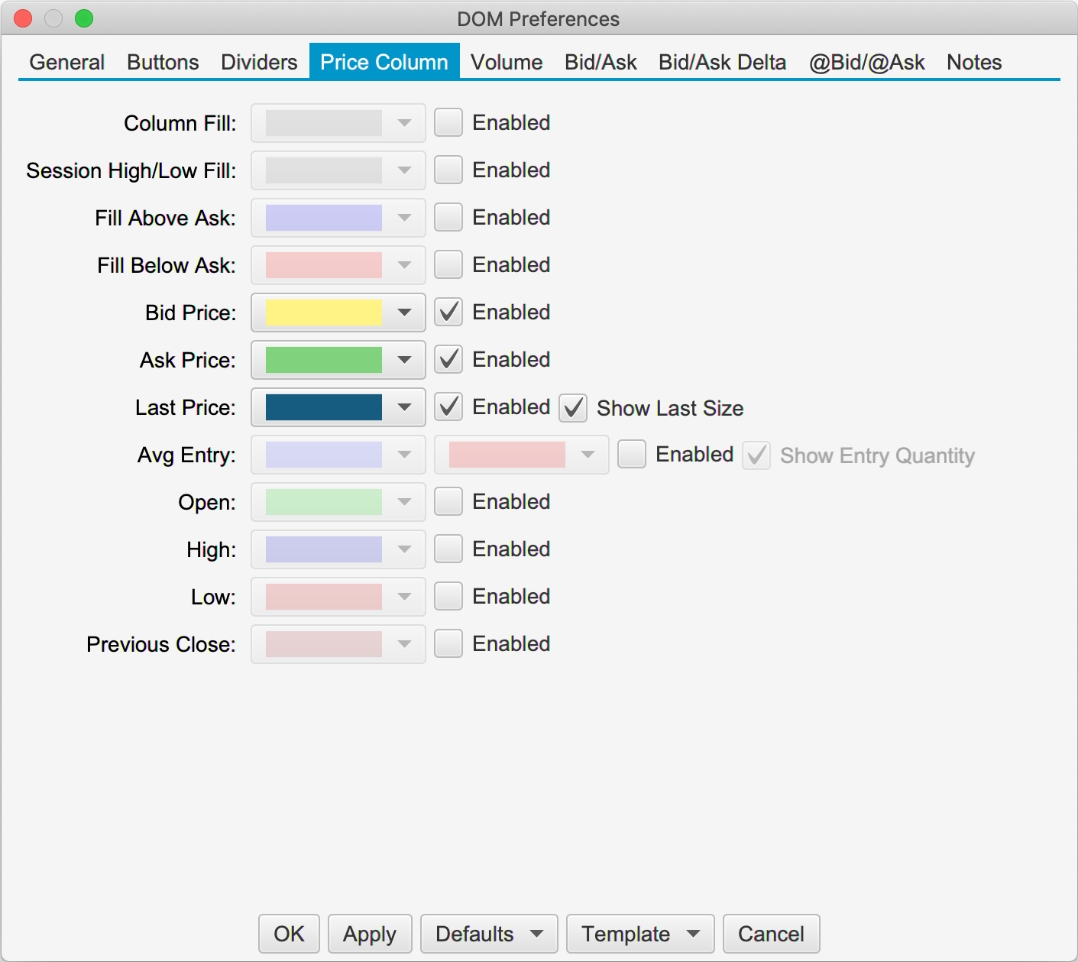
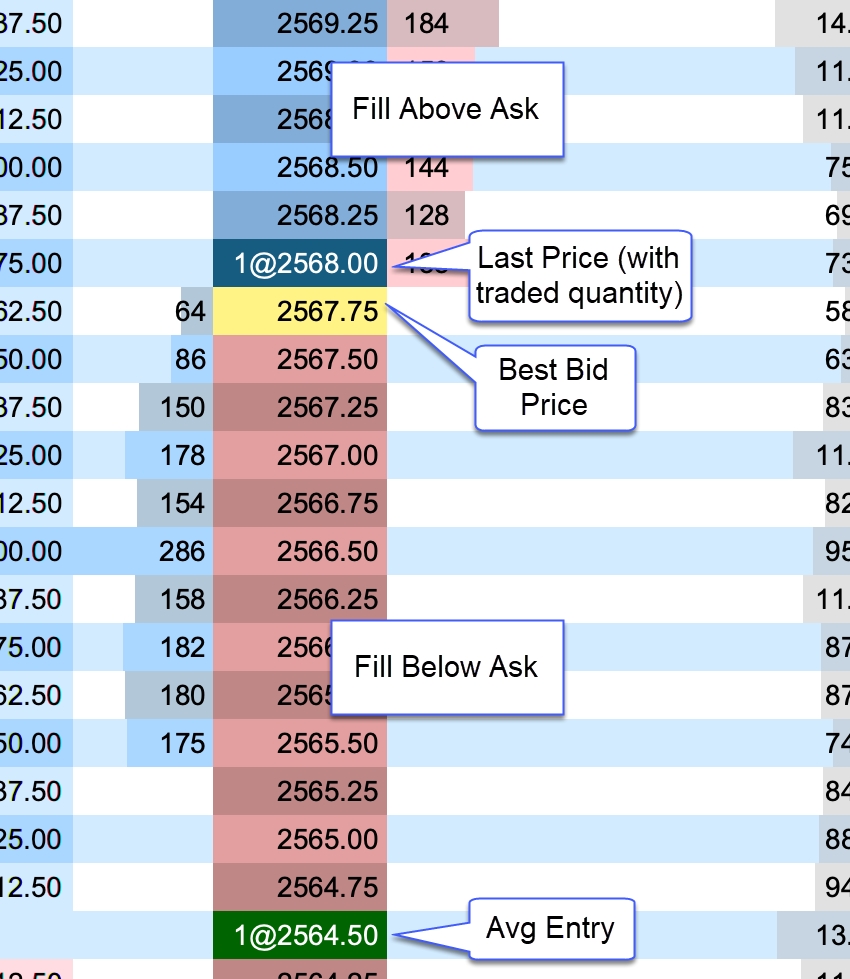
Below are the options available for configuring the price column. Note: background fills that span several rows will use striping to help visualize the distinction between rows in the table:
Column Fill – Default background fill for price column. This is the color used to fill the price cells unless they are overridden by another setting.
Session High/Low Fill – Fill for the price rows that are between the high and low for the day’s trading session.
Fill Above Ask – Fill for the prices above the current ask price.
Fill Below Ask – Fill for the prices below the current bid price.
Bid Price – Fill for the cell that contains the current bid price.
Ask Price – Fill for the cell that contains the current ask price.
Last Price – Fill for the cell that contains the last traded price. If “Show Last Size” is enabled, it will be added to the price cell. For example, [email protected].
Avg Entry – Highlight for the price cell that contains the avg entry price for your open position. There are two color options. The first is for a long position and the second is for a short position. If “Show Entry Quantity” is enabled, it will be added to the price cell. For example, [email protected]
Open – Fill for the opening price for the day.
High – Fill for the highest traded price for the day.
Low – Fill for the lowest traded price for the day.
Previous Close – Fill for the closing price from the previous day.
The example below shows some shading options for the price column:
Volume
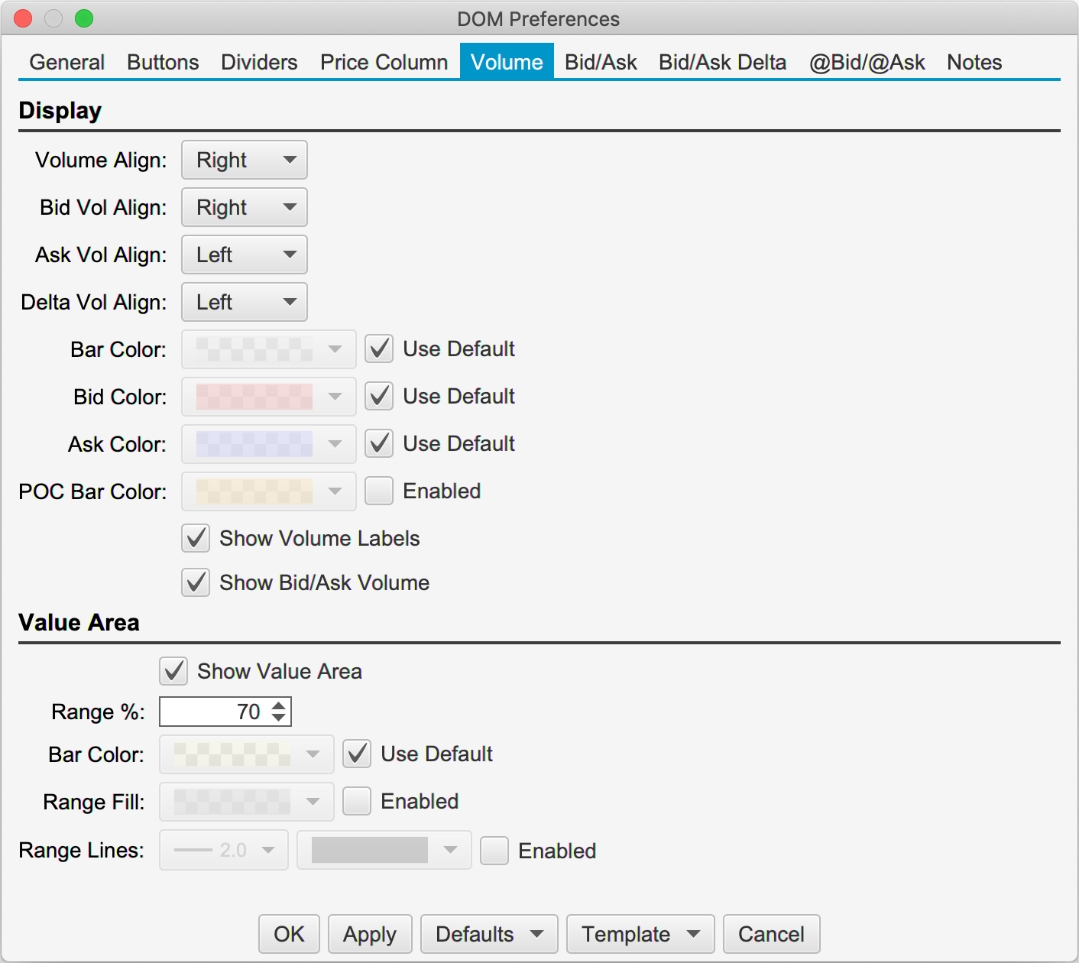
The volume-based columns (Volume, Bid Vol, Ask Vol and Delta Vol) may be customized from the Volume tab:
Display Section:
Volume Align – Cell alignment for the Volume column.
Bid Vol Align – Cell alignment for the Bid Vol column.
Ask Vol Align – Cell alignment for the Ask Vol column.
Delta Vol Align – Cell alignment for the Delta Vol column.
Bar Color – Bar color for the Volume column. This is not used if Show Bid/Ask Volume is checked
Bid Color – Bar color for the Bid Vol column. If Show Bid/Ask Volume is checked, this will be the fill for the bid volume portion in the Volume column.
Ask Color – Bar color for the Ask Vol column. If Show Bid/Ask Volume is checked, this will be the fill for the ask volume portion in the Volume column.
POC Bar Color – Color for the Point of Control cell (highest volume) in the DOM Table.
Show Volume Labels – Toggles the display of the text labels in the volume columns
Show Bid/Ask Volume – Toggles the display of bid/ask volume for the Volume column. If this is selected each bar in the Volume column will be divided into bid and ask volume.
Value Area Section:
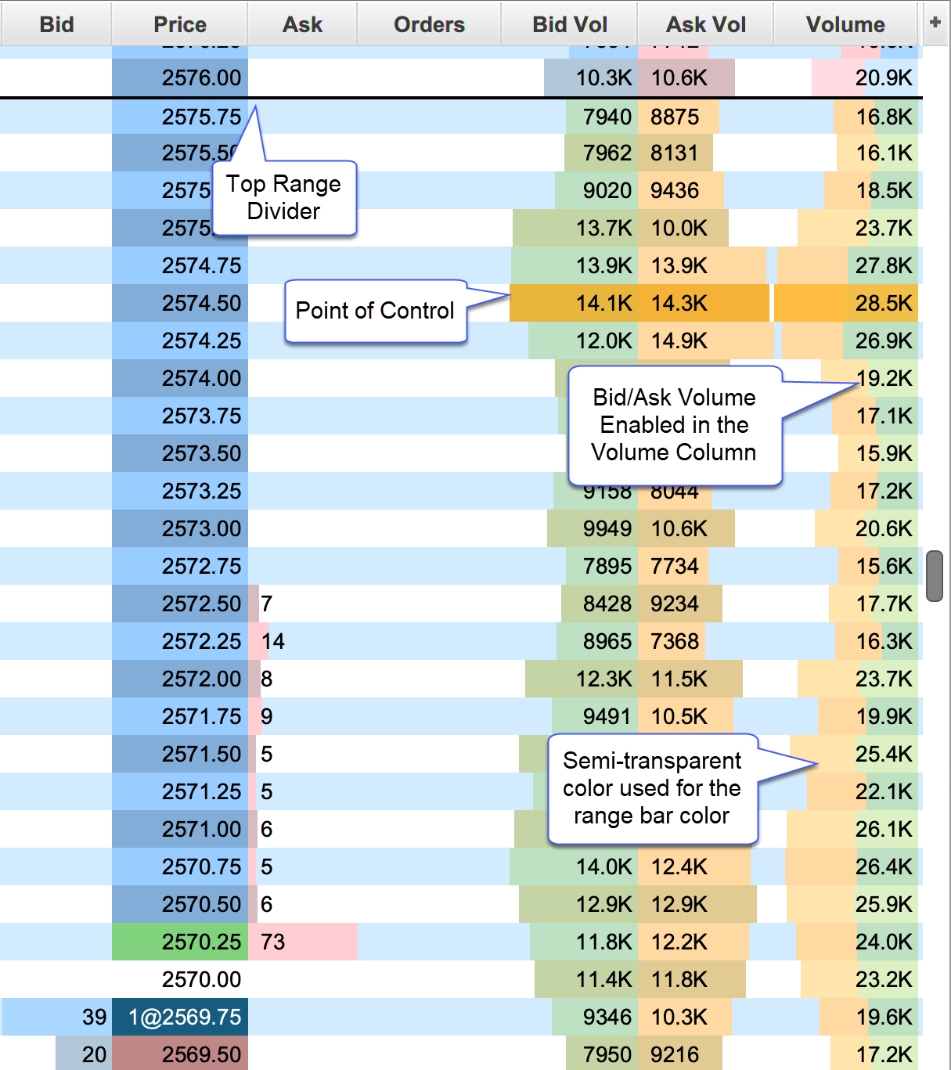
The value area identifies the rows surrounding the Point of Control (POC) (row with the highest volume) that encompass X% (typically 70%) of the total trading volume (for the day).
Show Value Area – Toggles the display of the value area.
Range % - Percentage of the volume to include in the value area.
Bar Color – Shade color for the bars that are part of the value area. Typically, this is a semi-transparent color if you want to highlight bid/ask volume at the same time.
Range Fill – Background fill for the cells that are part of the value area.
Range Lines – Displays dividers at the top and bottom of the value area.
The example below shows the Bid Vol/Ask Vol and Volume columns in the DOM table. The Value Area (Show Value Area check box) has been enabled and the “Show Bid/Ask Volume” has also been enabled for the Volume column.
Bid/Ask Sizes
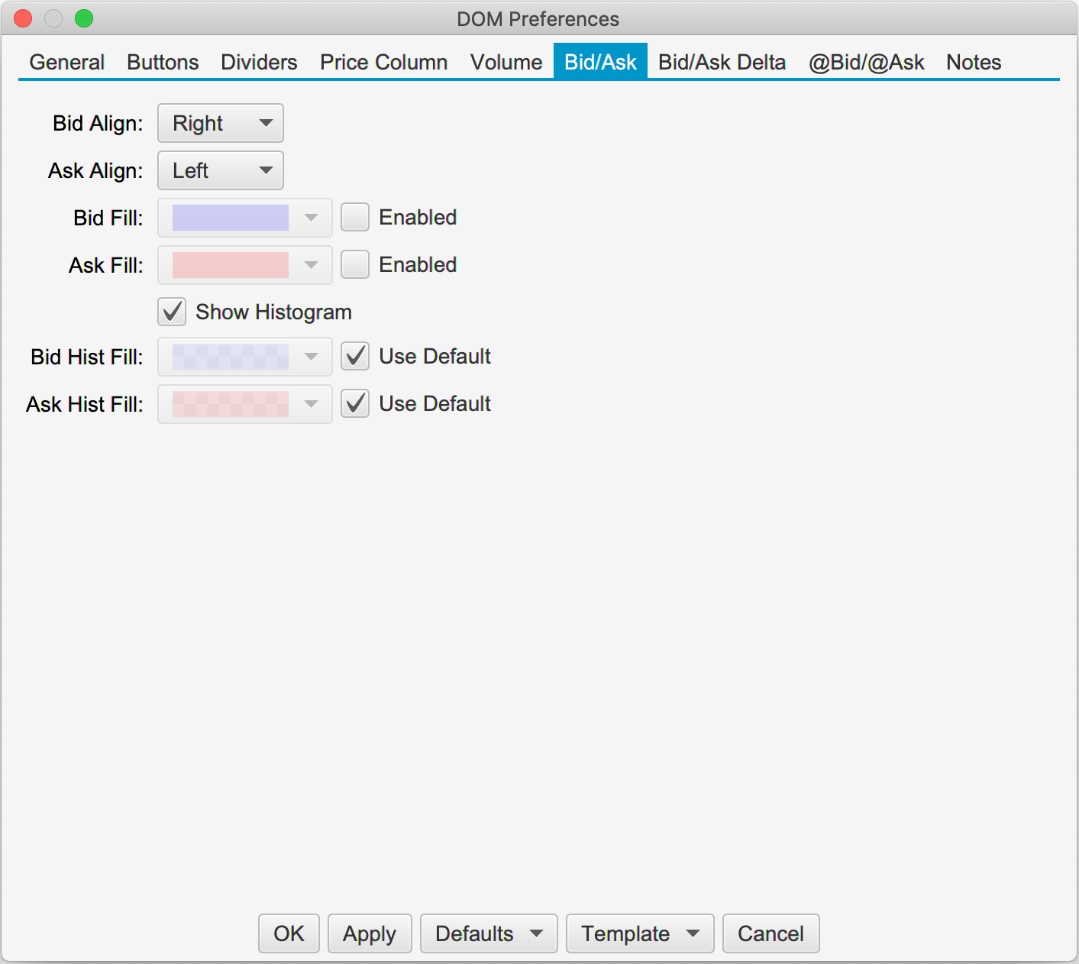
The Bid/Ask columns display total quantity of the active buy and sell orders at each price level. The number of depth rows available depends on the on the instrument, but is typically 10 prices levels for each of the bid and ask columns (total of 20 price rows). An optional histogram can be displayed to help visualize how the quantities are distributed.
Bid Align – Alignment of the Bid column.
Ask Align – Alignment of the Ask column.
Bid Fill – Fill color for the bid column (striping will be applied).
Ask Fill – Fill color for the ask column (striping will be applied).
Show Histogram – Shows the histogram for both the Bid and Ask columns using the Bid/Ask Align settings above.
Bid Hist Fill – Fill color for the Bid histogram.
Ask Hist Fill – Fill color for the Ask histogram.
Bid/Ask Delta
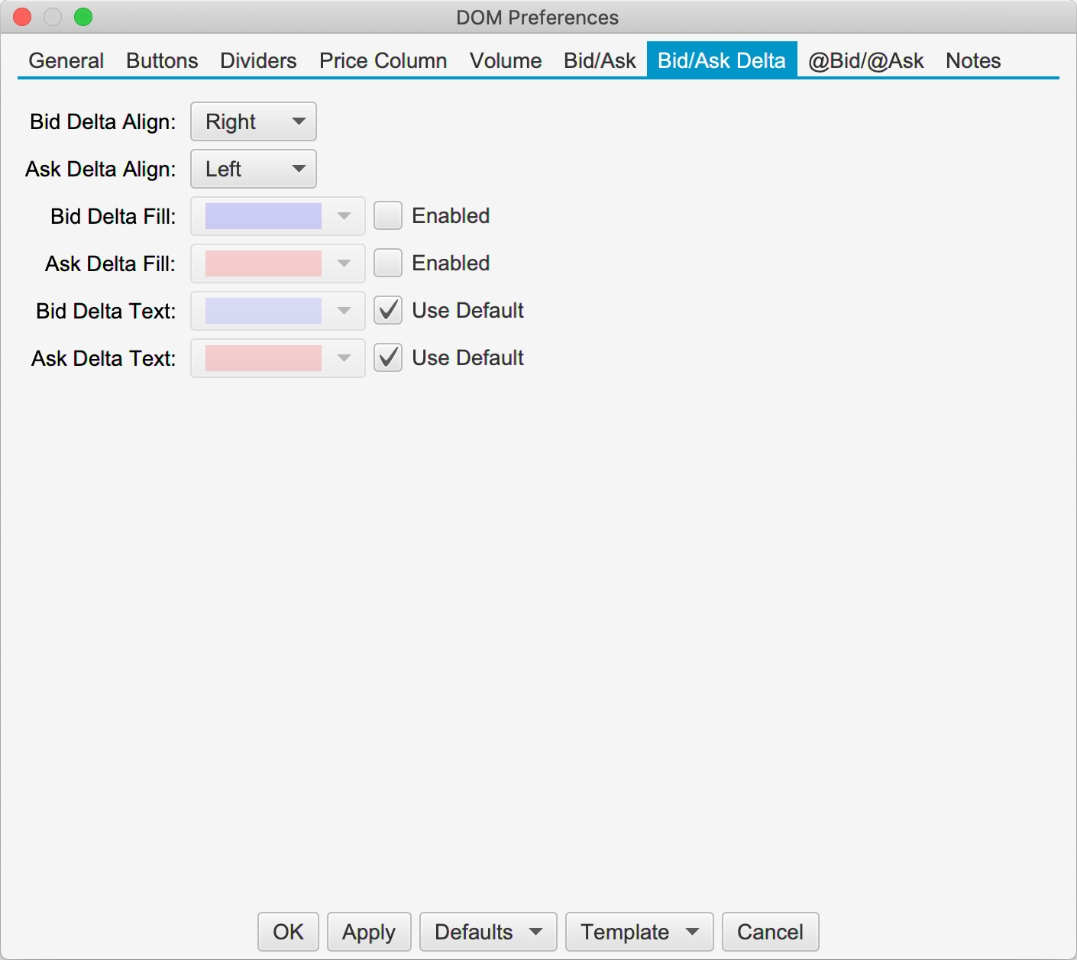
The Bid Delta and Ask Delta columns display the difference in the Bid/Ask quantities at each price level since the last price changed. These values are updated with each depth book update.
Bid Delta Align – Alignment for the Bid Delta column.
Ask Delta Align – Alignment for the Ask Delta column.
Bid Delta Fill – Background fill color for the Bid Delta column (striping will be applied).
Ask Delta Fill – Background fill color for the Ask Delta column (striping will be applied).
Bid Delta Text – Text color for the Bid Delta column.
Ask Delta Text – Text color for the Ask Delta column.
@Bid/@Ask
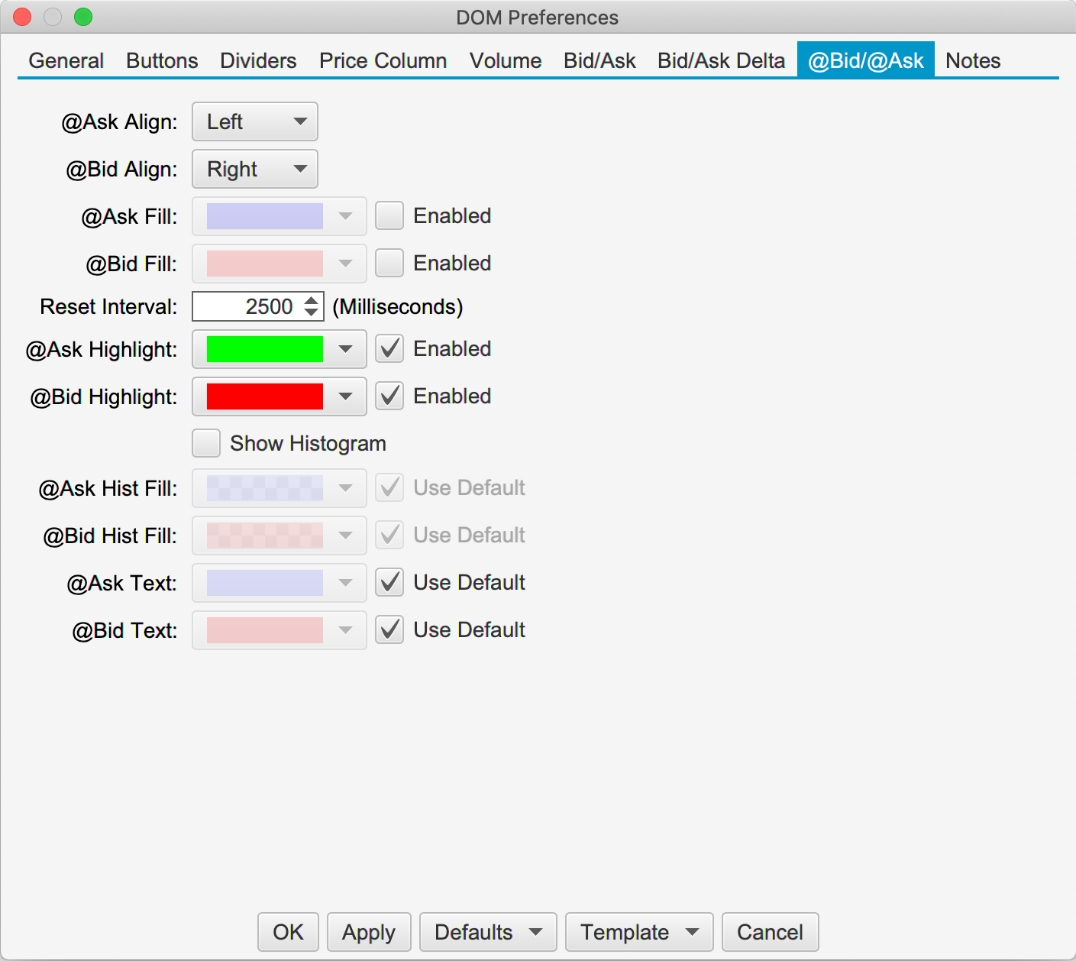
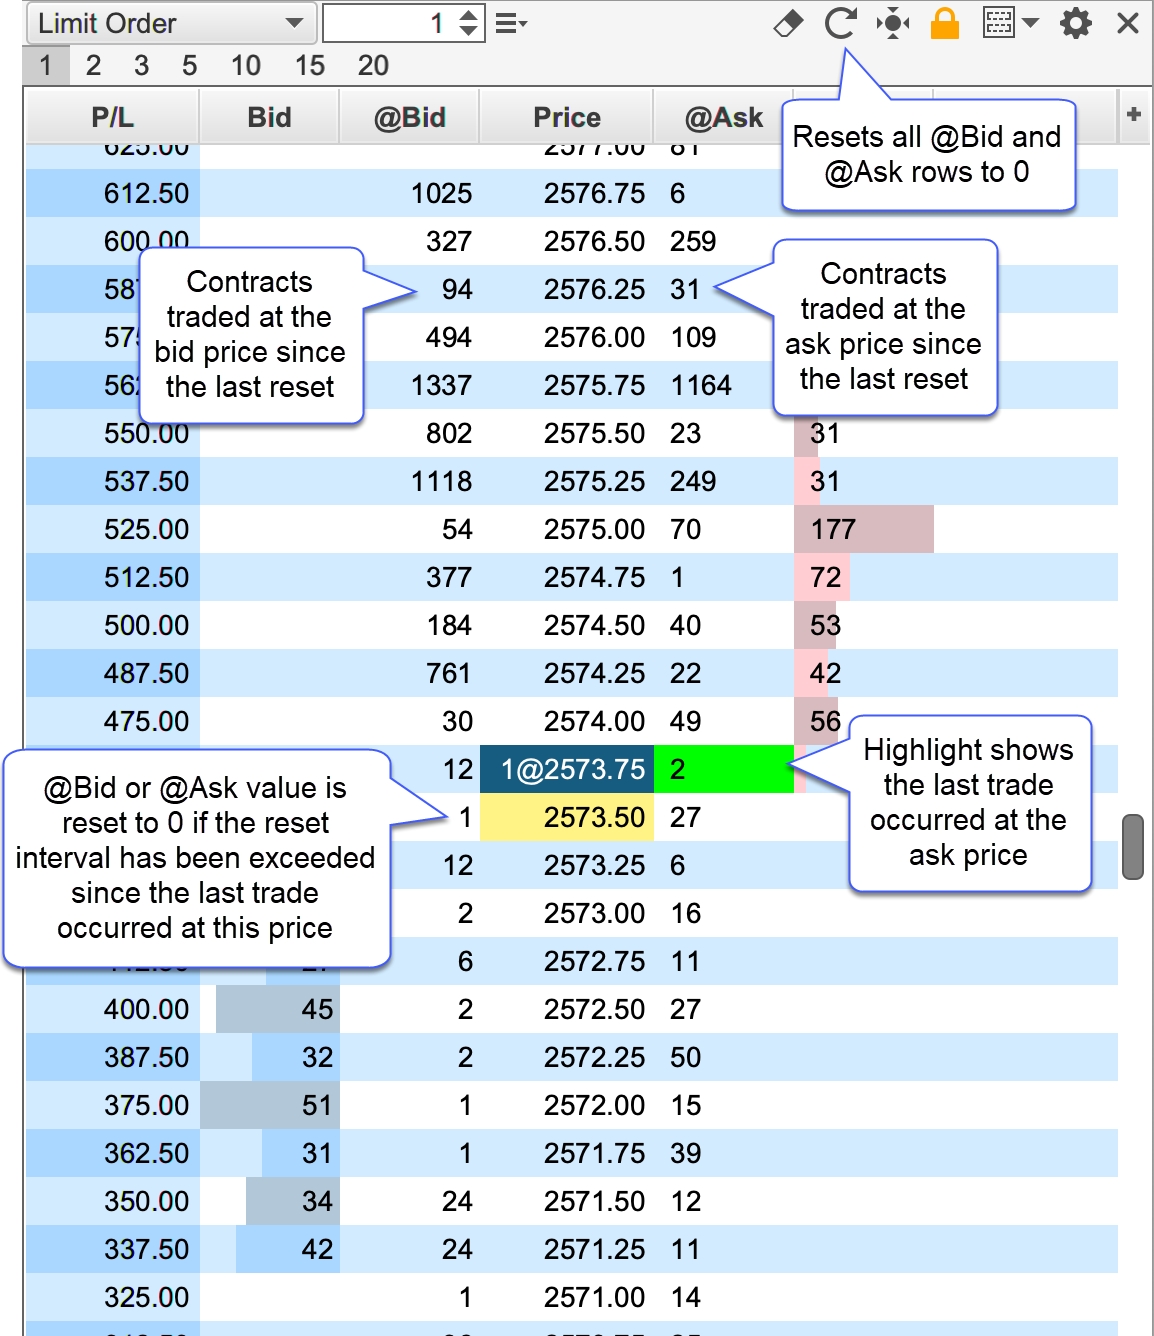
The @Bid and @Ask columns track the bid and ask volume at each price level since the last reset. These columns can be reset manually by pressing the reset button in the tool bar.
@Ask Align – Alignment of the @Ask column.
@Bid Align – Alignment of the @Bid column.
@Ask Fill – Background fill color for the @Ask column (striping will apply).
@Bid Fill – Background fill color for the @Bid column (striping will apply).
Reset Interval – The DOM panel tracks how long it’s been since a trade occurred at each price level. The @Bid (on bid trade) or @Ask (on ask trade) value is reset to 0 when the elapsed time exceeds the reset interval. For example, consider a case where the DOM panel is showing 1164 contracts traded at an ask price of 2575.50 (since the last reset). When the next trade that occurs at the ask for 2575.50 and the elapsed time exceeds the reset interval, the @Ask value will be reset to 0 before adding the new ask volume.
@Ask Highlight – Highlight color for the @Ask cell when the last trade occurs at the ask price. The highlight is cleared on the next trade.
@Bid Highlight– Highlight color for the @Bid cell when the last trade occurs at the bid price. The highlight is cleared on the next trade.
Show Histogram – Toggles the display of the histogram for the @Bid/@Ask columns.
@Ask Hist Fill – Fill color for the @Ask histogram (striping will apply).
@Bid Hist Fill – Fill color for the @Bid histogram (striping will apply).
@Ask Text – Text color for the @Ask column.
@Bid Text – Text color for the @Bid column.
The example below shows the @Bid and @Ask columns displayed in the DOM panel. Since the last trade occurred at the ask price, the @Ask cell is highlighted green (where the trade occurred).
Notes
The Notes column allows you to type a custom note for any price level. Notes are persisted when restarting MotiveWave™. For convenience all notes can be removed by pressing the eraser button in the tool bar (see below). If the DOM is attached to a chart, a guide may optionally be placed in the chart for each note. The guides and notes are synchronized between the DOM and the chart. Moving or removing a guide in the chart will affect the note in the DOM (and vice versa). The screen shot below illustrates some of the options available when adding or editing a note.
Note Styles
For convenience, notes including their formatting and guide settings may be saved as a style that can be applied later. Right click on an existing note to save or manage existing styles. An existing style can be applied to a note from the Apply Style menu.
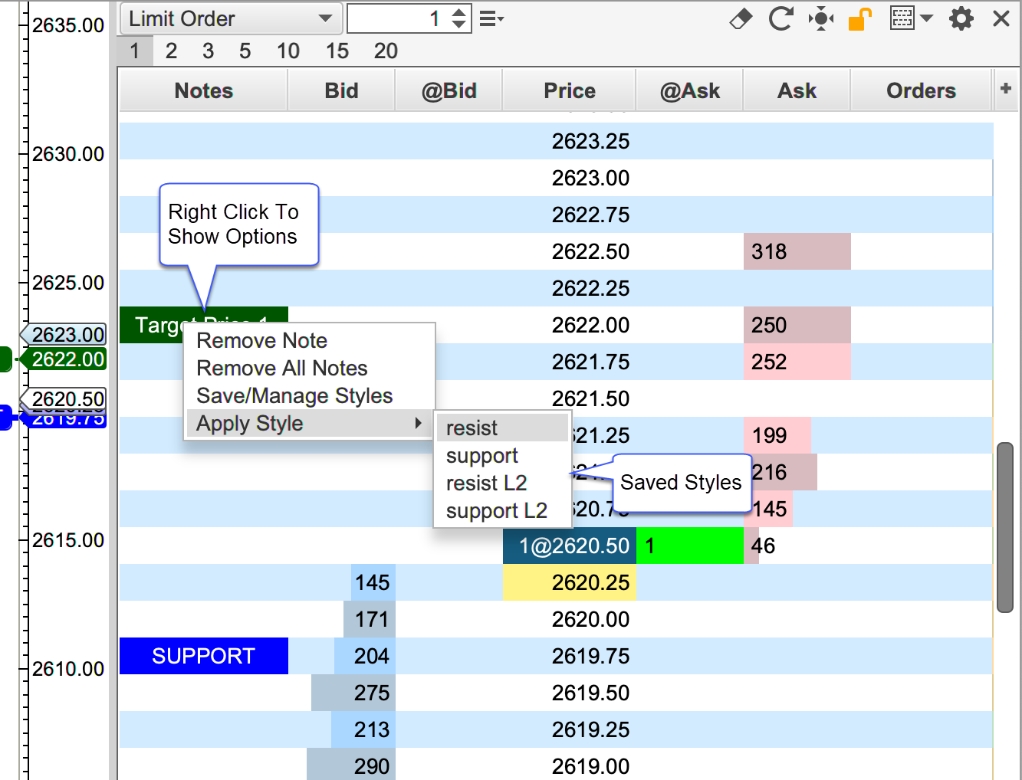
The dialog below will appear if you choose the Save/Manage Styles option. From this dialog, you can save a style and or manage existing styles. Use the up/down buttons to change the display order in the Apply Styles menu.
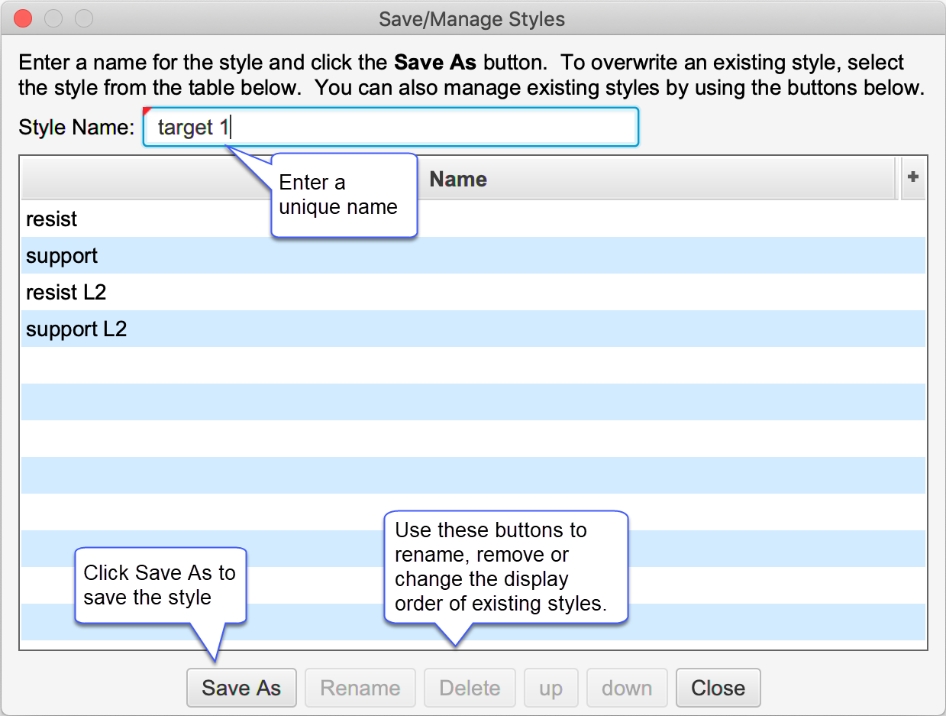
Note Preferences and Defaults
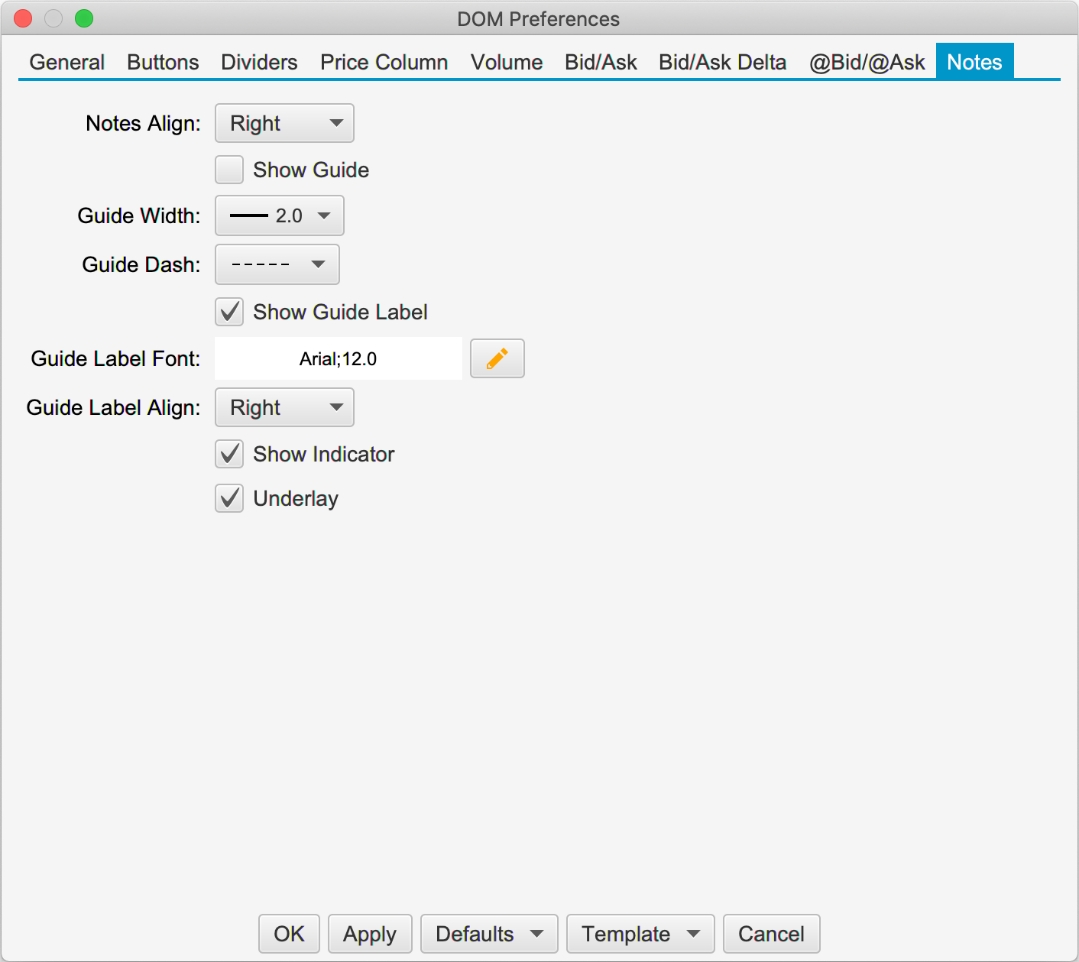
Note settings can be configured in the DOM Preferences dialog under the Notes tab:
Notes Align – Cell alignment for the Notes column.
Show Guide – This is the default setting for the showing the guide in the chart. This only applies to a DOM that is attached to a chart.
Guide Width – Default width for the guide line.
Guide Dash – Default dash pattern for the guide line.
Show Guide Label – Default setting for showing the label in the guide. The label will contain the same text in the Notes column.
Guide Label Font – Font for the guide labels.
Guide Label Align – Alignment for the guide labels.
Show Indicator – Default setting for showing the guide indicator in the price axis.
Underlay – Optionally draws the guides behind the price bars. This will also draw the guide indicators behind the other indicators on the chart.
Templates
Templates allow you to save a specific configuration for later use. A DOM template includes the following:
Width – Width of the DOM panel.
Table Columns – Visible table columns and widths.
Configuration Settings – All settings in the DOM Preferences dialog.
Templates can be saved, managed and applied from the tool bar or the DOM Preferences dialog.
Saving Templates
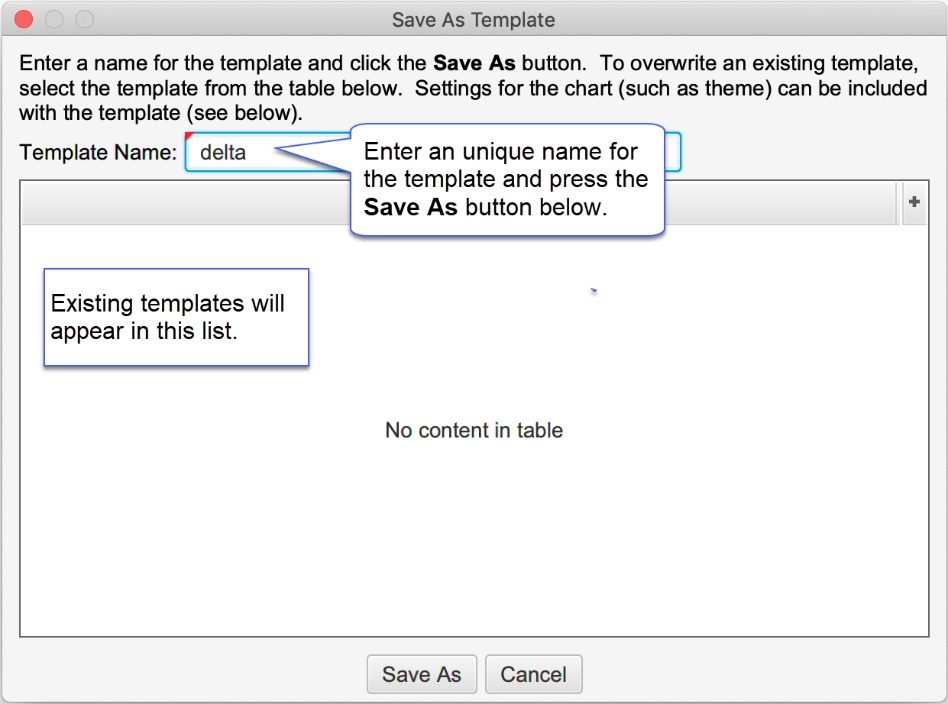
From the tool bar, click on the Templates menu button (see screen shot below) and choose the Save As Template option. Alternatively, this can be done from the DOM preferences dialog (see Template menu button at the bottom of the dialog).
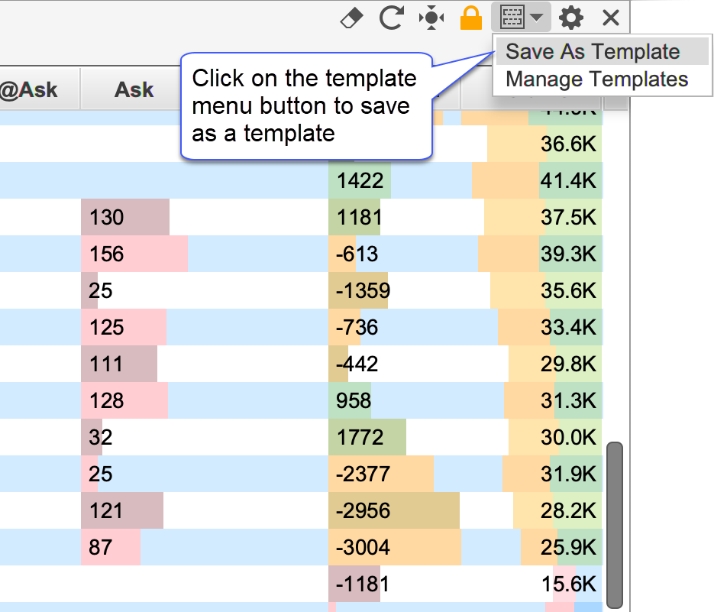
Enter a unique name for the template and press the Save As button at the bottom of the dialog. Existing templates will be displayed in the list box. You can overwrite an existing template by selecting it.
Managing Templates
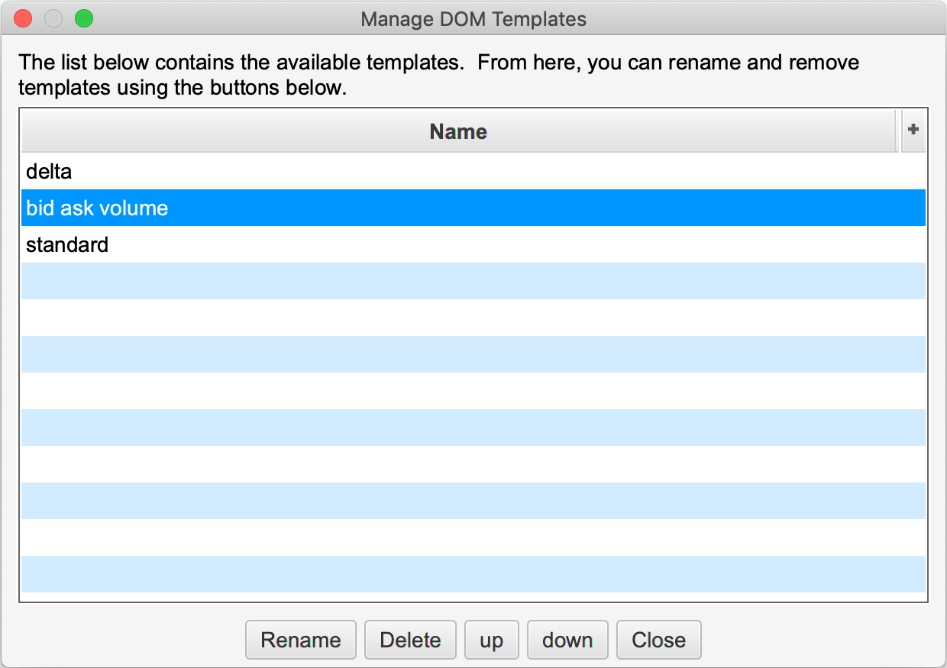
The Manage Templates option will open the dialog below. This dialog will allow to you to rename templates, delete them or change the order in which they appear in the templates drop down.
Applying Templates
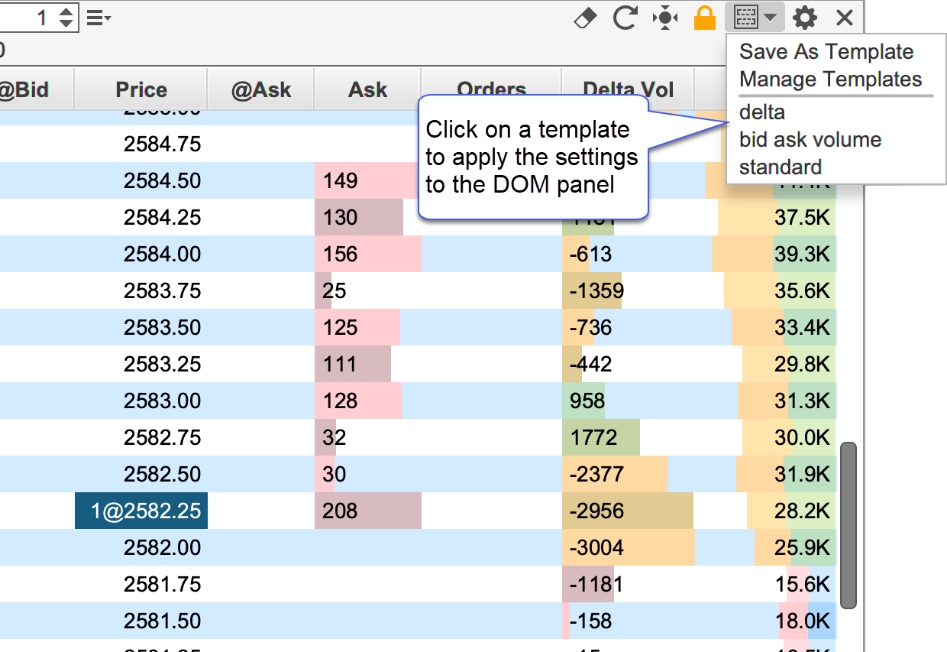
A template can be applied to the DOM panel with 2 mouse clicks. Open the templates drop down and select the name of the template you would like to apply. The settings from the template (including the width of the panel and visible columns) will be applied.
DOM Enhancements
Several new enhancements have been added to the Depth of Market (DOM) panel. Note: many of these features are currently exclusive to Rithmic accounts (due to lack of support in other APIs).
Market By Order
Market by Order displays individual order sizes in the Bid/Ask Columns (Rithmic Only). For more details on Market By Order, see: https://www.cmegroup.com/education/market-by-order-mbo.html Note: this information is also available in the SDK.
The screen shot below shows an example of the Market by Order feature on the S&P E-
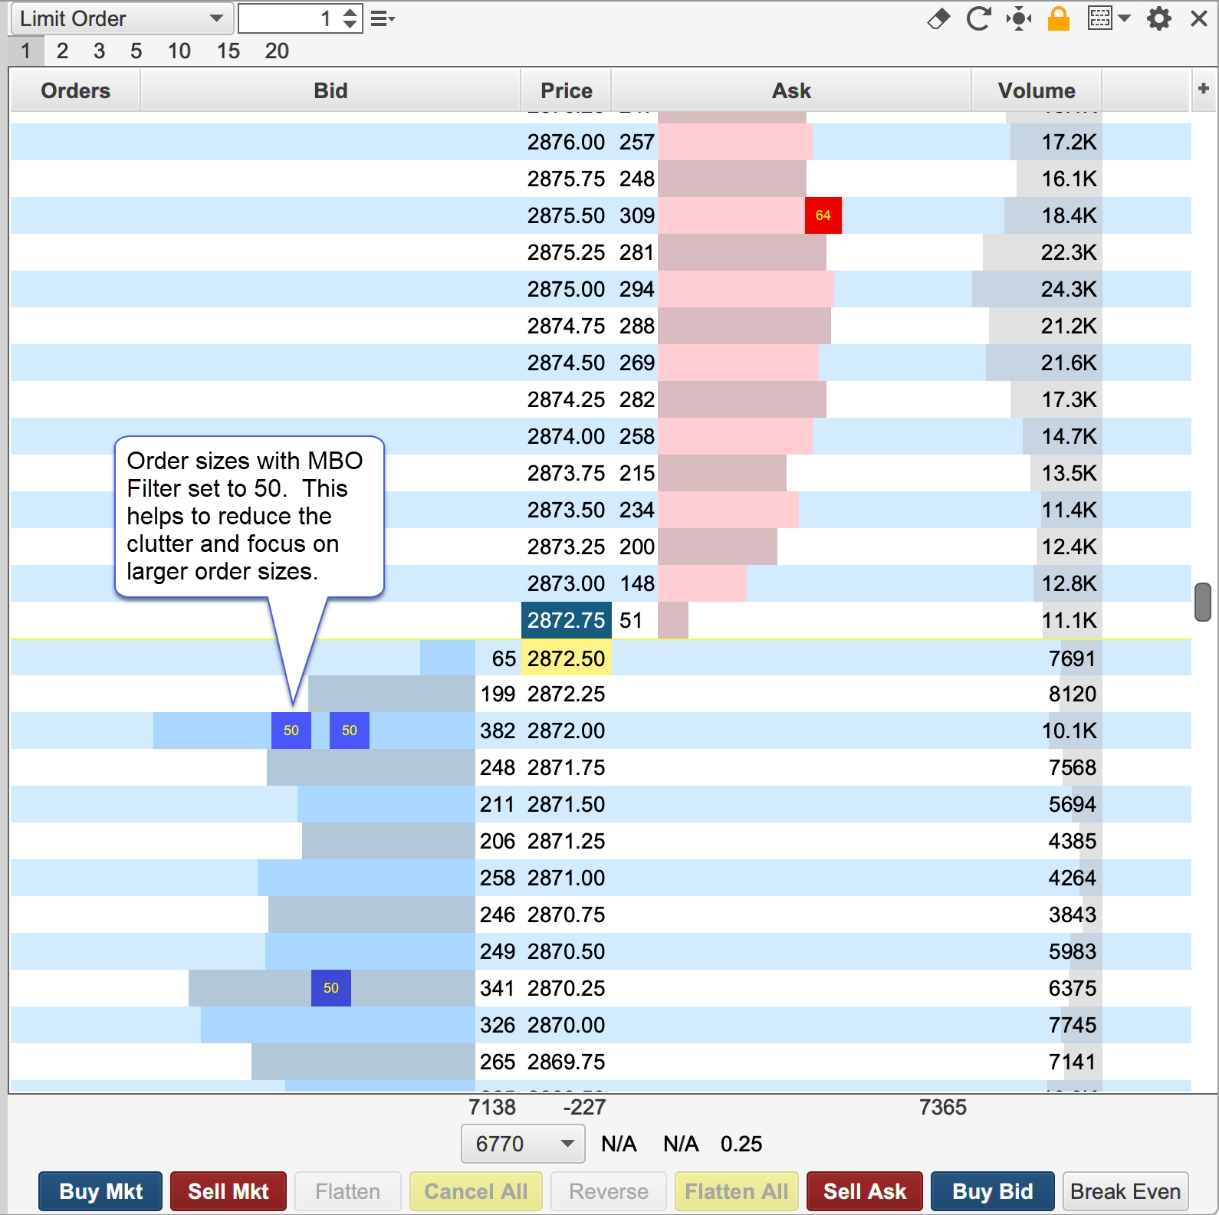
mini contract. Limit order sizes are displayed in priority order. Smaller order sizes are auto hidden for simplicity. If you would like to see more detail, increase the width of the Bid or Ask columns by clicking/dragging the edge of the column in the table header.
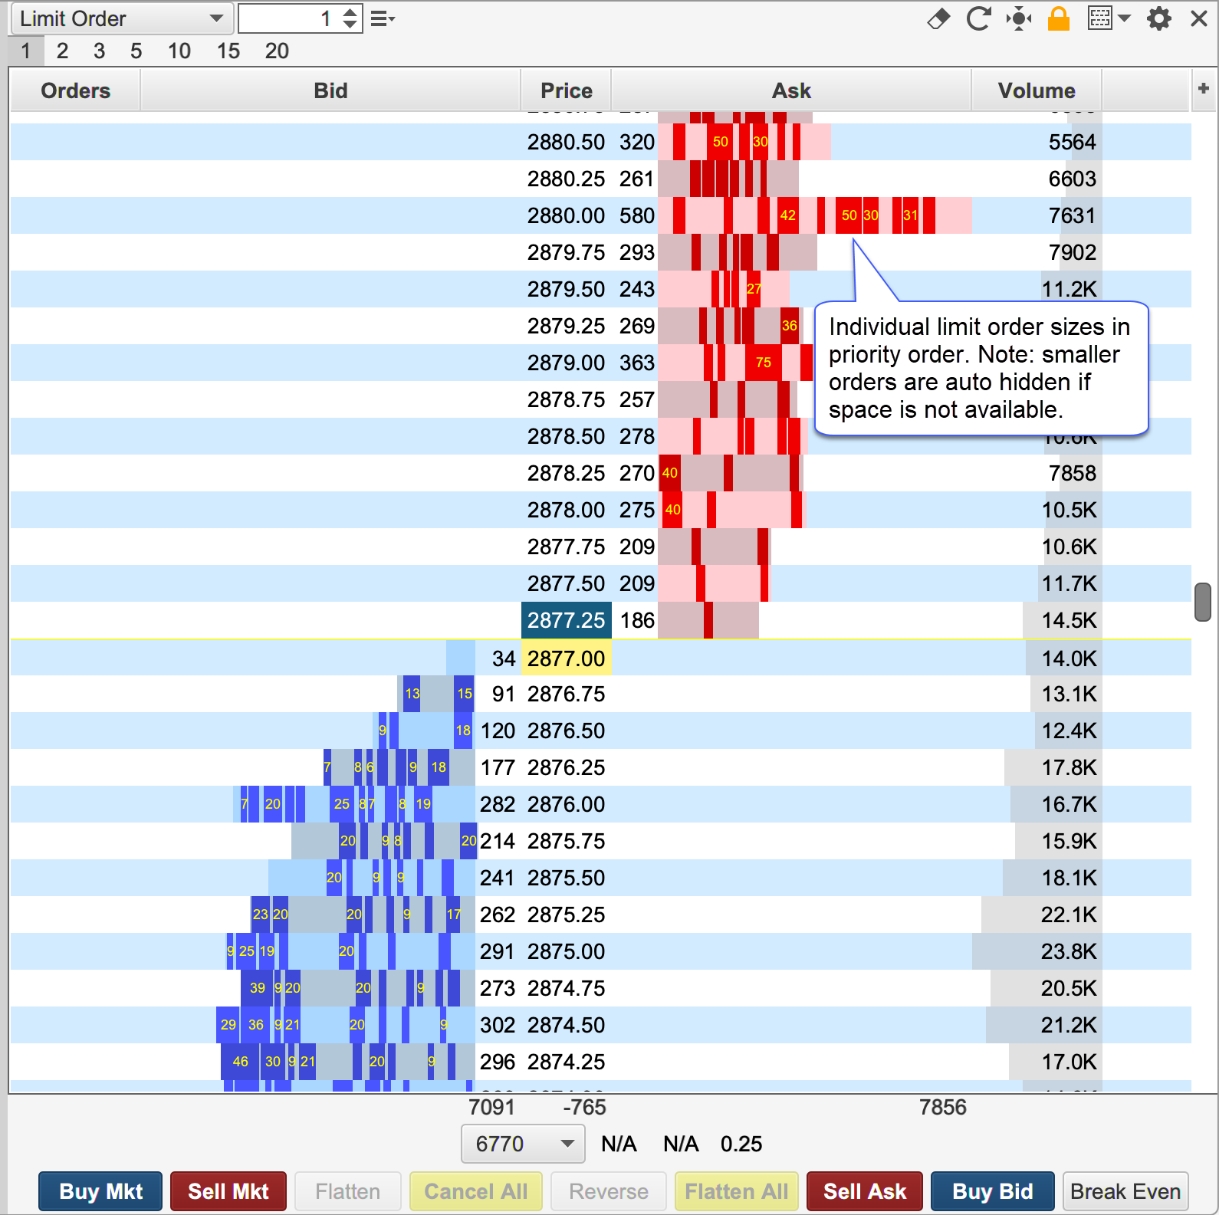
Configuration settings for this feature can be found in the Bid/Ask tab of the DOM Preferences Dialog (click on the Gear icon in the tool bar).
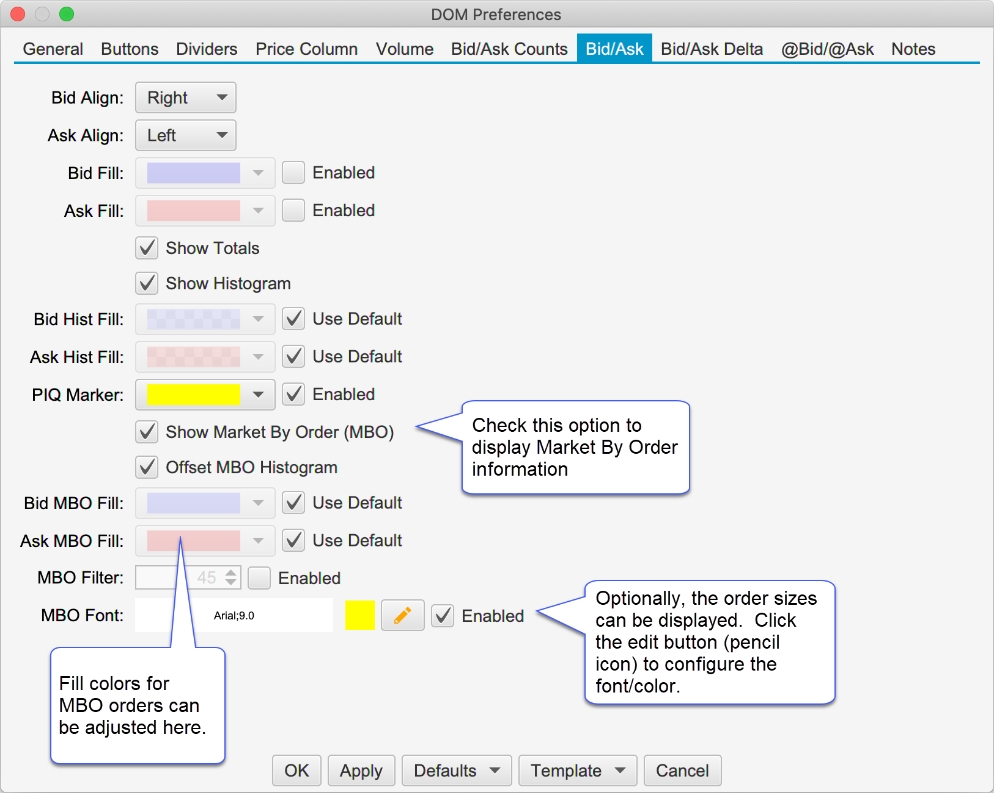
The following options are available for configuring Market by Order:
Show Market by Order (MBO) – Toggles the display of the order sizes in the Bid and Ask columns
Offset MBO Histogram – Offsets the histogram to the left/right of the Bid or ask size to avoid obscuring order sizes at the front of the priority queue.
Bid MBO Fill – Fill color for visible order sizes in the Bid column
Ask MBO Fill – Fill color for the visible order sizes in the Ask Column
MBO Filter – Optionally, filters orders that are smaller than the given size
MBO Font – Optionally display the order size (if space available). Click on the edit button to configure the font size/color.
The screen shot below shows the MBO filter option with the size set to 50:
More Depth Levels
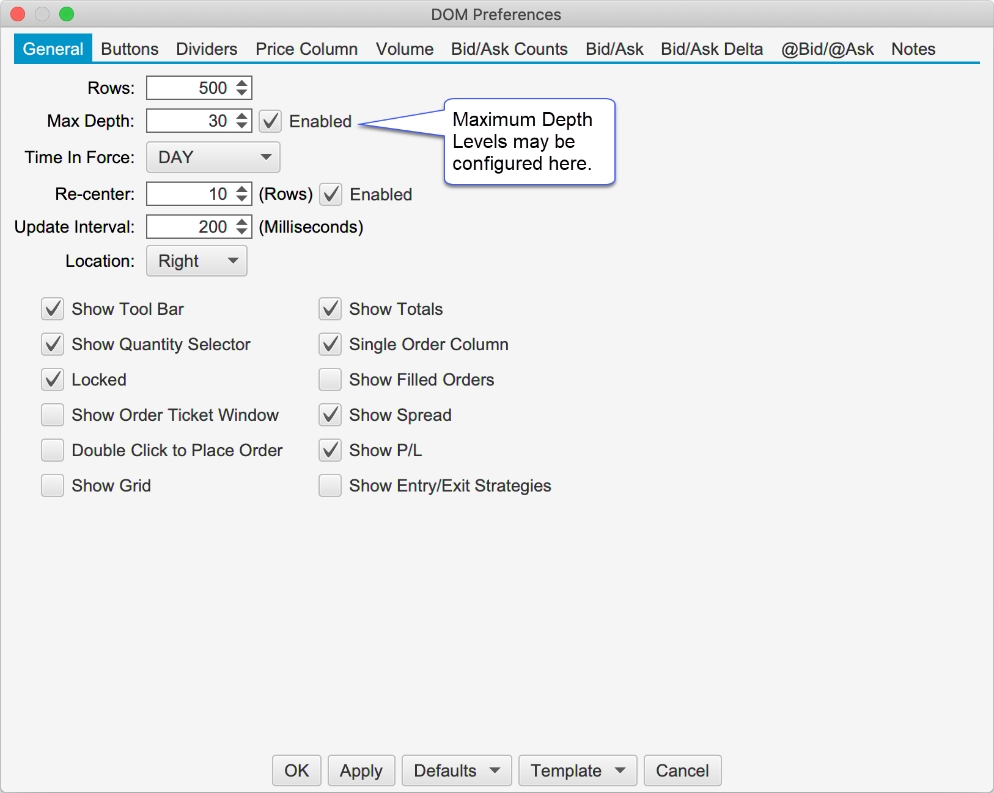
Additional Bid/Ask levels (beyond the standard 10) may be displayed (Rithmic only). See DOM Preferences Dialog, General tab:
Position in Queue (Limit Orders)
Actual position in queue is available for Live Rithmic accounts only. This makes use of the MBO feature to determine where the limit order is in the queue and calculates the number of contracts ahead of it by adding up the order sizes.
For all other accounts, the estimated position in queue (EPIQ) is displayed (prefixed by ‘~’ in the DOM order column). EPIQ is calculated by monitoring the change in the bid/ask depth levels. When an order is first created it is assumed to be at the back of the queue (ie EPIQ = depth size). When the depth size gets smaller a percentage of that size is removed from the PIQ relative to its current position (i.e. EPIQ = EPIQ - (EPIQ /previous size)*(previous size – new size)).
The following screen shot shows the position in queue in the Order column of the DOM:

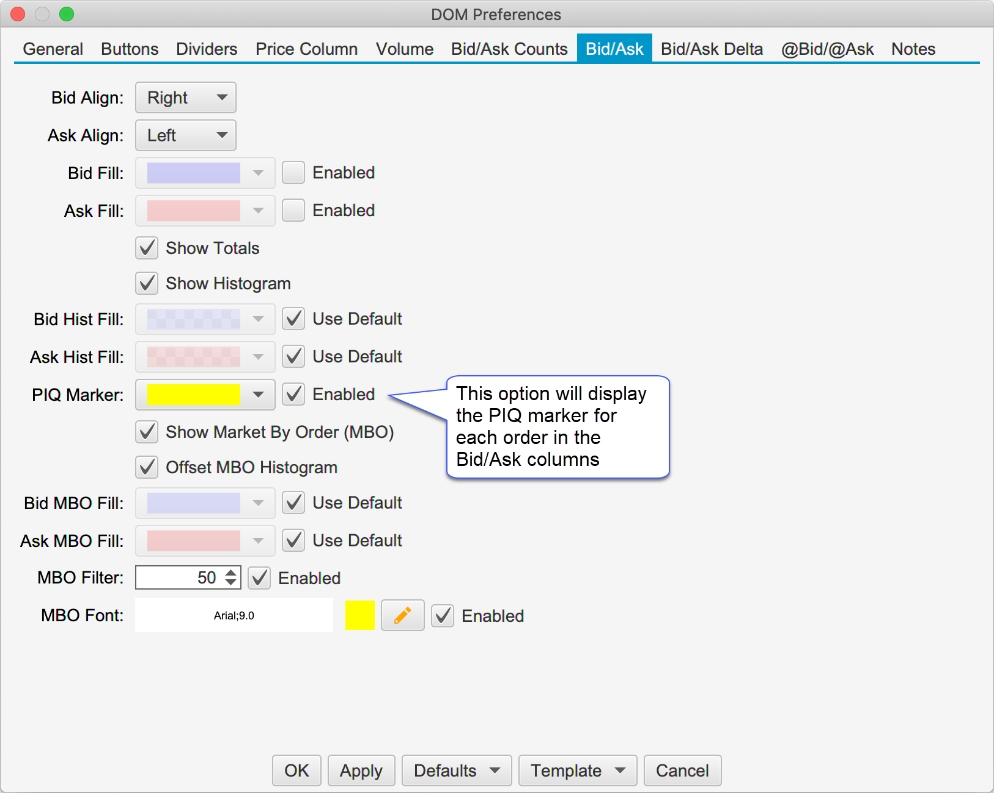
The PIQ marker can be configured in the Bid/Ask tab of the DOM Preferences Dialog:
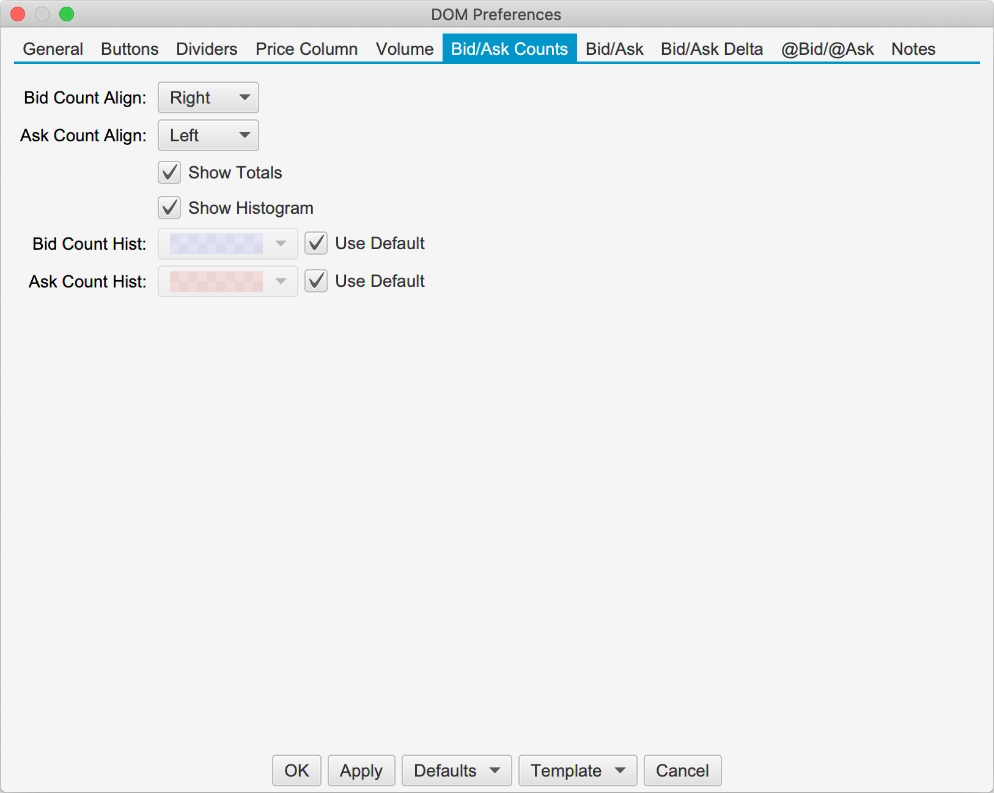
Bid/Ask Counts
The Bid/Ask Counts columns display the number of active orders at each price level (as opposed the depth quantity). Note: these columns are available on Rithmic accounts only.
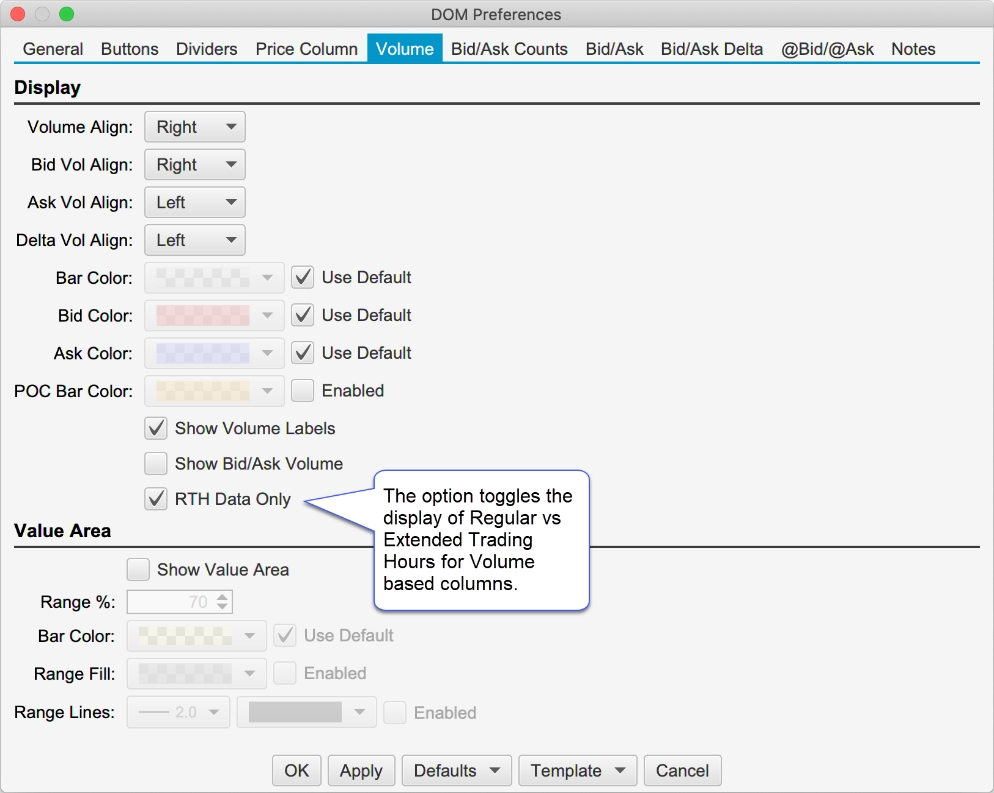
Regular vs Extended Session for Volume Profile
Optionally the volume profile columns (Volume, Bid/Ask Volume, Delta) may be set to computed from the Regular or Extended trading session. The screen shot below shows where this setting can be found:
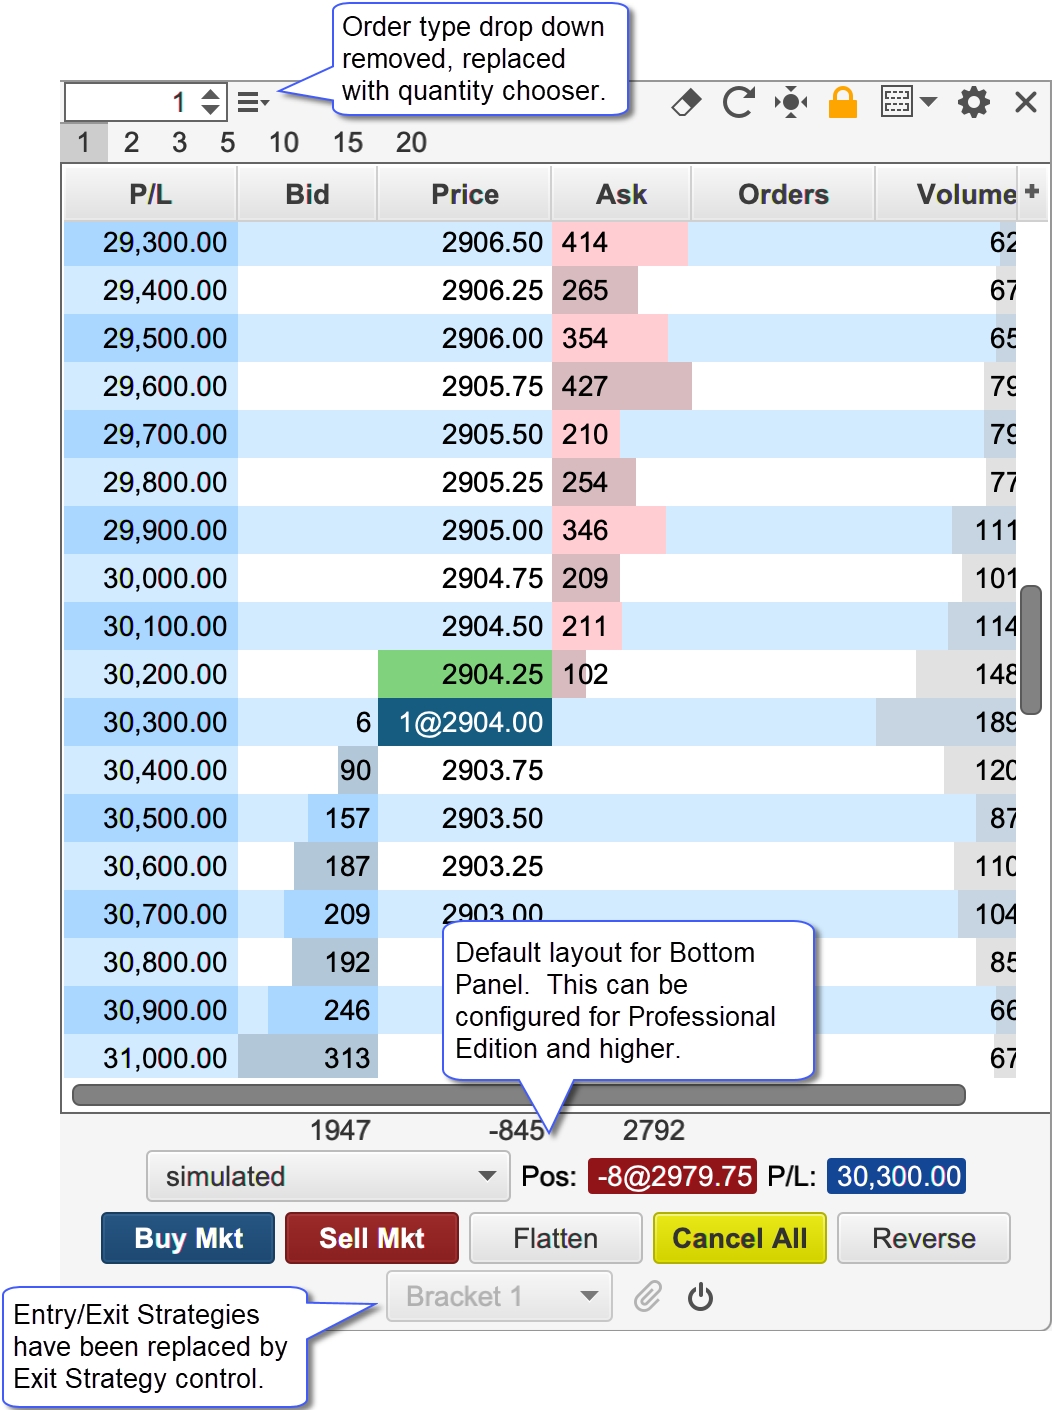
Default DOM Layout
The default layout for the DOM has changed in (see screen shot below). The order type chooser has been removed (this functionality is covered by the Exit Strategy feature). The Entry/Exit strategy option has been replaced by the Exit Strategy control (see bottom of DOM).
Bottom Panel
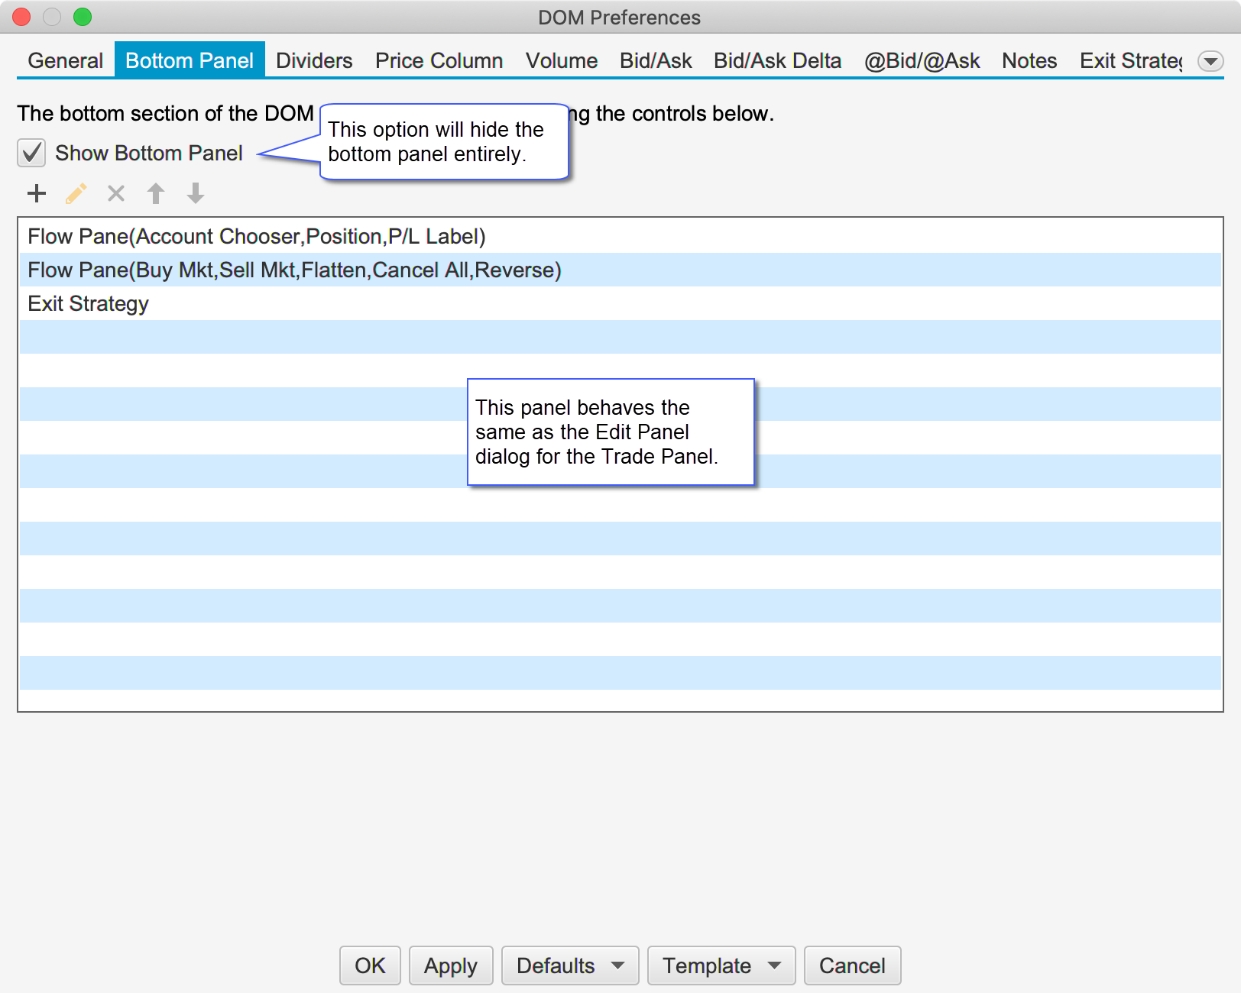
Note: This feature is only available in the Professional Edition and higher. Lower editions will be limited to the default layout.
Similar to the Trade Panel, but bottom section of the DOM panel can be customized. This can be done from the Bottom Panel tab in the DOM Preferences dialog (click on gear icon at the top right of the DOM panel).
This panel behaves the same as the Edit Panel dialog in the Trade Panel see Customizing the Layout section.
If you have an edition below the Professional Edition, you can still customize the buttons that are displayed at the bottom of the panel (see below):
DOM Location
This option allows you to display the DOM panel on the left or right side of the chart. See DOM Panel -> Preferences -> General
PL (Price) Column
This is a new column that will display your profit and loss in the instrument price movements eg. 0.25, 0.50, 0.75 etc.
Center DOM Shortcut
Added new keyboard shortcut option “Center on Last Price” (default unassigned). This will re-center the active DOM on the last price.
Center All DOMs
This new option will center all Depth of Market panels when the re-center button is pressed (See DOM Preferences, General Panel). For convenience a Keyboard Shortcut can also be assigned (see General Preferences Dialog, “General” -> “Keyboard” tab).
Rithmic Enhancements
Significant enhancements have been added to our Rithmic connector (some of which have been described in the DOM Enhancements section: MBO, Bid/Ask Counts, Depth Levels and Position in Queue).
Native Order Types
The following native implementations have been added for the following types of orders:
OCO – One Cancels Other
Bracket (Attached) Orders – Limit/Stop orders with attached profile/stop orders
Trailing Stop – Trailing stop orders
LIT/MIT – Limit if Touched/Market if Touched
Iceberg – Limit orders with the actual size hidden
@Bid/@Ask Values for Live Quotes
Live quotes use the “Aggressor Side” flag to determine a live quote was at the bid or ask price instead of relying on the Best Bid/Ask values (which are not guaranteed to be in sync). This will ensure that live quotes are correctly interpreted for Bid vs Ask volume and will match historical tick data.
Latest Rithmic API
We have upgraded to the latest Rithmic API (10.6.0.0).
Time and Sales Panel
The following enhancements have been added to the Time and Sales panel:
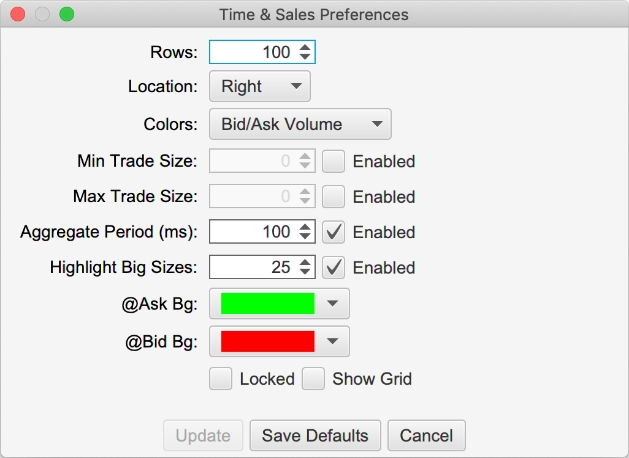
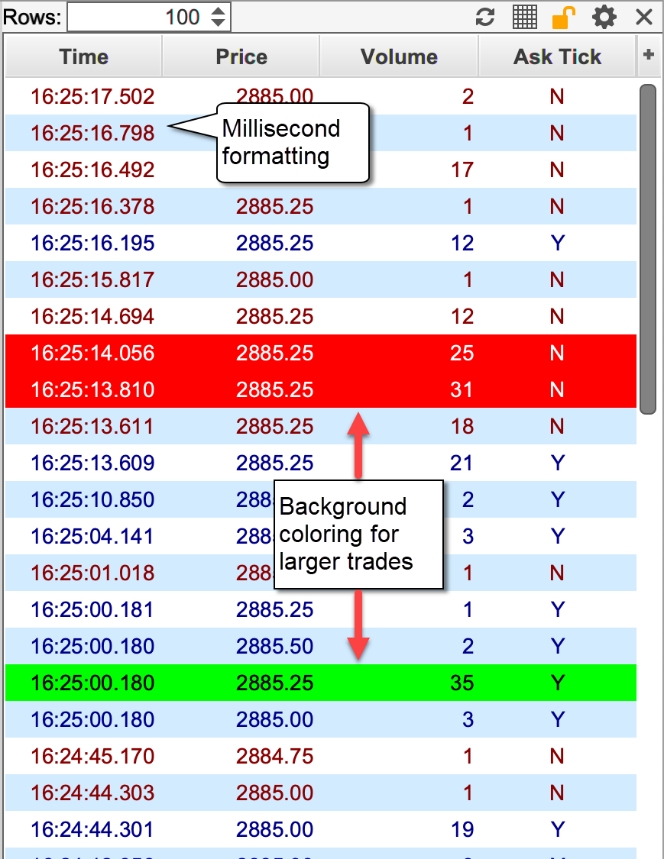
Millisecond Formatting – The time stamp for the tick now shows the milliseconds (ie HH:MM:SS.MMM).
Aggregate Period (ms) – The period for aggregate can be customized (default 100 milliseconds). Trades are aggregated if they occur within the aggregation window, have the same price and them same Ask Tick value. These trades must occur in sequence (no non-matching trades between them).
Highlight Big Sizes – Background highlighting can be applied to larger trade sides.
Location – This option allows you to display the Time and Sales Panel on the left or right side of the chart. See T&S Panel -> Preferences.
Text Color – The text color for the Time & Sales panel can now be configured.
The following screen shot shows the changes that have been made to Time & Sales Preferences dialog (click on the gear icon on the tool T&S toolbar).
In the screen shot below you can see the highlighting applied to rows that have sizes of 25 or higher.
Custom Watch List Column
Customized columns may be defined and added to Watch Lists and Quote Sheets. These columns will display a value that is generated by built-in or custom study. Formatting may also be applied to the column cells to make it easier to visualize trading opportunities.
Custom columns can be managed by choosing Configure -> Custom Columns from the Console menu bar.
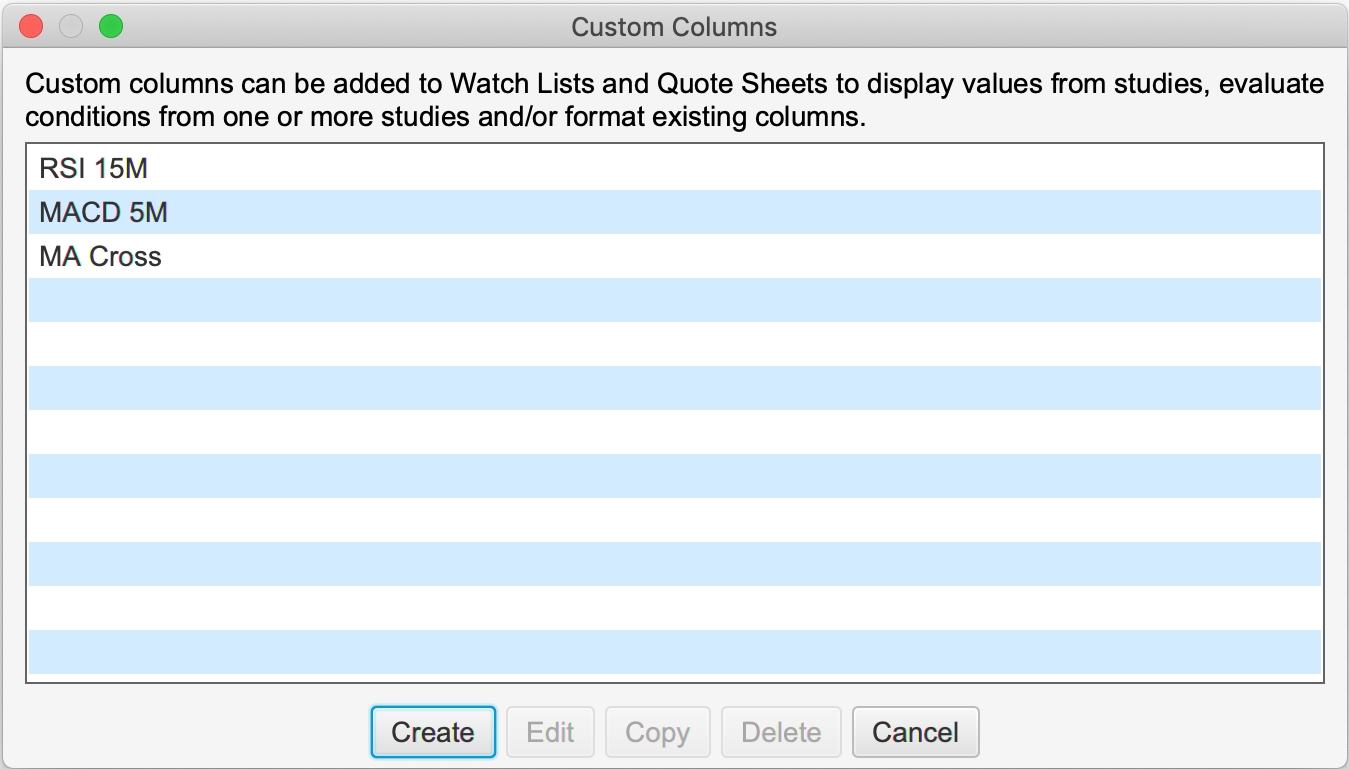
Click on the Create button to create a new custom column. This will open the Create Custom Column wizard to guide you through the steps.
In the example below, we have chosen the RSI study on a 5-minute interval and live updates (instead of on bar close).
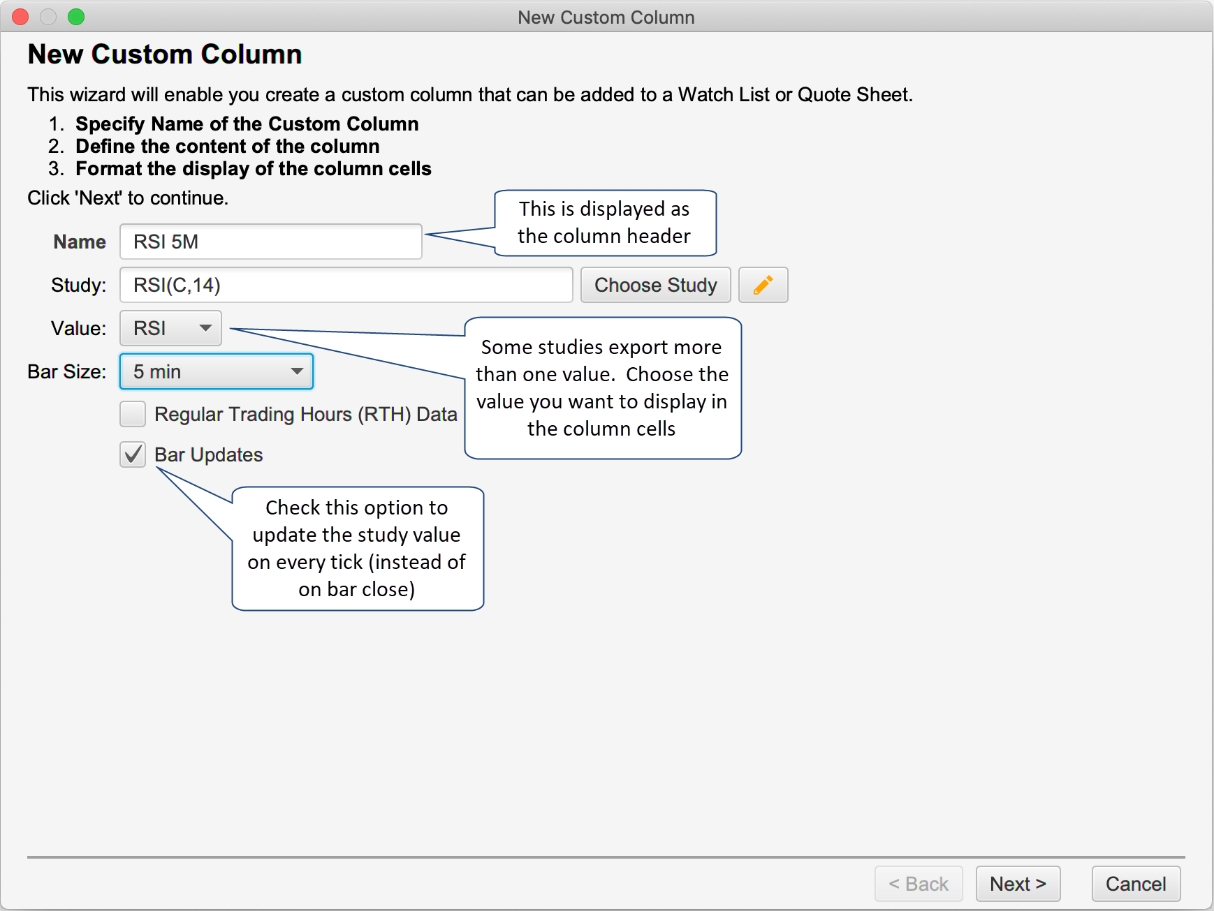
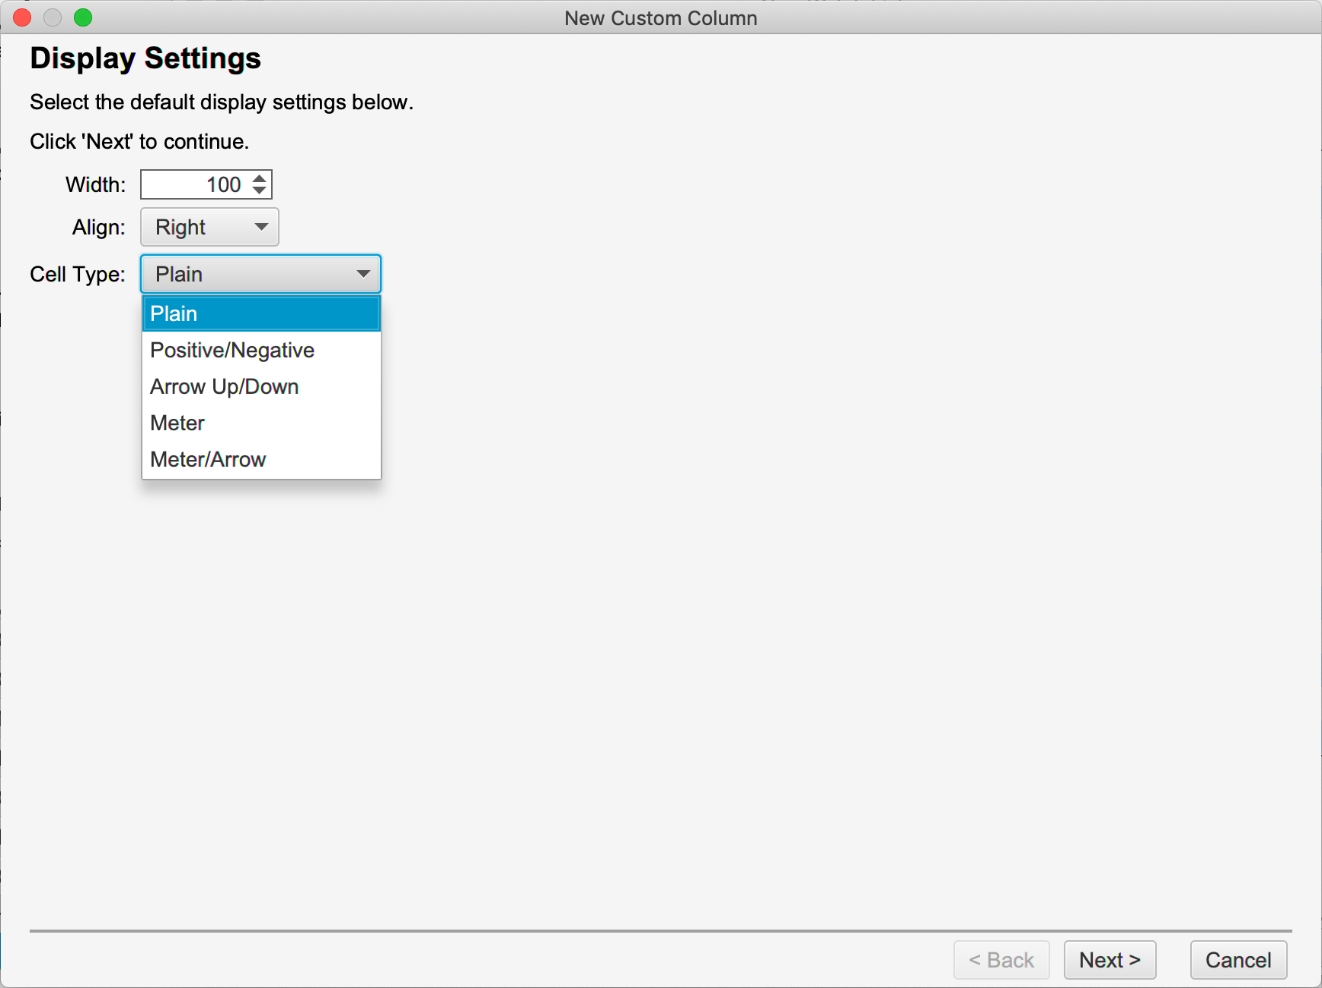
The next panel allows you to change the display of the cells in the custom column. The width attribute is the default width for the column (you can still adjust the column size in the watch list). There are several different cell types to choose from:
Plain – plain cell with no formatting.
Positive/Negative – Displays a blue/green or red background if the value positive or negative.
Arrow Up/Down – Displays an up or down arrow if the latest value is higher/lower than the previous value.
Meter – Fills the background from the left (or right depending on the alignment) with a percentage of the cell width using the current value of the column. For example with an RSI value of 90 (RSI values range from 0 – 100) it would fill 90% of the cell background with the given color.
Meter/Arrow – Combination of the Meter and Arrow types above.
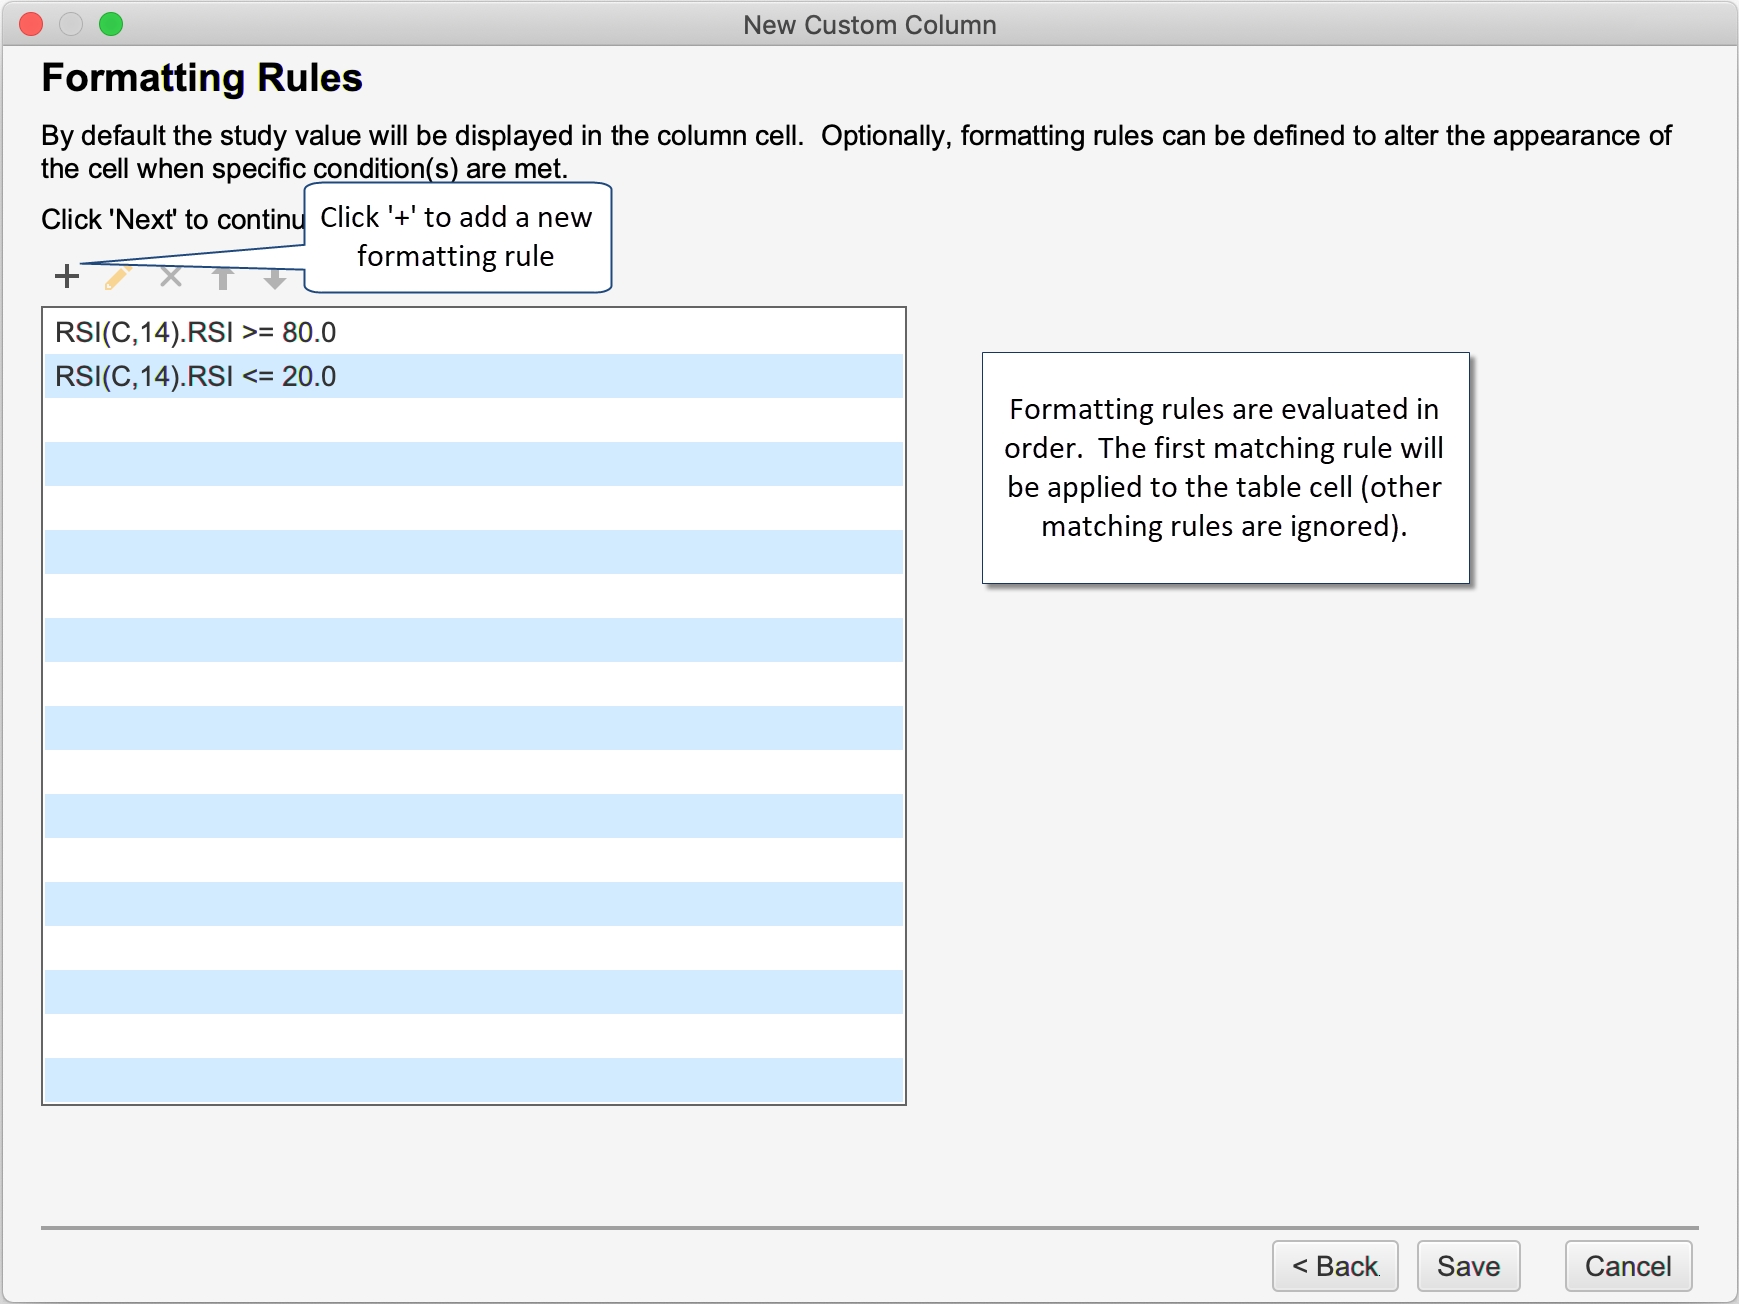
The last panel in the wizard allows you to specify custom formatting rules to change the display of the column based on one or more conditions. These rules are evaluated in order and the first matching rule will be applied to the table cell.
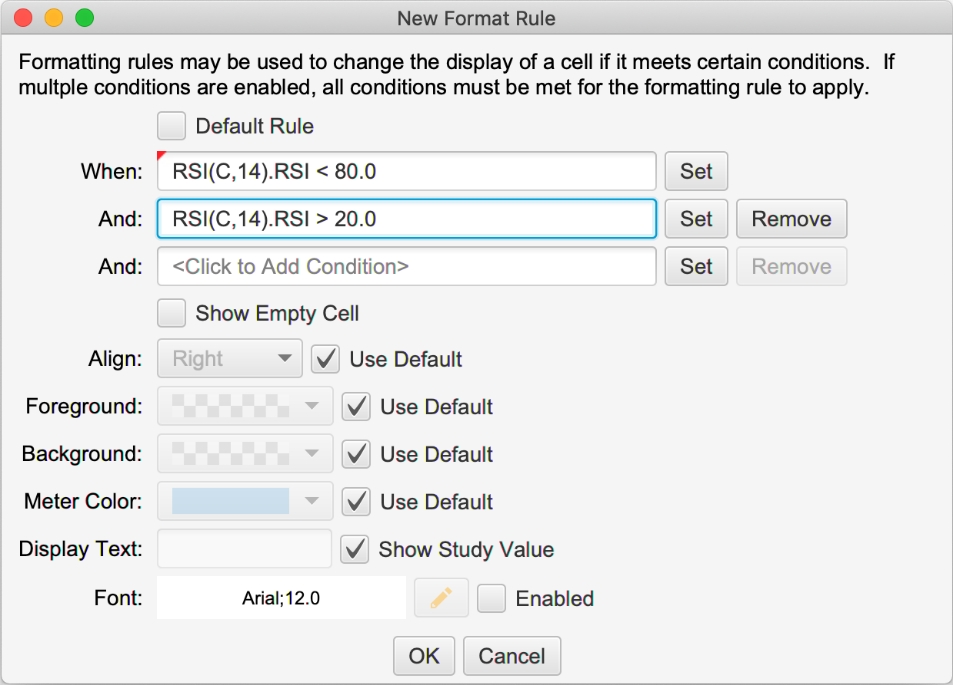
Formatting rules can have multiple conditions. The rule is applicable only if all of the conditions are met. There are several formatting options:
Align – Text alignment (Left, Middle, Right).
Foreground – Foreground color (text color).
Background – Background color for the cell.
Meter Color – Fill color for the meter (only available if cell type if meter or meter/arrow)
Display Text – Optionally the text displayed in the cell can be a static value (instead of the study value). This can be useful if the study value is not important and you want to display a buy or sell message for example.
Font – Override for the default cell font.
In the example below, we are changing the format of the cell when the RSI value is between 20 and 80.
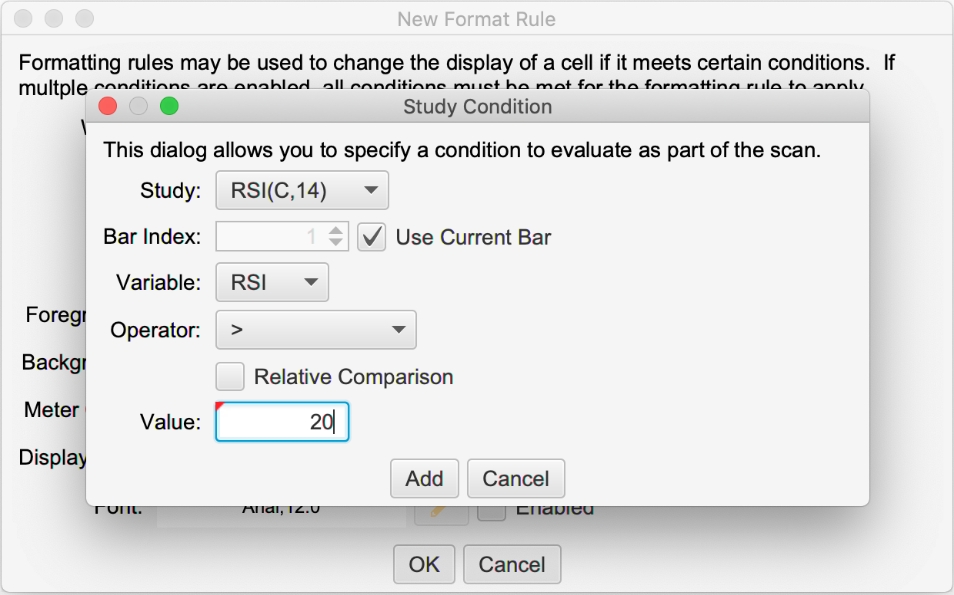
Study conditions can be a simple comparison between a study value and a static value or you can compare it with another study value (choose Relative Comparison). By default, the latest study value is used, but you can use the closing value for older bars by unselecting the Use Current Bar option.
The screen shot below shows a watch list with 4 custom columns displayed. Custom columns can be added to a watch list/quote sheet by clicking the edit button (pencil icon in the top right tool bar section). Alternatively click on the + (plus) button in the top right corner of the table and select the custom columns that you want to display. For convenience you can also right click on a column and edit its properties.

Default Filter
A default filter may be used to apply formatting for cases that don’t match the other filters. This can be particular useful for reducing clutter in the watch list by showing an empty cell for values that are not of immediate interest.
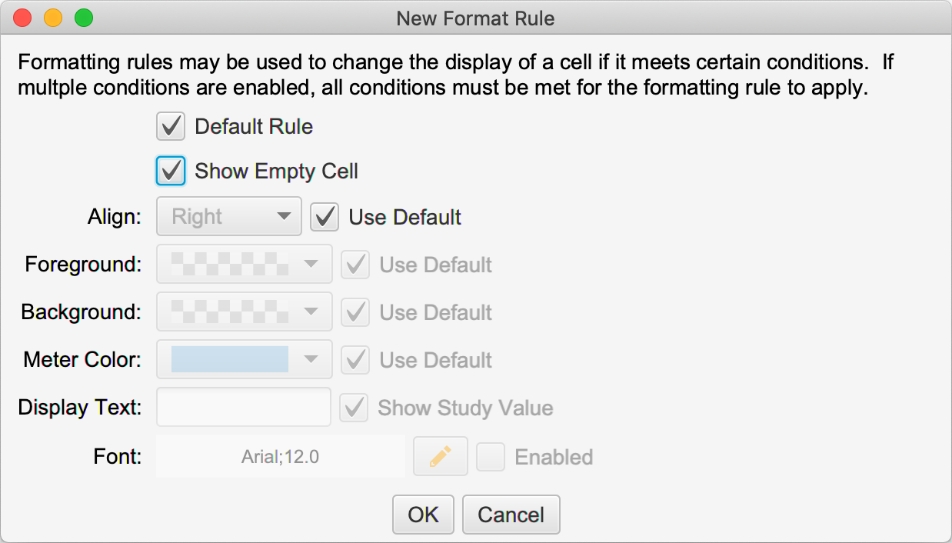
Select the Default Rule option on the Format Rule Dialog to create a default rule. Note: only one default rule can be set for a custom column. The default rule is applied only if there are no other matching rules so the order in the list does not matter.
In the dialog below, we are creating a default rule to show an empty cell (with a ‘-‘). In our example this will match cases where the RSI value is <= 80 and >= 20.
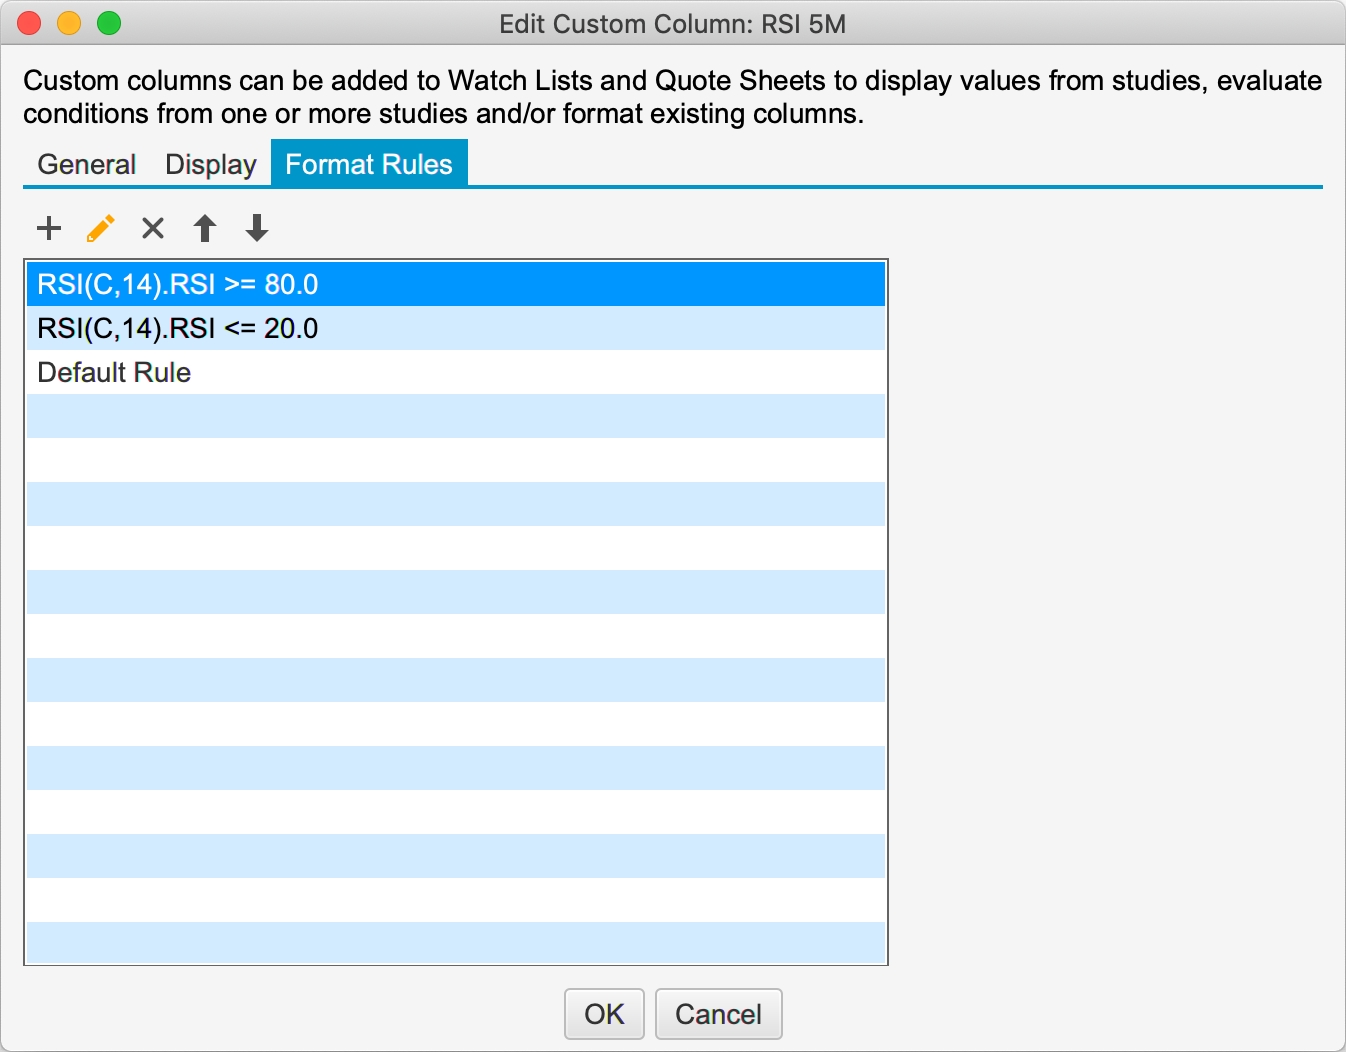
The screen shot below shows all the rules that we have defined for this custom column. Please note that the position of the default rule does not matter. In our case it is the last rule in the list.
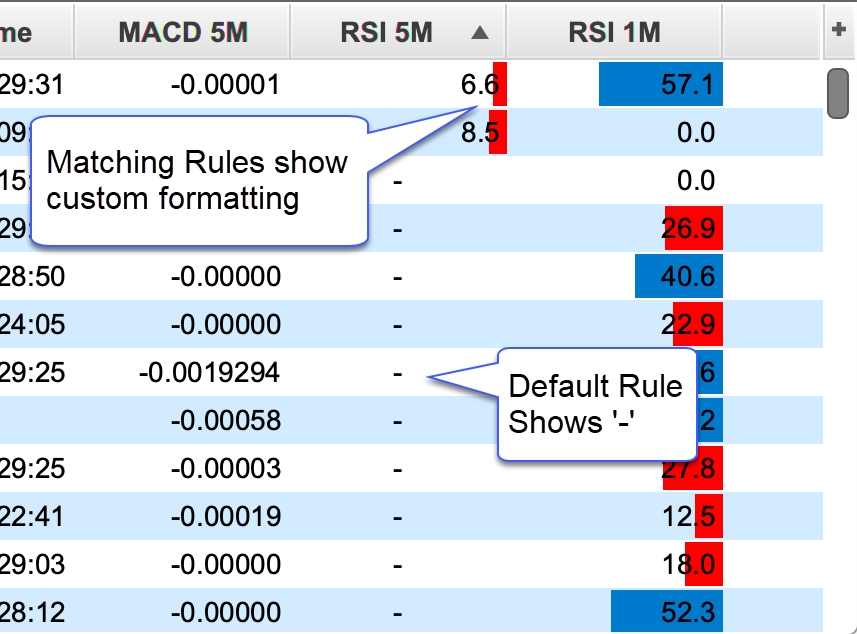
The screen shot below shows the default rule applied to the RSI 5M column. Rows that don’t match RSI < 20 and RSI > 80 show a dash. This helps to clean up the watch list and draw your attention to the rows of interest.
Gauges
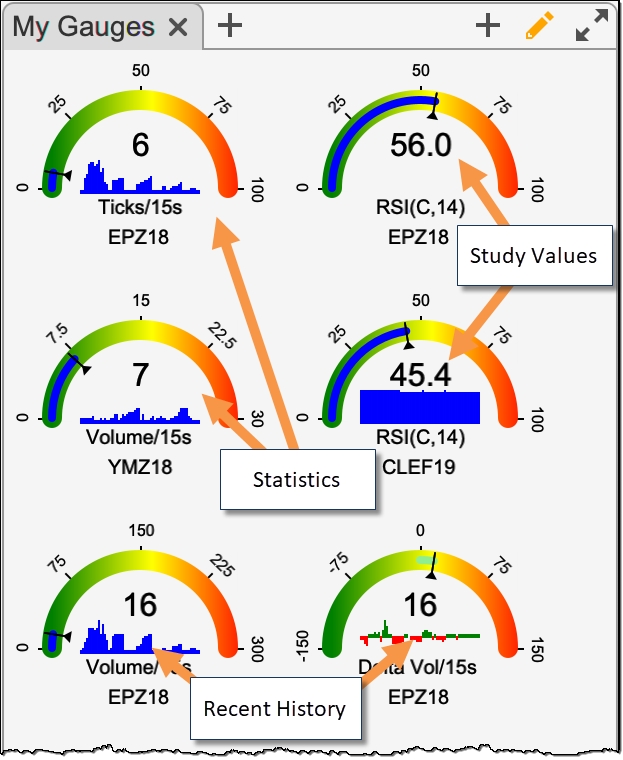
Gauges are used to visually display statistics or study values in a panel in the console (or desktop). These gauges are similar to the Speed Gauges study (first introduced in 5.4.0) but are not displayed on a chart and allow built-in or custom study values.
The example below shows study/statistic-based gauges inside a Gauge Panel.
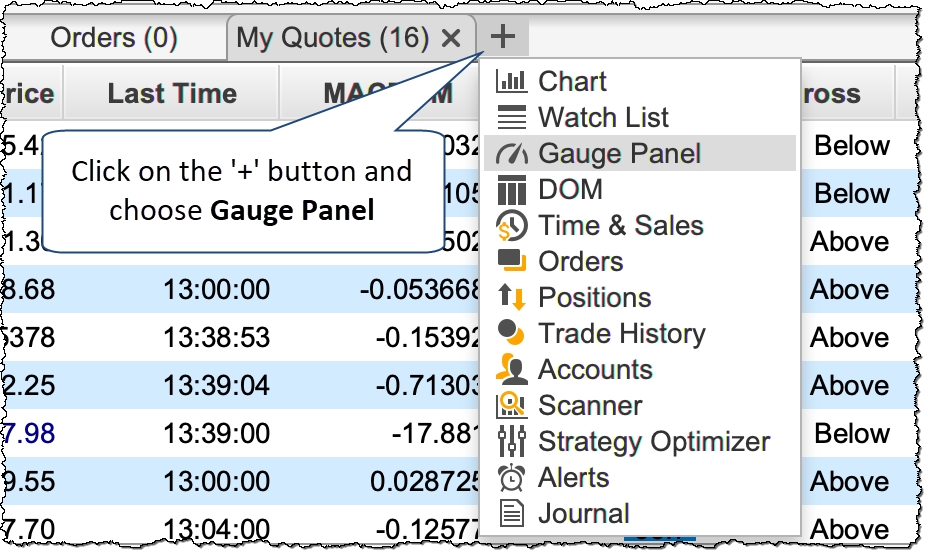
To open/create a Gauges panel, click on the + (plus) button next to an open tab in the Console (or in a desktop) and select Gauge Panel.
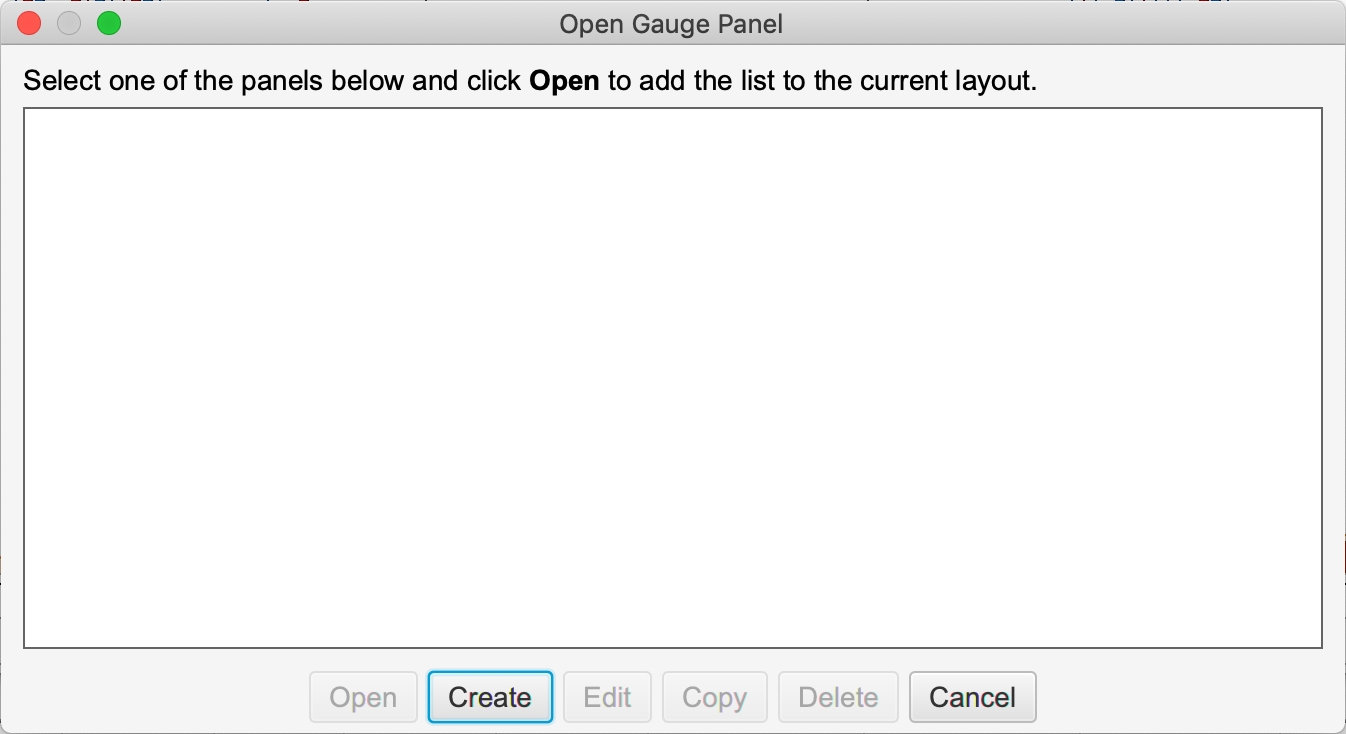
The following dialog will be displayed with your existing gauge panels. Click on the Create button to create a new Gauge Panel.
The value for a gauge is computed from a single instrument although you could use a custom instrument to combine multiple instruments.
Statistic Gauges
The following options are available for statistics:
Ticks – Displays number of ticks that occurred over the given interval (in seconds). This is often used to gauge the speed of the market.
Price – Current price.
Volume – Traded volume over the given interval (in seconds).
Bid Vol – Volume that occurred at the Bid Price.
Ask Vol – Volume that occurred at the Ask Price.
Delta Vol – Difference between Bid/Ask Volume (Ask Volume – Bid Volume).
Delta Spread – Difference between the current Best Bid/Ask sizes (Best Bid Size – Best Ask Size).
Delta DOM – Difference between the total Bid/Ask sizes (Total Bid Sizes – Total Ask Sizes) in the Depth of Market (DOM).
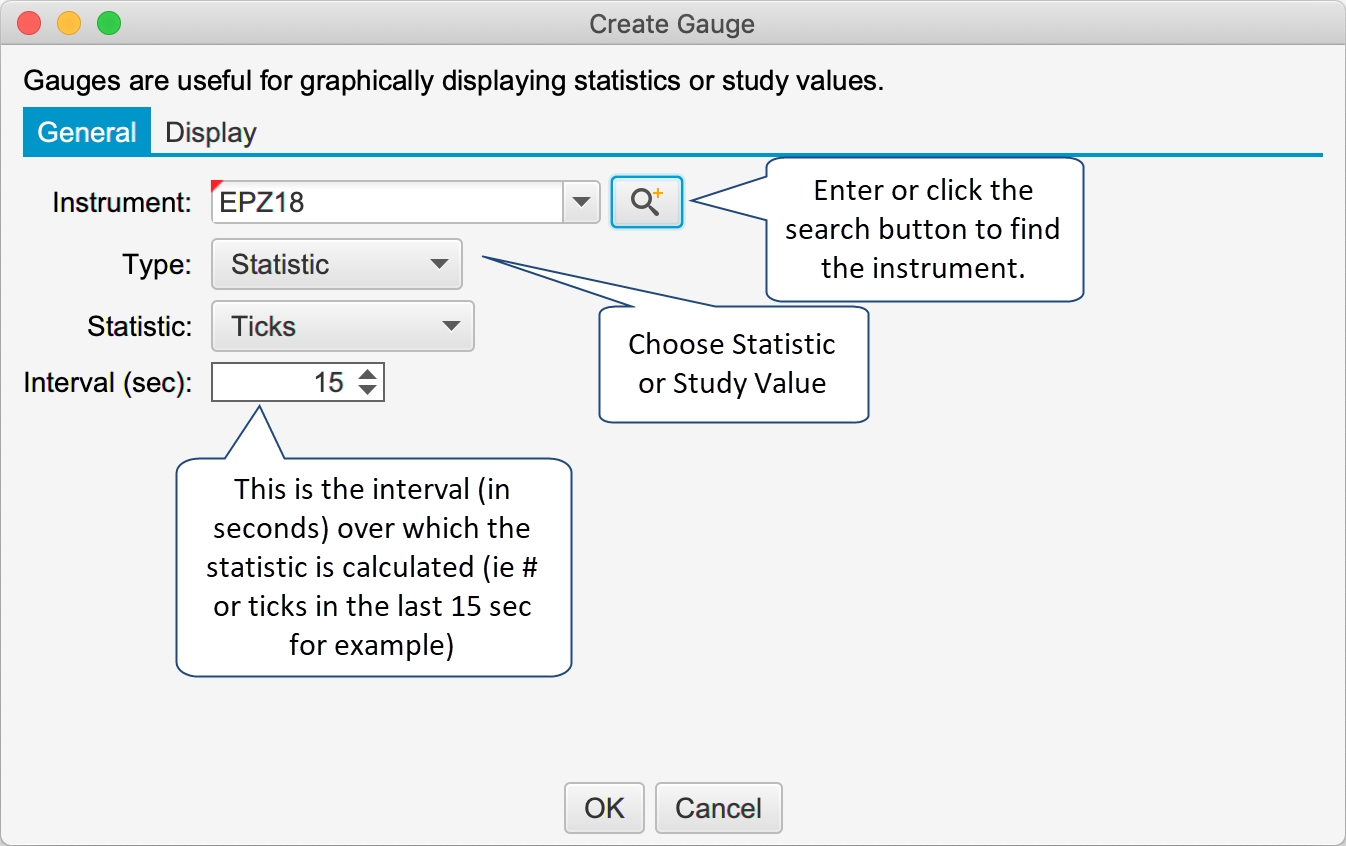
Study Value Gauges
Study Value Gauges display a value (and recent history) from a built-in or custom study. Select/configure a study and choose the value from the study that you would like to display. For live/real time updates select the Bar Updates option.
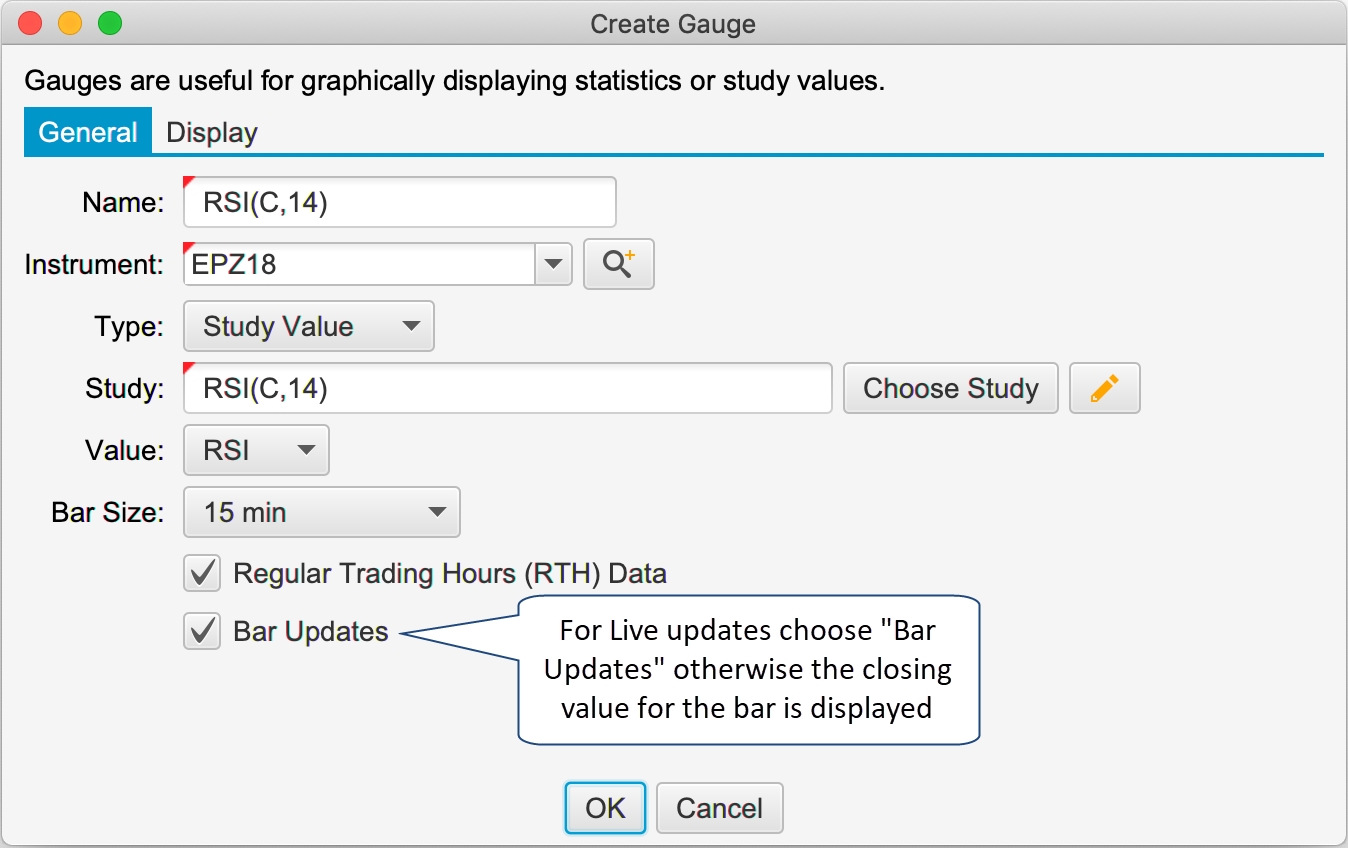
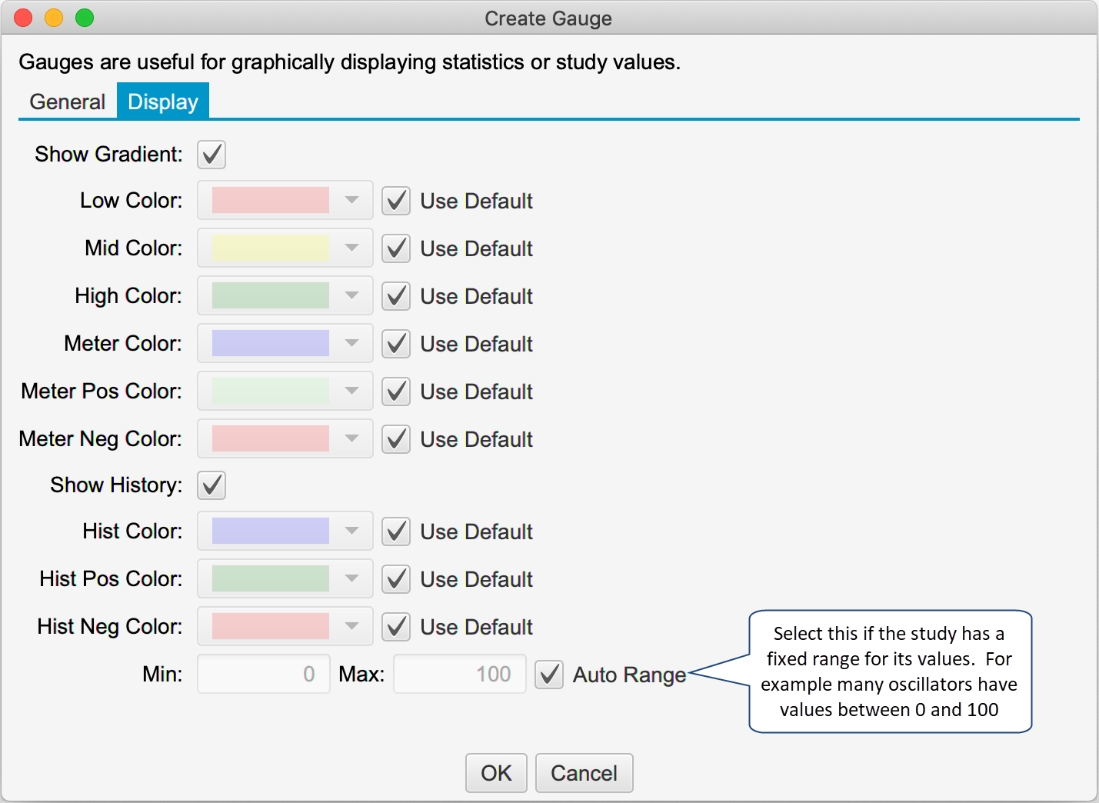
Display options are available for both Study Value and Statistic Gauges under the Display tab:
Watch List Flags and Filtering
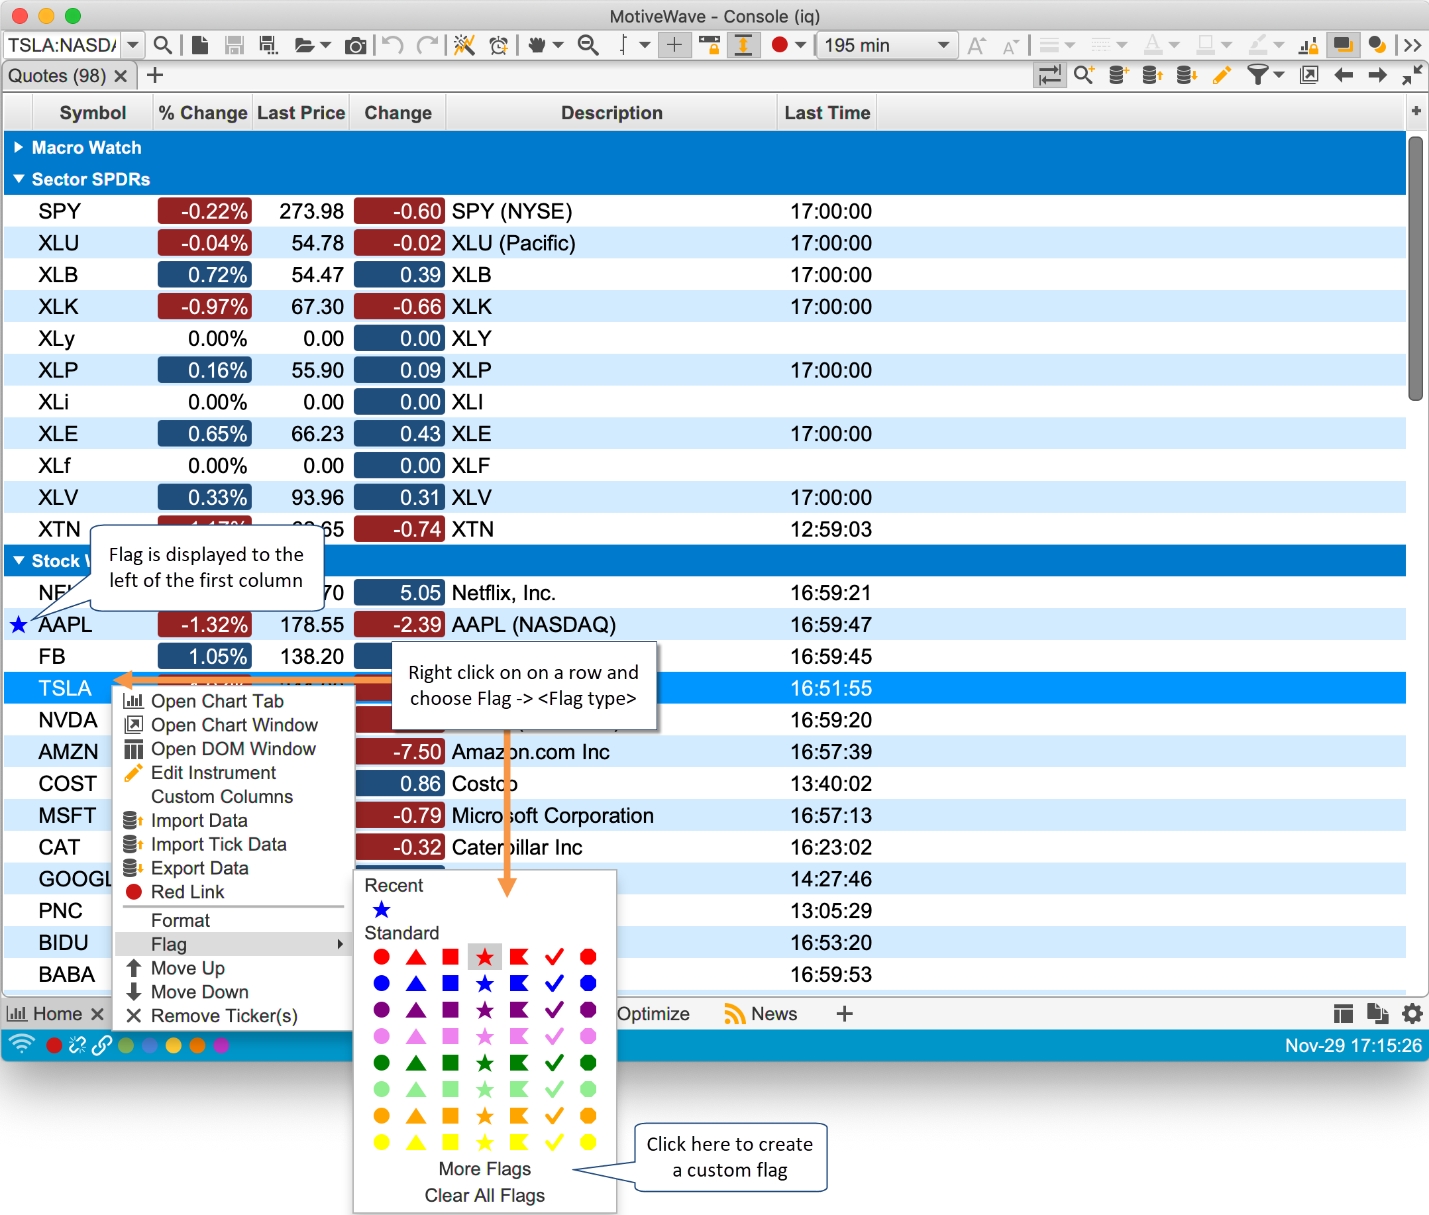
An icon (or flag) can be displayed on the left-hand side of a Watch List (or Quote Sheet) to highlight important or notable instruments. To assign a flag to an instrument right click on it and choose Flag -> <Flag>. A set of common flags will appear in the menu.
When a flag is assigned, it will appear to the left of the instrument (see below).
The following are the types of flags that are available:
Circle
Triangle
Square
Star
Flag
Check
Octagon
Custom flags can be created by choosing More Flags from the flag menu (see above). In the Choose Flag dialog you can select the type and the color. All recently used flags will appear in the Recent section of the flag menu (for convenience).

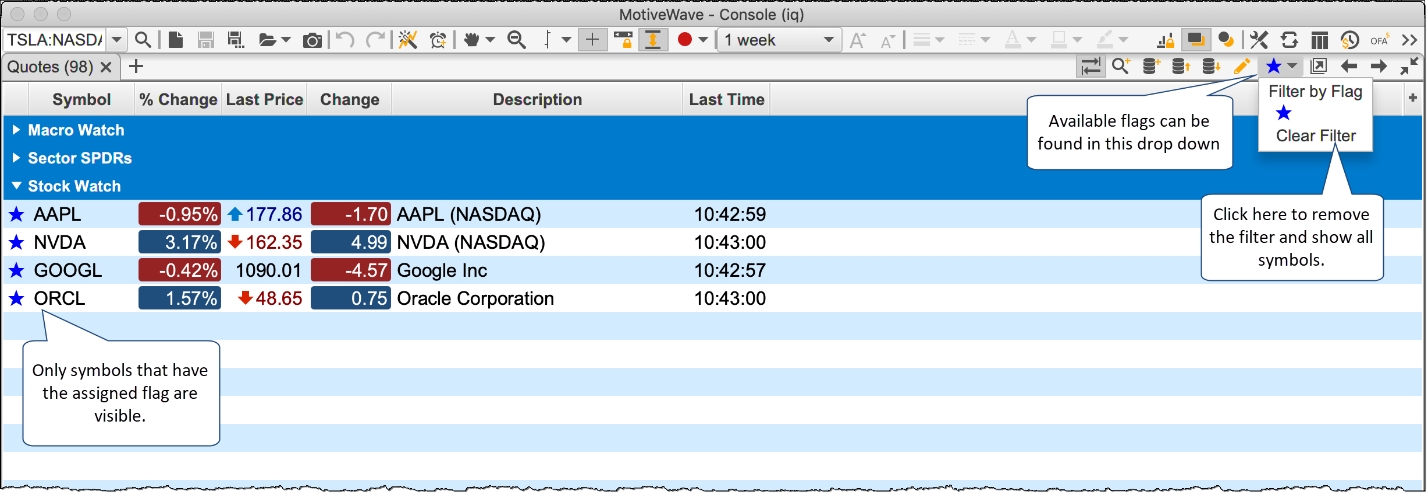
Filtering may also be applied to a Watch List or Quote sheet by selecting the flag from the filter button in the tool bar. Choose Clear Filter to show all instruments.
Components
Support / Resistance Zones
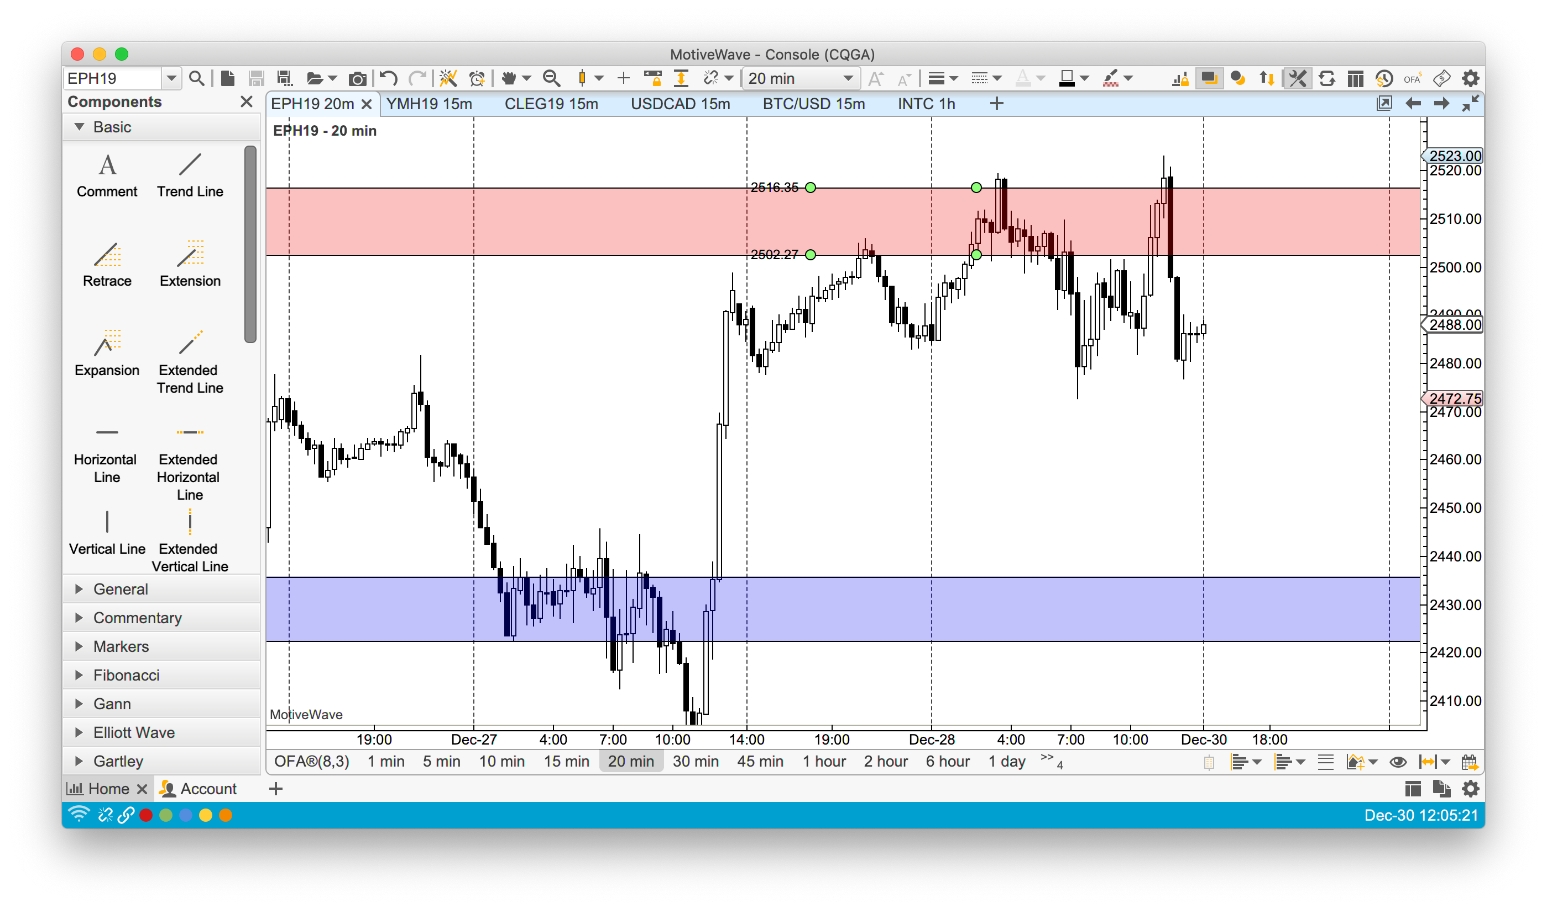
Support and Resistance zones are two new components that may be used to highlight an area of support or resistance on a price graph.
Profit/Loss Calculator
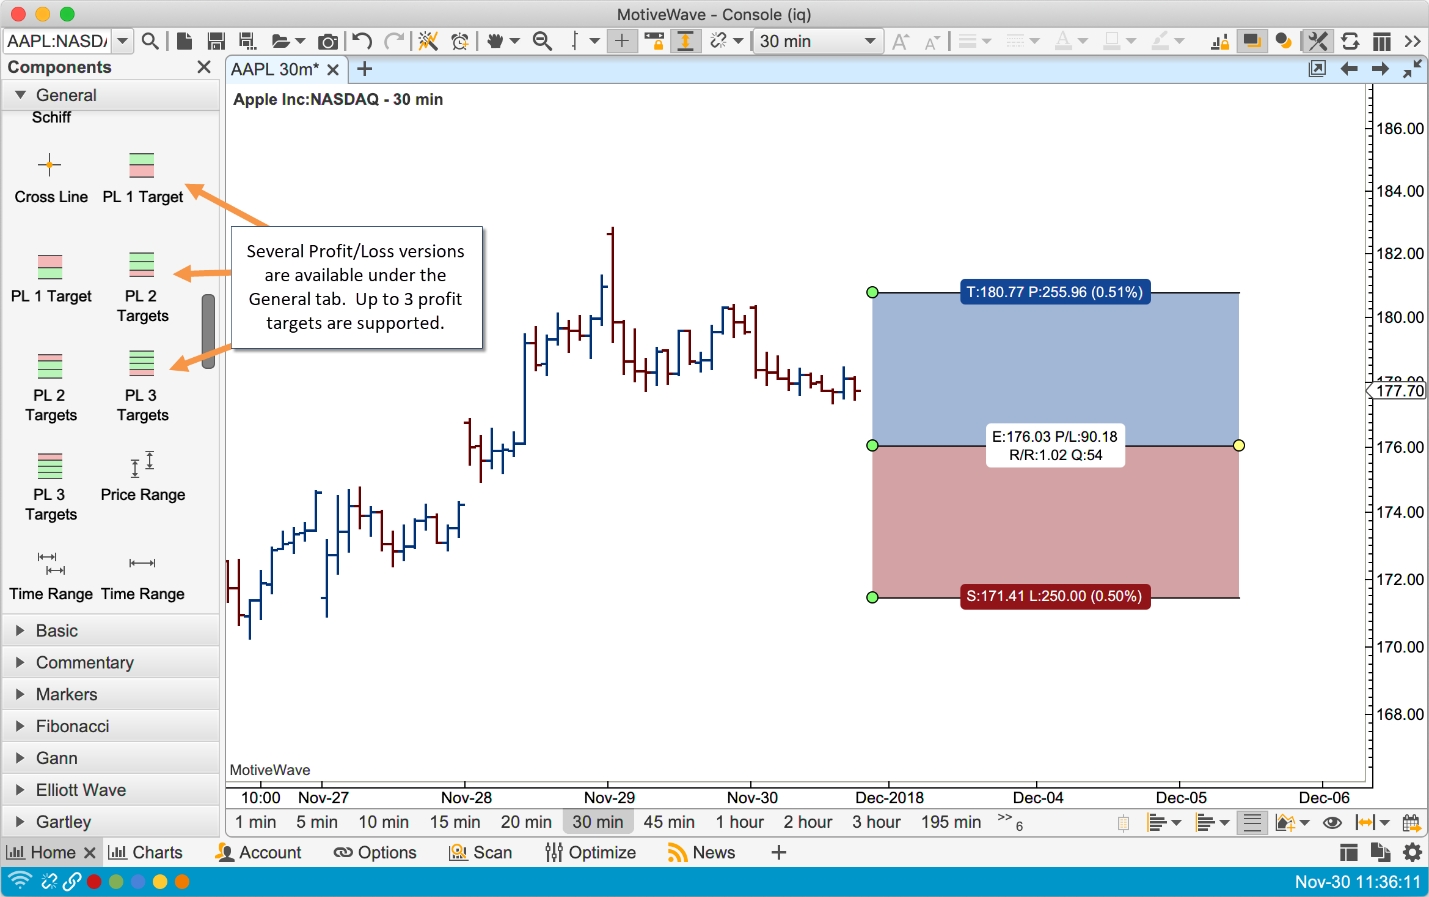
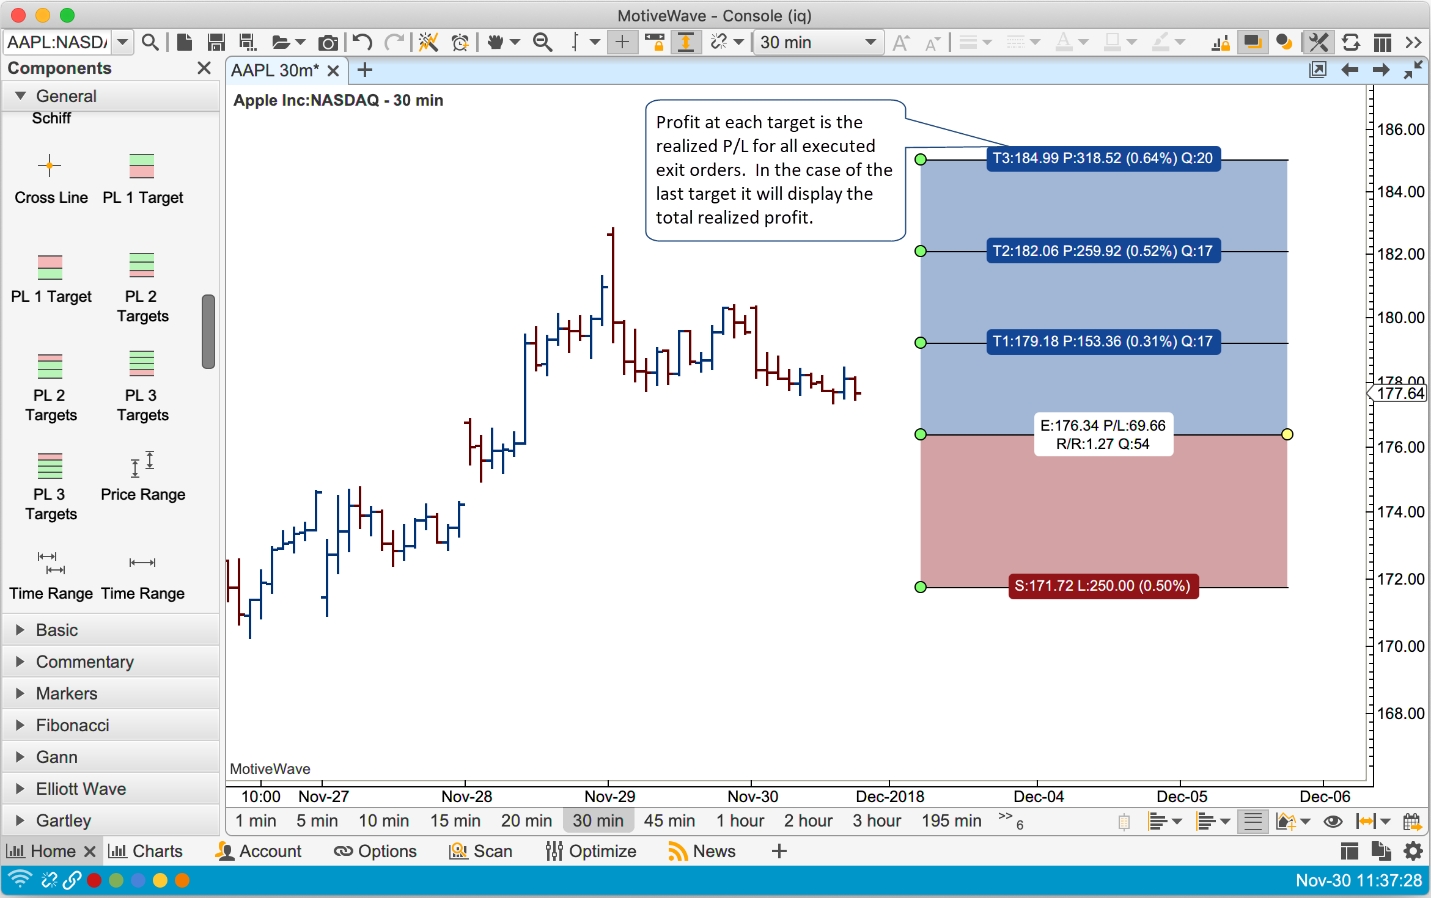
The Profit/Loss calculator component will calculate the potential profit (up to three targets) with a stop loss order. This component can be found under the General tab of the Components Panel. Risk levels can be computed using a percentage of your account or using a fixed amount. Labels shown on the component are shorted (to save space):
T – Target price for a take profit order (these are named T1, T2, T3 if multiple targets are used).
P – Profit Amount and percent of account. Each take profit order will include the total profit realized at that price.
Q – Quantity.
E – Entry price.
P/L – Profit/Loss calculated at the current price.
R/R – Risk/Reward ratio.
S – Stop Loss price.
L – Loss amount and percent of account for the stop loss order.
In the following screen shot, a PL component has been added to the chart with 1 profit target and a risk percent of 0.5% of the account value (50K in this case). Entry and exit quantities are calculated from the risk percent and position of the stop loss target.
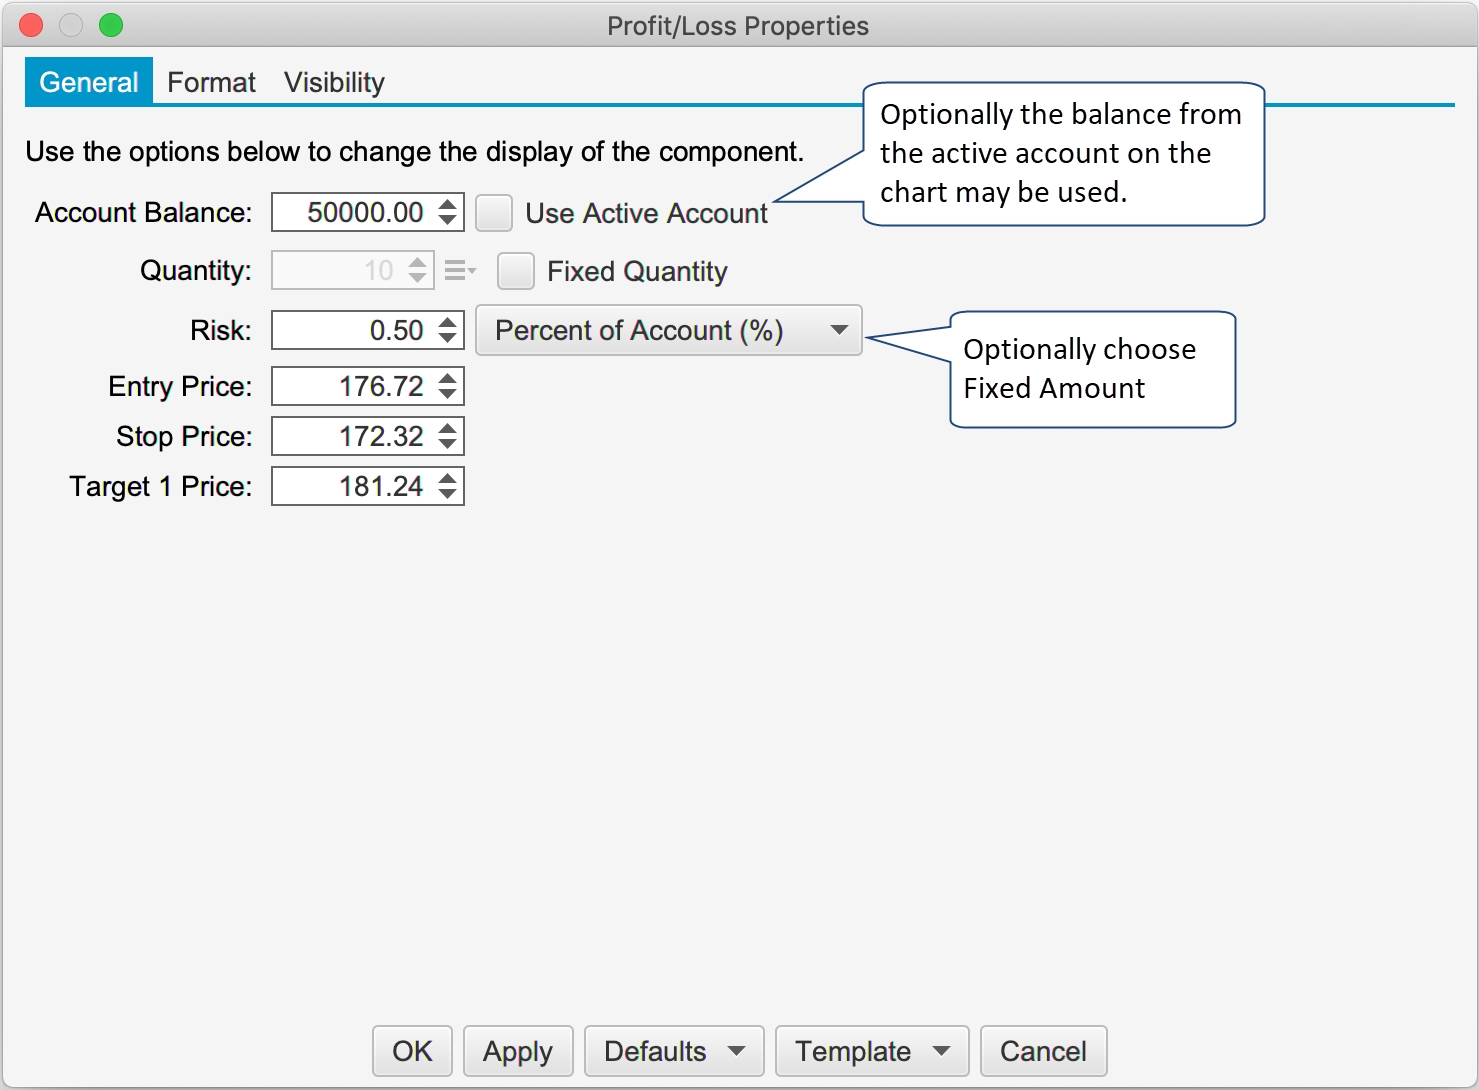
You can change the behavior of the component from the Properties dialog (double click on the component). There two methods available for calculating risk:
Percent of Account – This option will dynamically calculate the amount at risk by taking a percentage of the account balance. This can either by statically defined (such as 50K) or using the current balance of the active account on the chart.
Fixed Amount – Enter a fixed dollar amount to put at risk.
If a fixed quantity is chosen, then the risk is dynamically computed based on the position of the stop order.
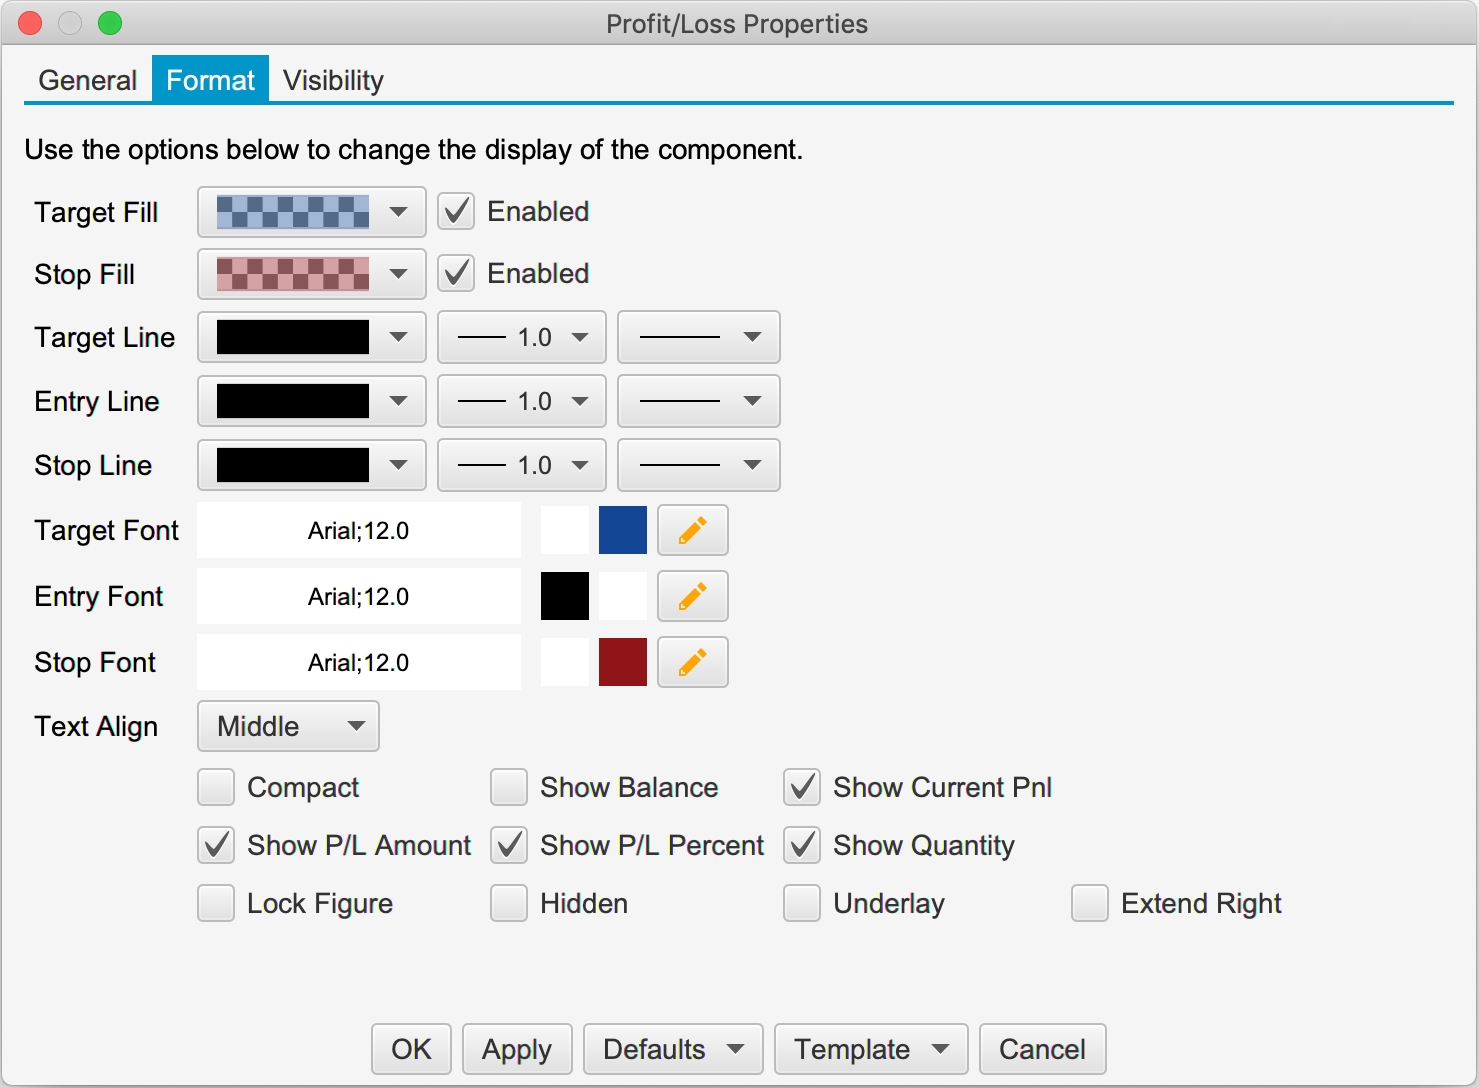
The following screen shot shows the formatting options for the Profit Loss calculator.
Below is an example of a Profit Loss calculator with 3 targets. The profit calculated at each target represents the total profit (as opposed to the profit for the specific exit order). For example the profit displayed at target 2 will be the profit from the target 1 exit order plus the profit from the target 2 exit order plus the unrealized profit from the target 3 order.
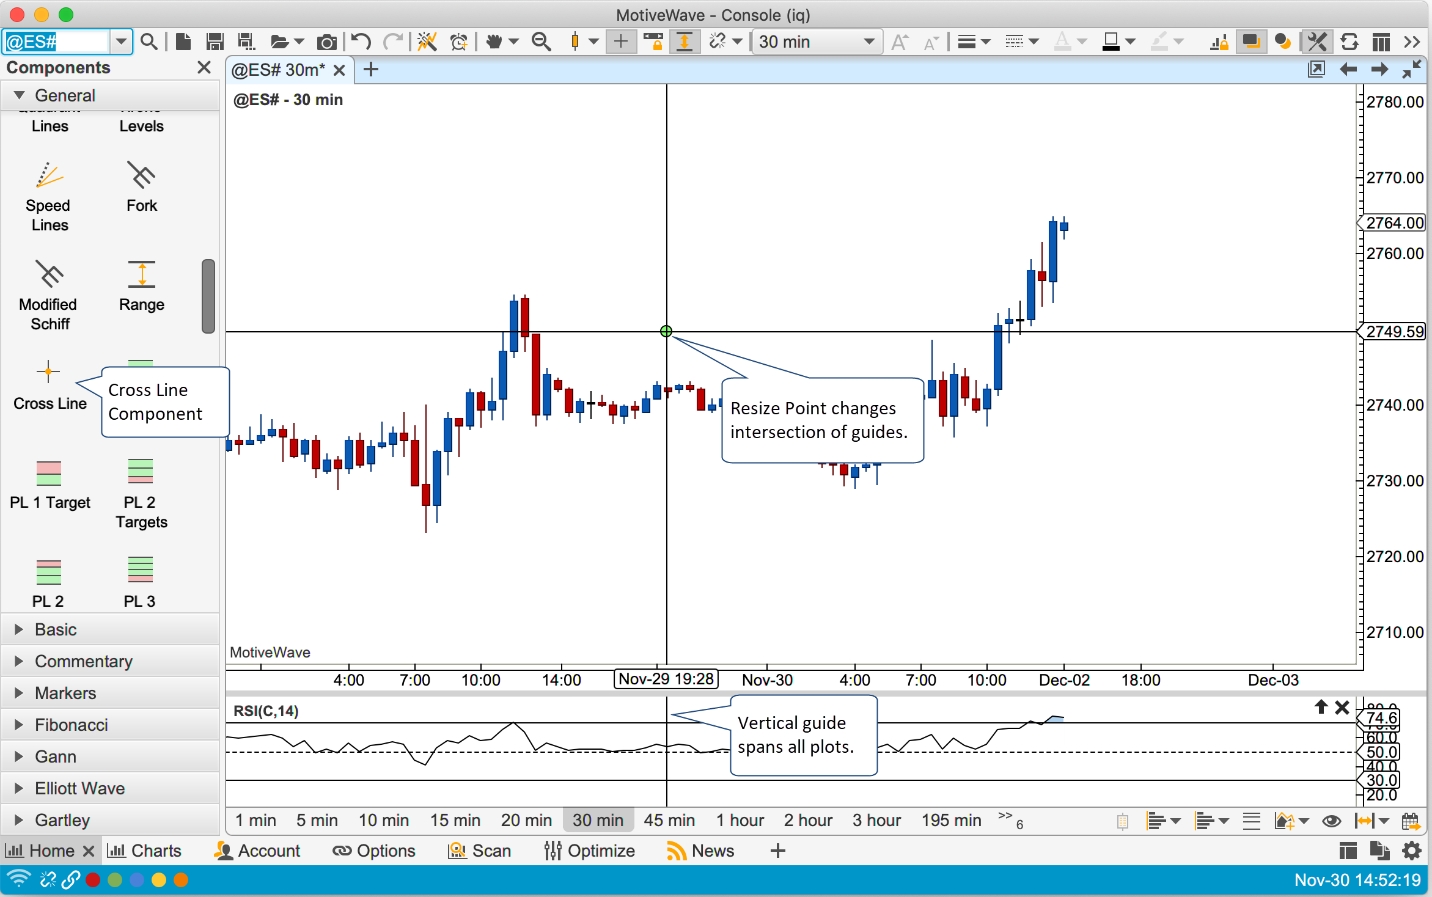
Cross Line Component
The cross-line component is a combination of a vertical guide and a horizontal guide. This component is available in the General panel. Below is an example of a cross line added to the price graph. Note: the vertical (time) guide will span all plots in the chart.
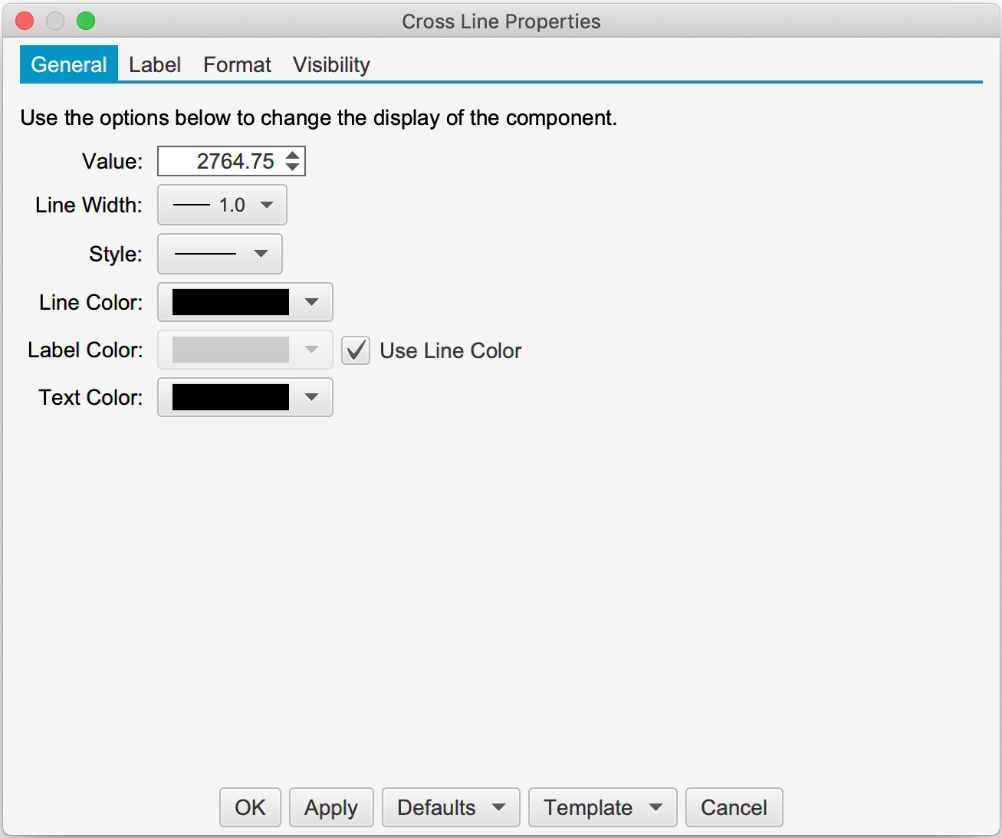
Double click on the cross line to show the properties (see below):
Labels
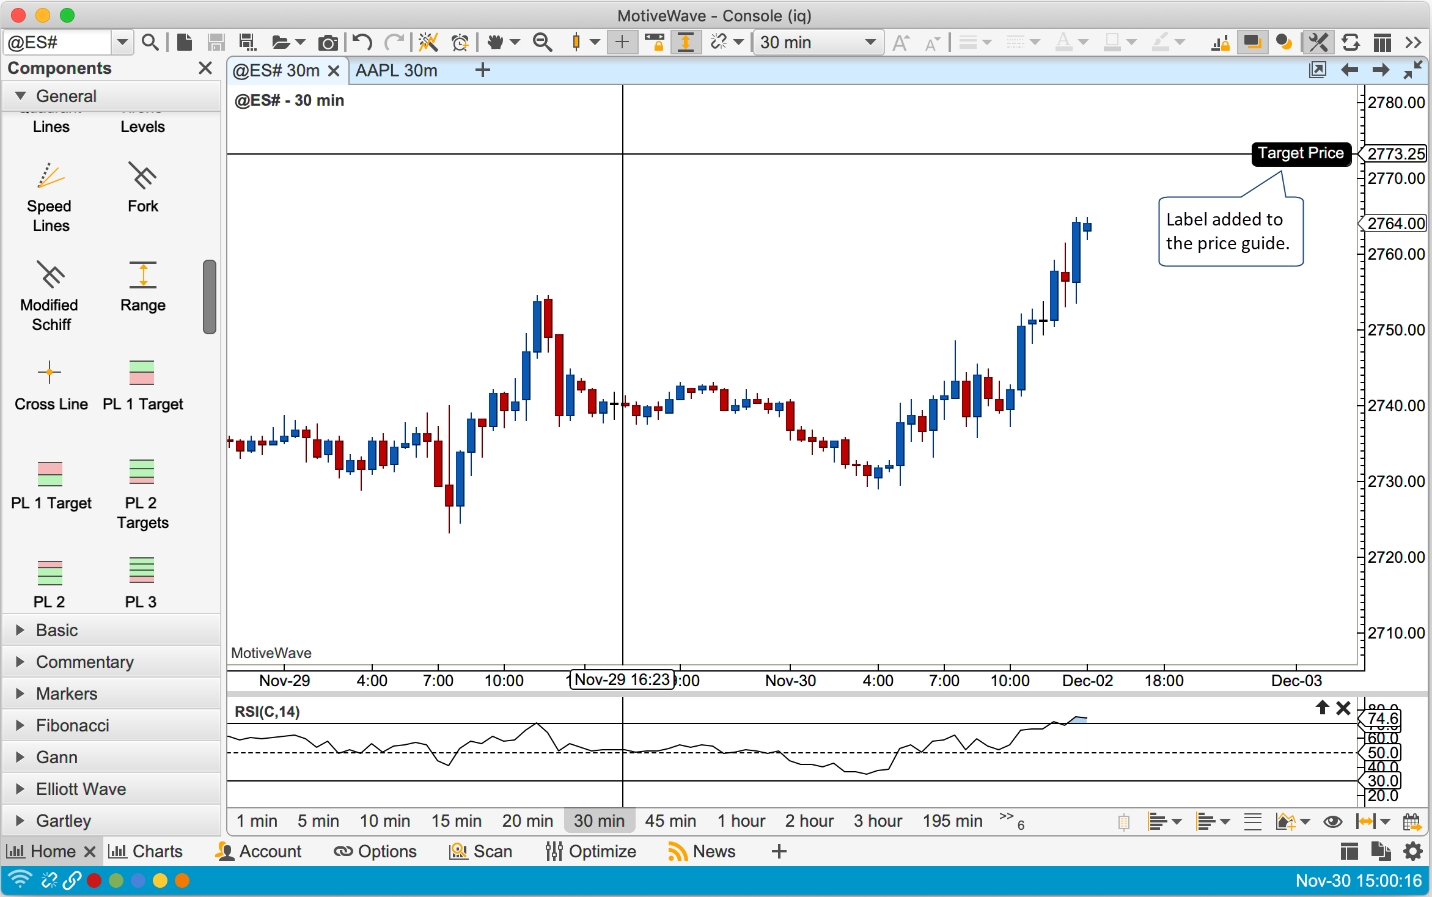
Optionally a label can be added to the horizontal (price) guide to help identify the purpose of the cross line. This option can be enabled from the Label tab of the properties dialog:
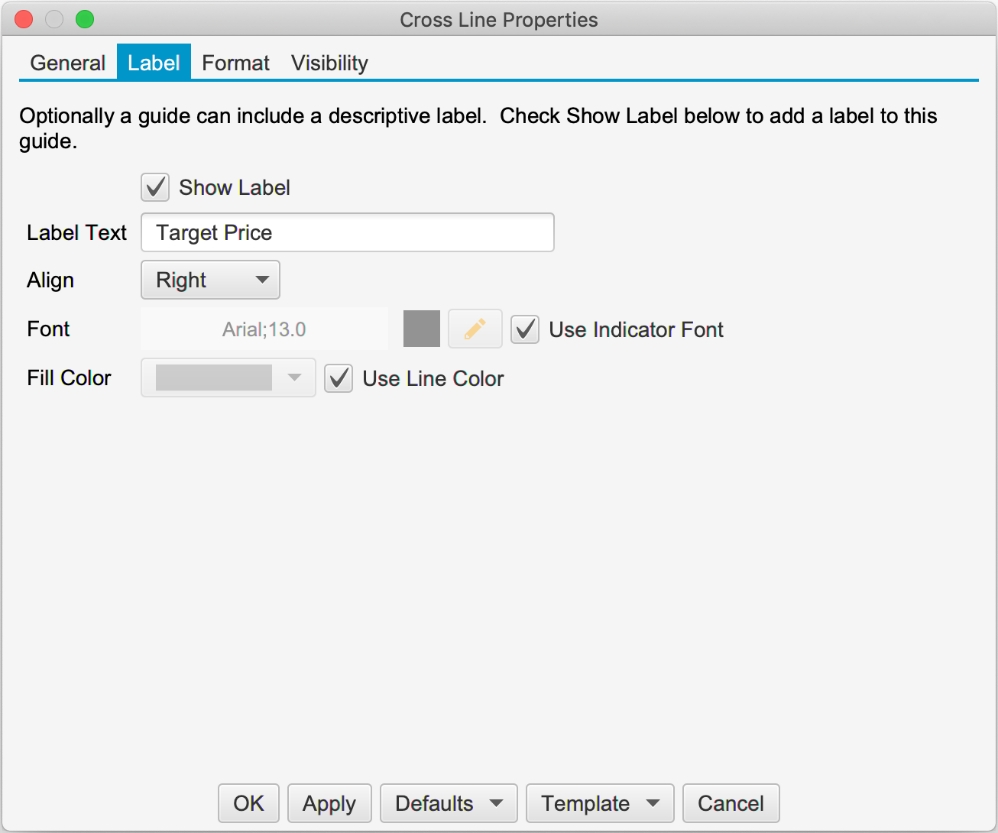
Below is the cross line with the label “Target Price” on the price guide:
Component Templates
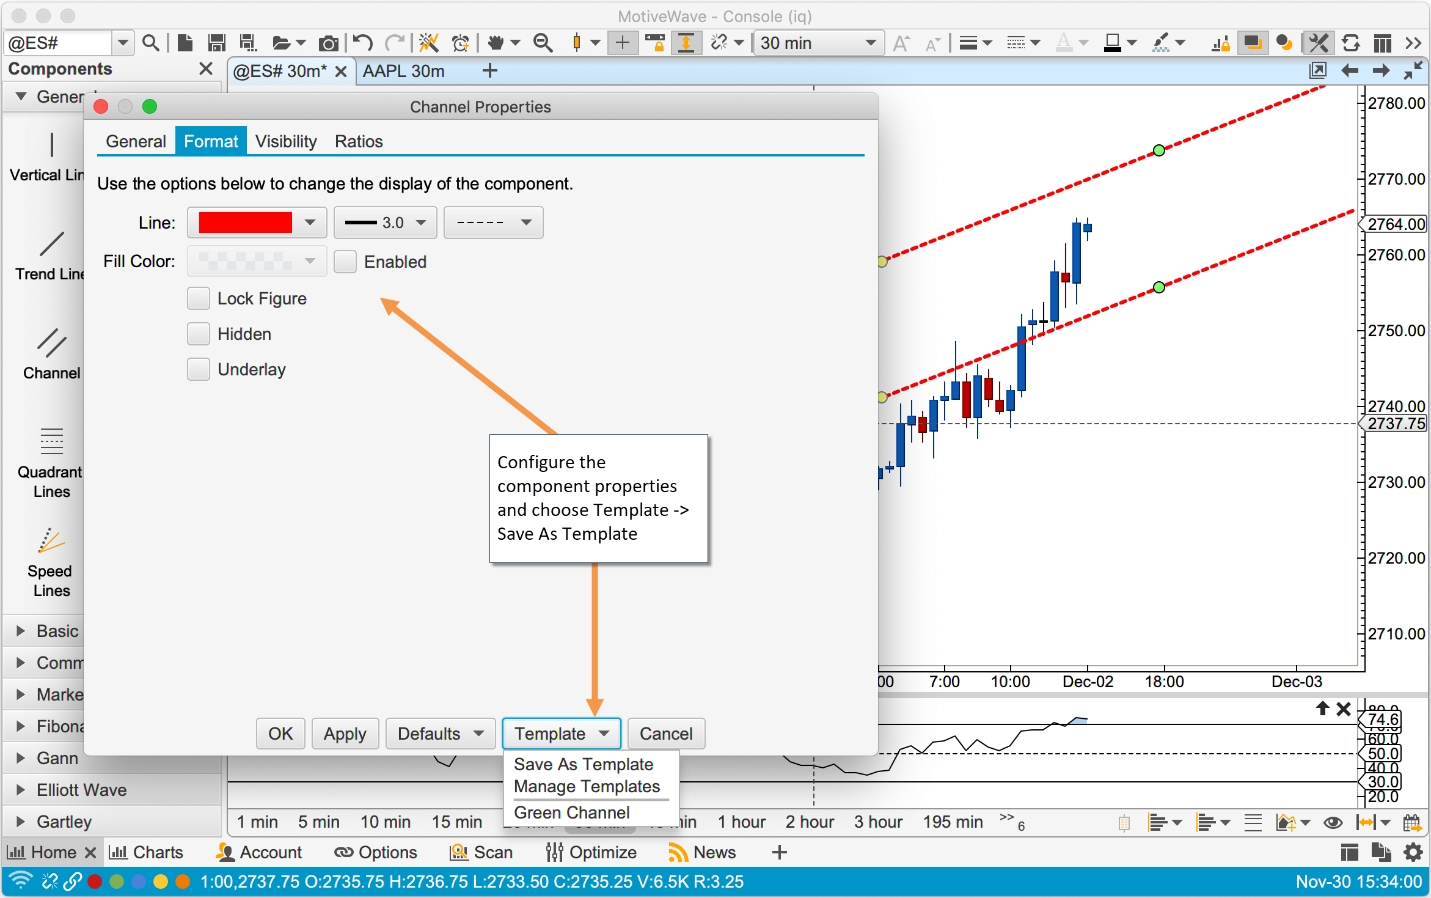
Component templates are similar to study templates in that they allow you to choose settings and formatting for a component and save it for later use. You can apply a component template via the context menu (right click) or from the Template menu button in the properties dialog.
In the example below, the channel component is configured to use a thick red dashed line and the “extend right” attribute enabled. From the Template menu button choose “Save As Template”. Note: existing templates for this component will appear in this drop down. Choose a template to apply it to the active component.
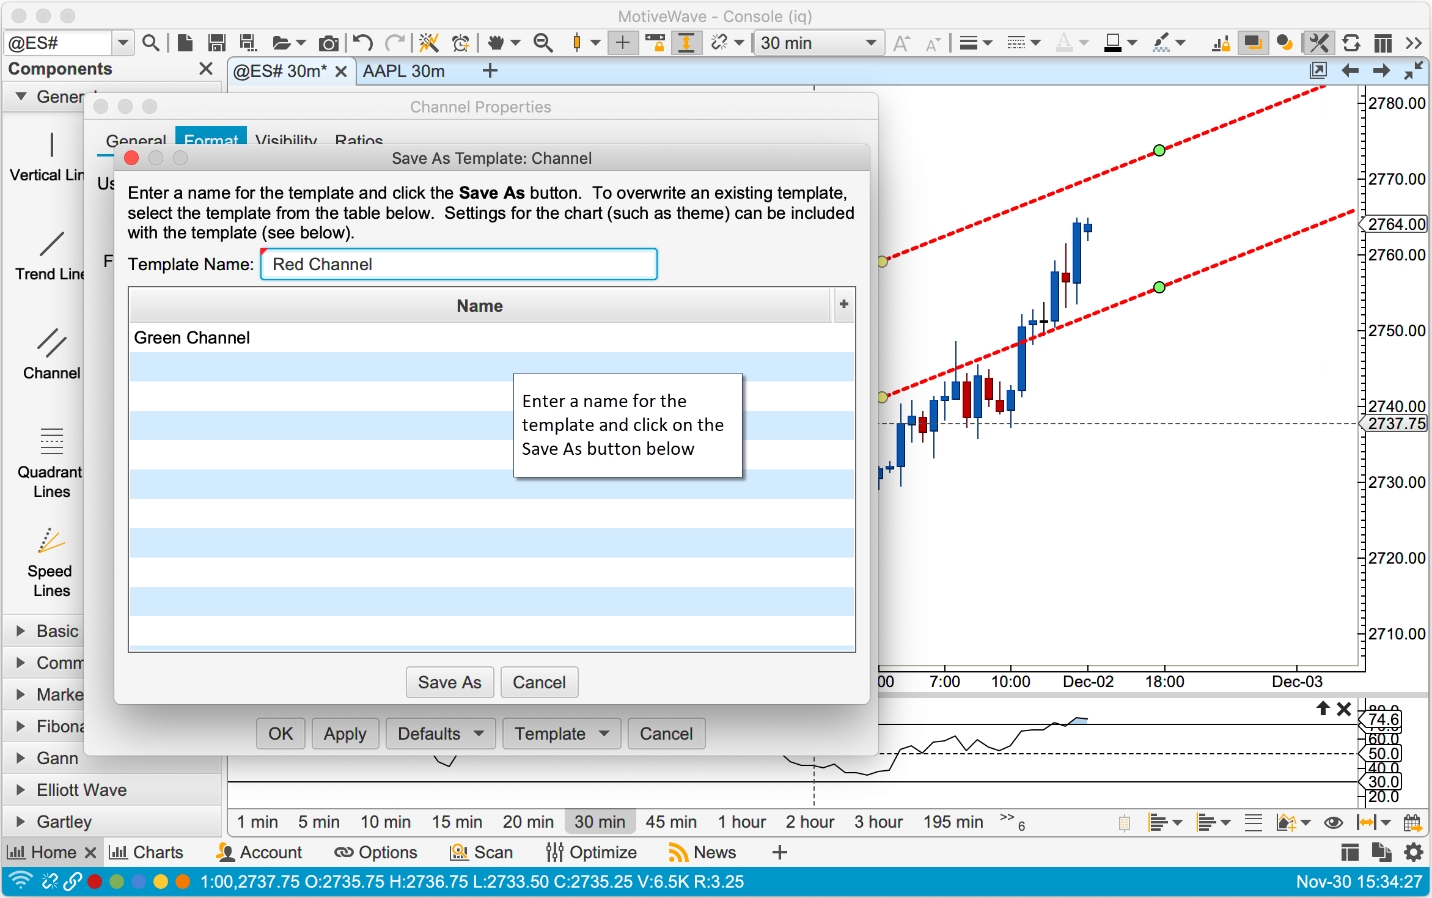
In the Save As Template dialog enter the name of the template. Template names are scoped to the type of component so you can reuse the same name across different component types. Click on the Save As button to save the template.
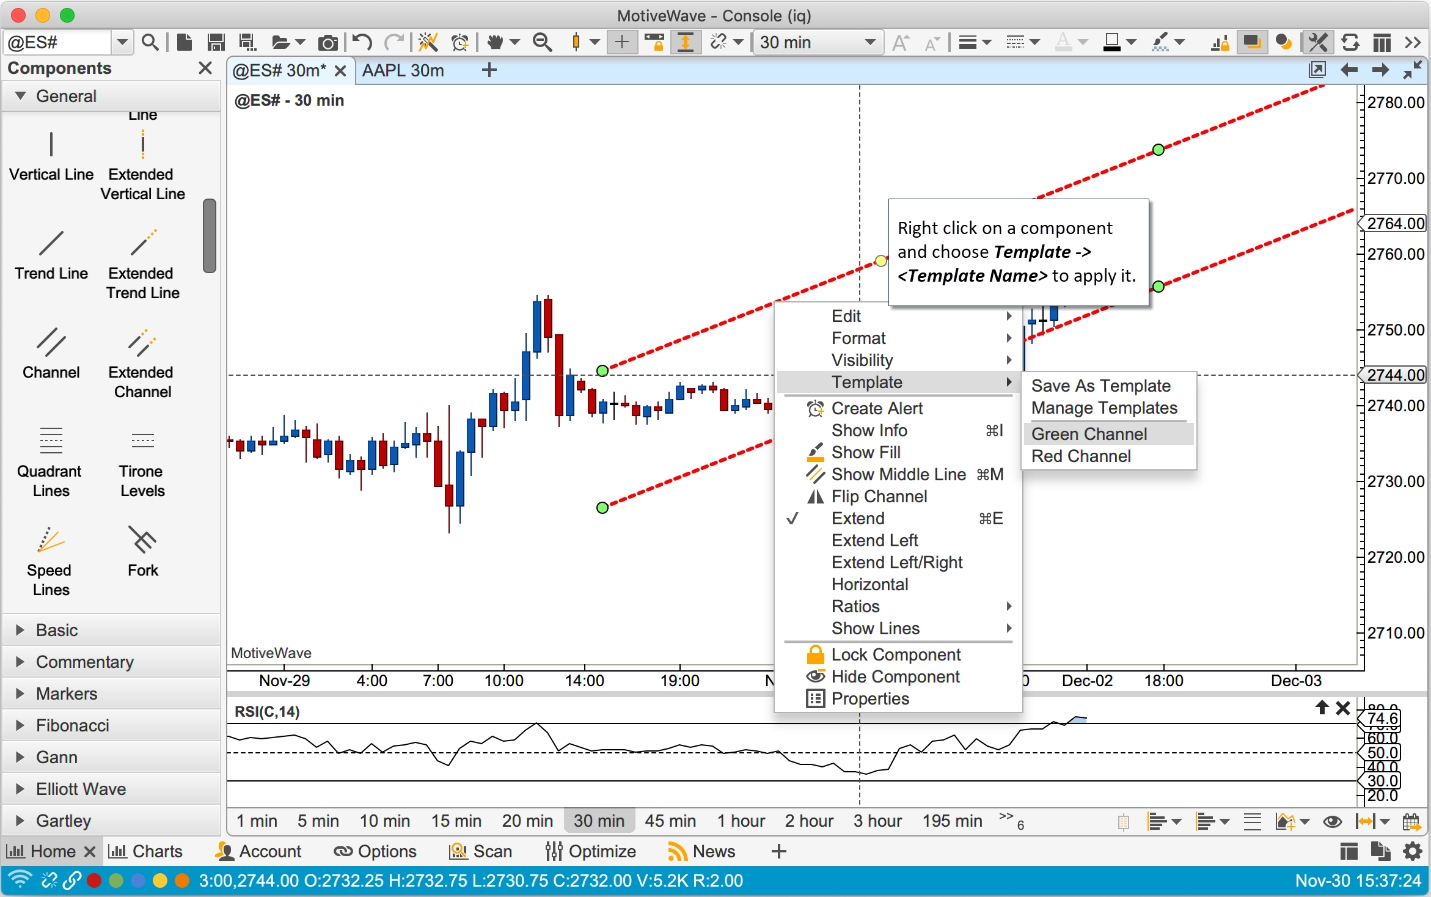
Right click on a component (in a chart) and choose Template -> Template Name to apply template settings.
Keyboard Shortcuts
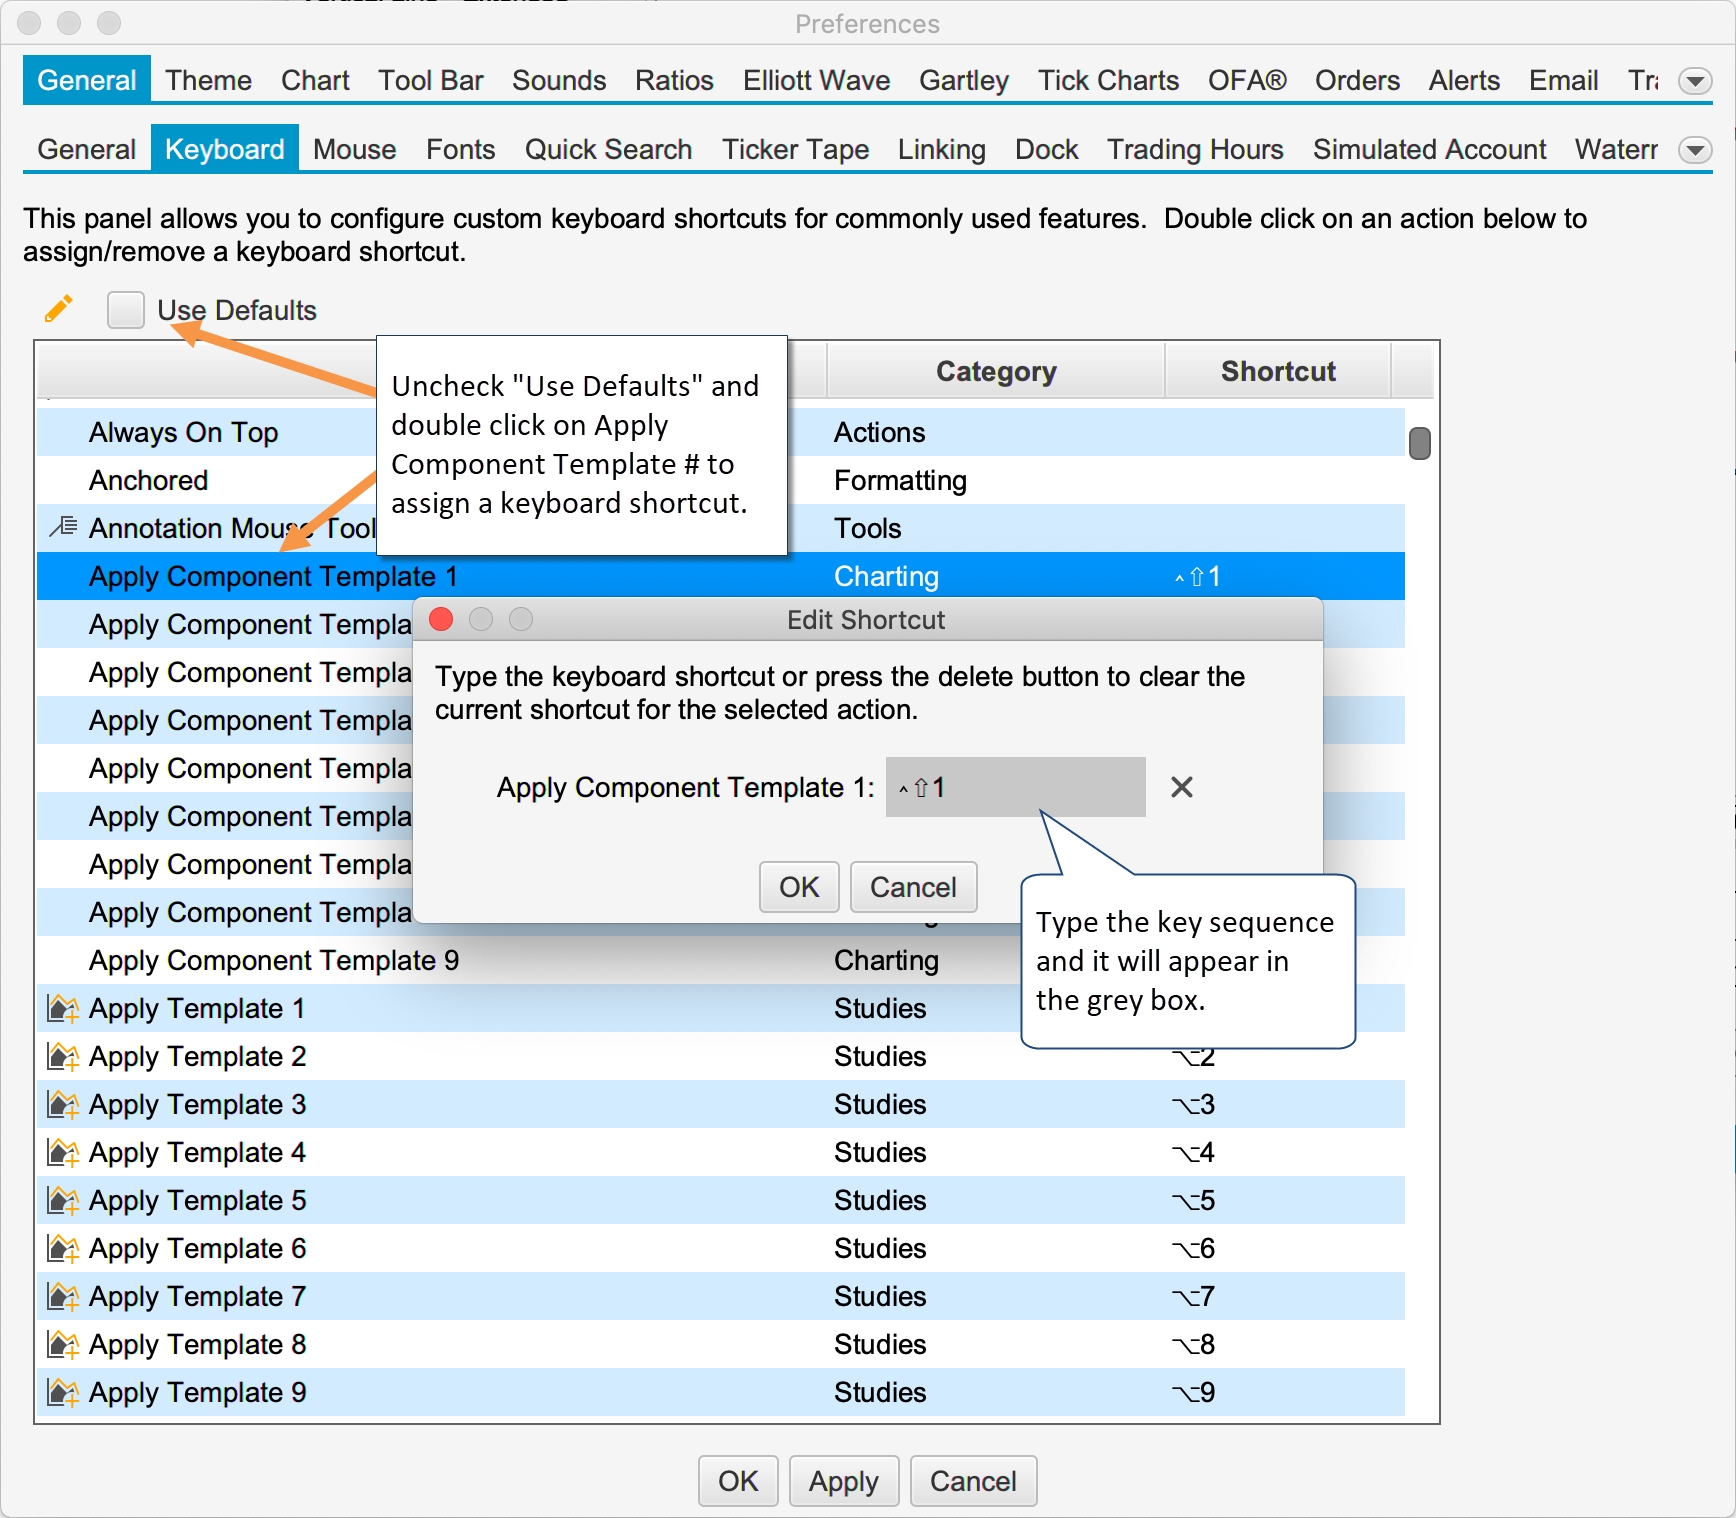
Keyboard shortcuts can be assigned to the first 9 templates. Open the Preferences Dialog (Configure -> Preferences from the Console menu bar) and click on General -> Keyboard. Nine actions are available Apply Component Template 1 – 9 in the action table. Double click on one of the actions to assign a keystroke (Note: you may need to uncheck Use Defaults if this is the first time assigning custom keystrokes).
Studies
We have added a few new studies and updated other studies in version 6.0.
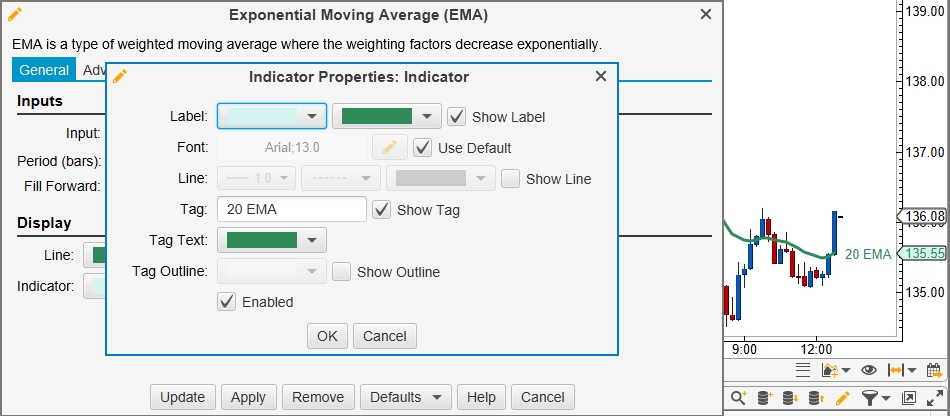
Study Indicator Tags
Descriptive tags can optionally be displayed next to the indicators displayed in the vertical axis. Edit the advanced indicator settings (click on the edit button next to an indicator in the study dialog) and check the “Show Tag” box.
TPO Study
Split
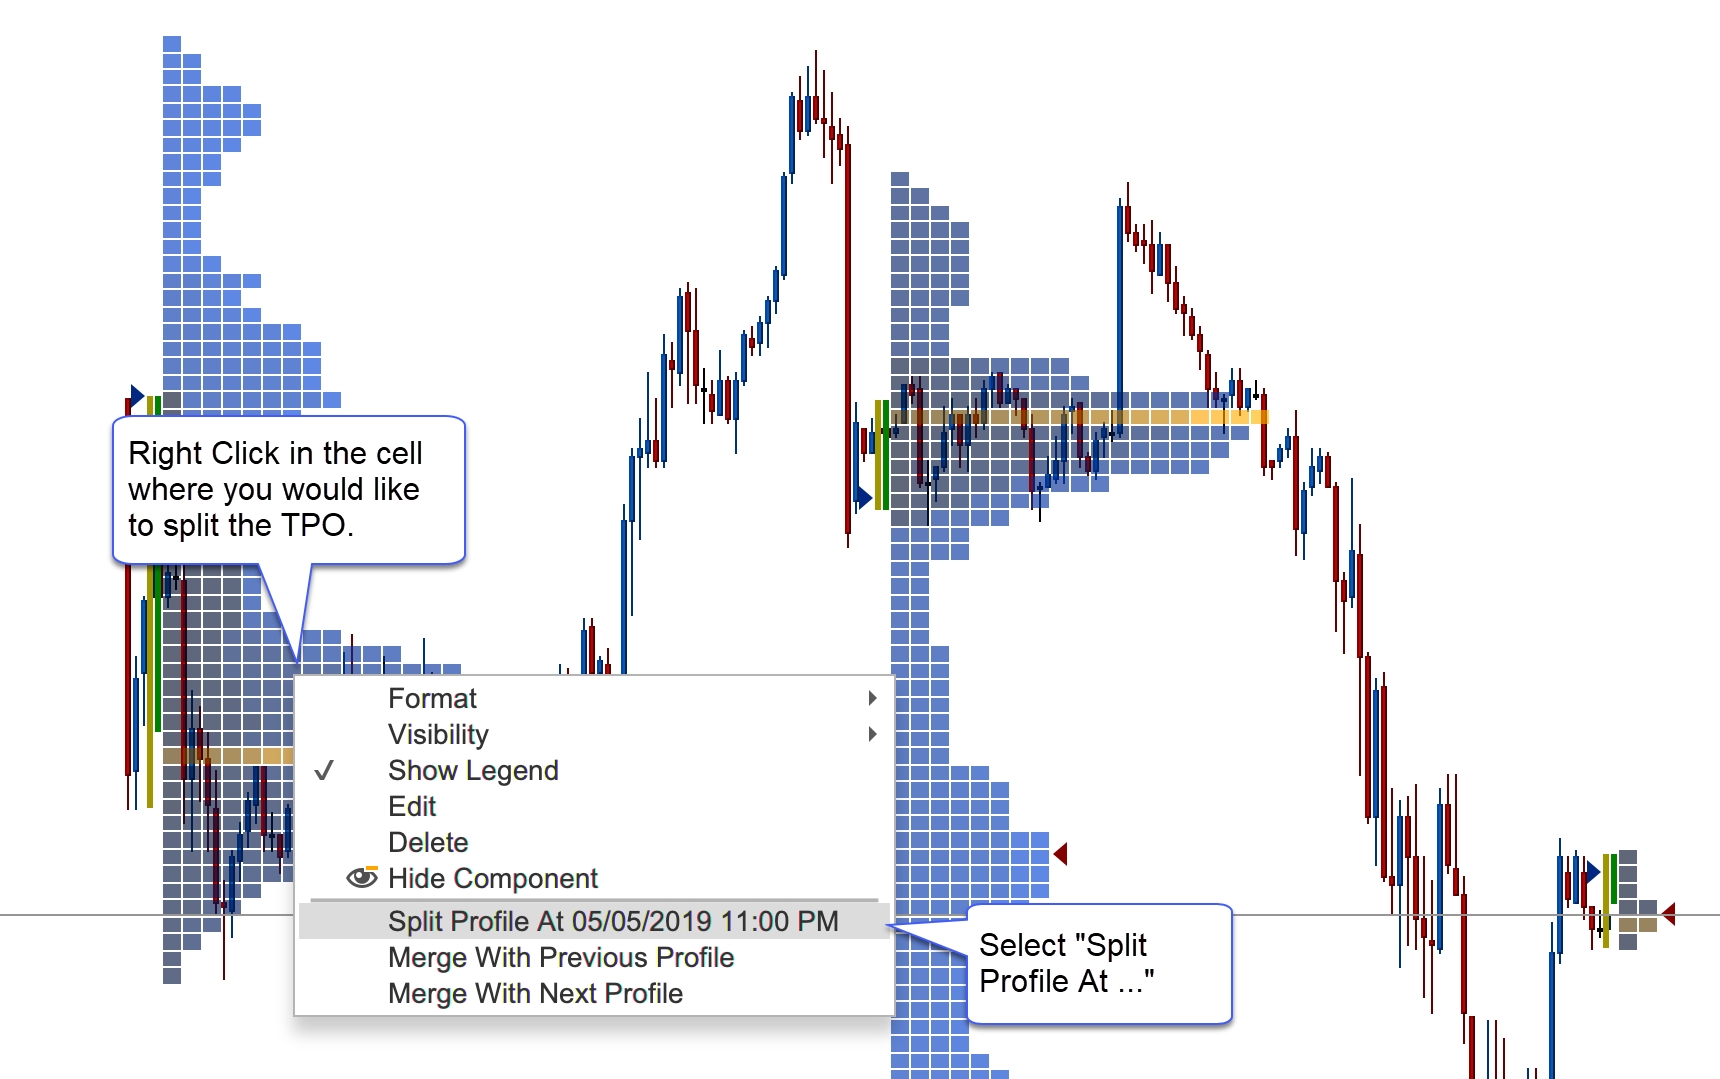
TPO Profile may be split from the context menu (right click on the TPO Profile Cell). The profile will be split at the cell where the context menu was opened.
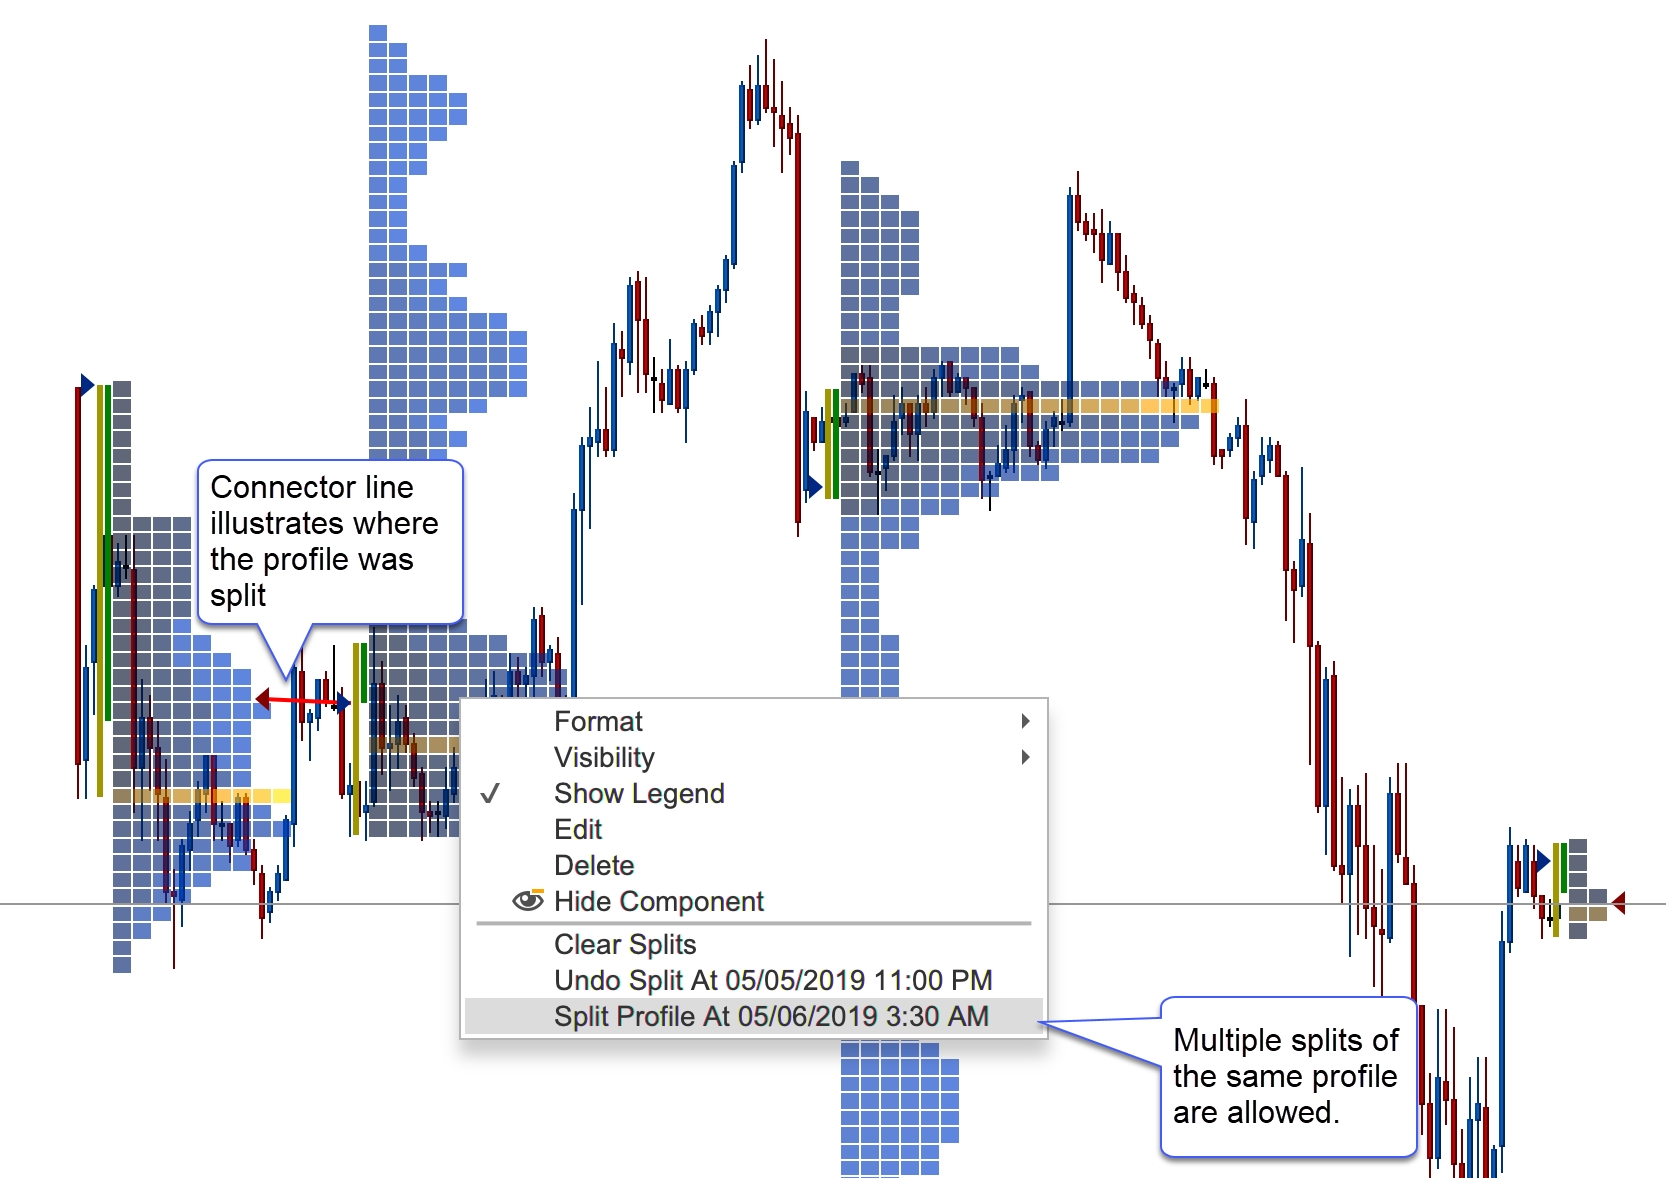
Split profiles have connector lines to indicate where the profiles were split. A TPO profile may be split multiple times. Splits may also be removed individually or all at once (Clear Splits option):
Merge
Merging profiles is similar to splitting profiles. Right click on a profile and choose Merge With Previous Profile or Merge With Next Profile:
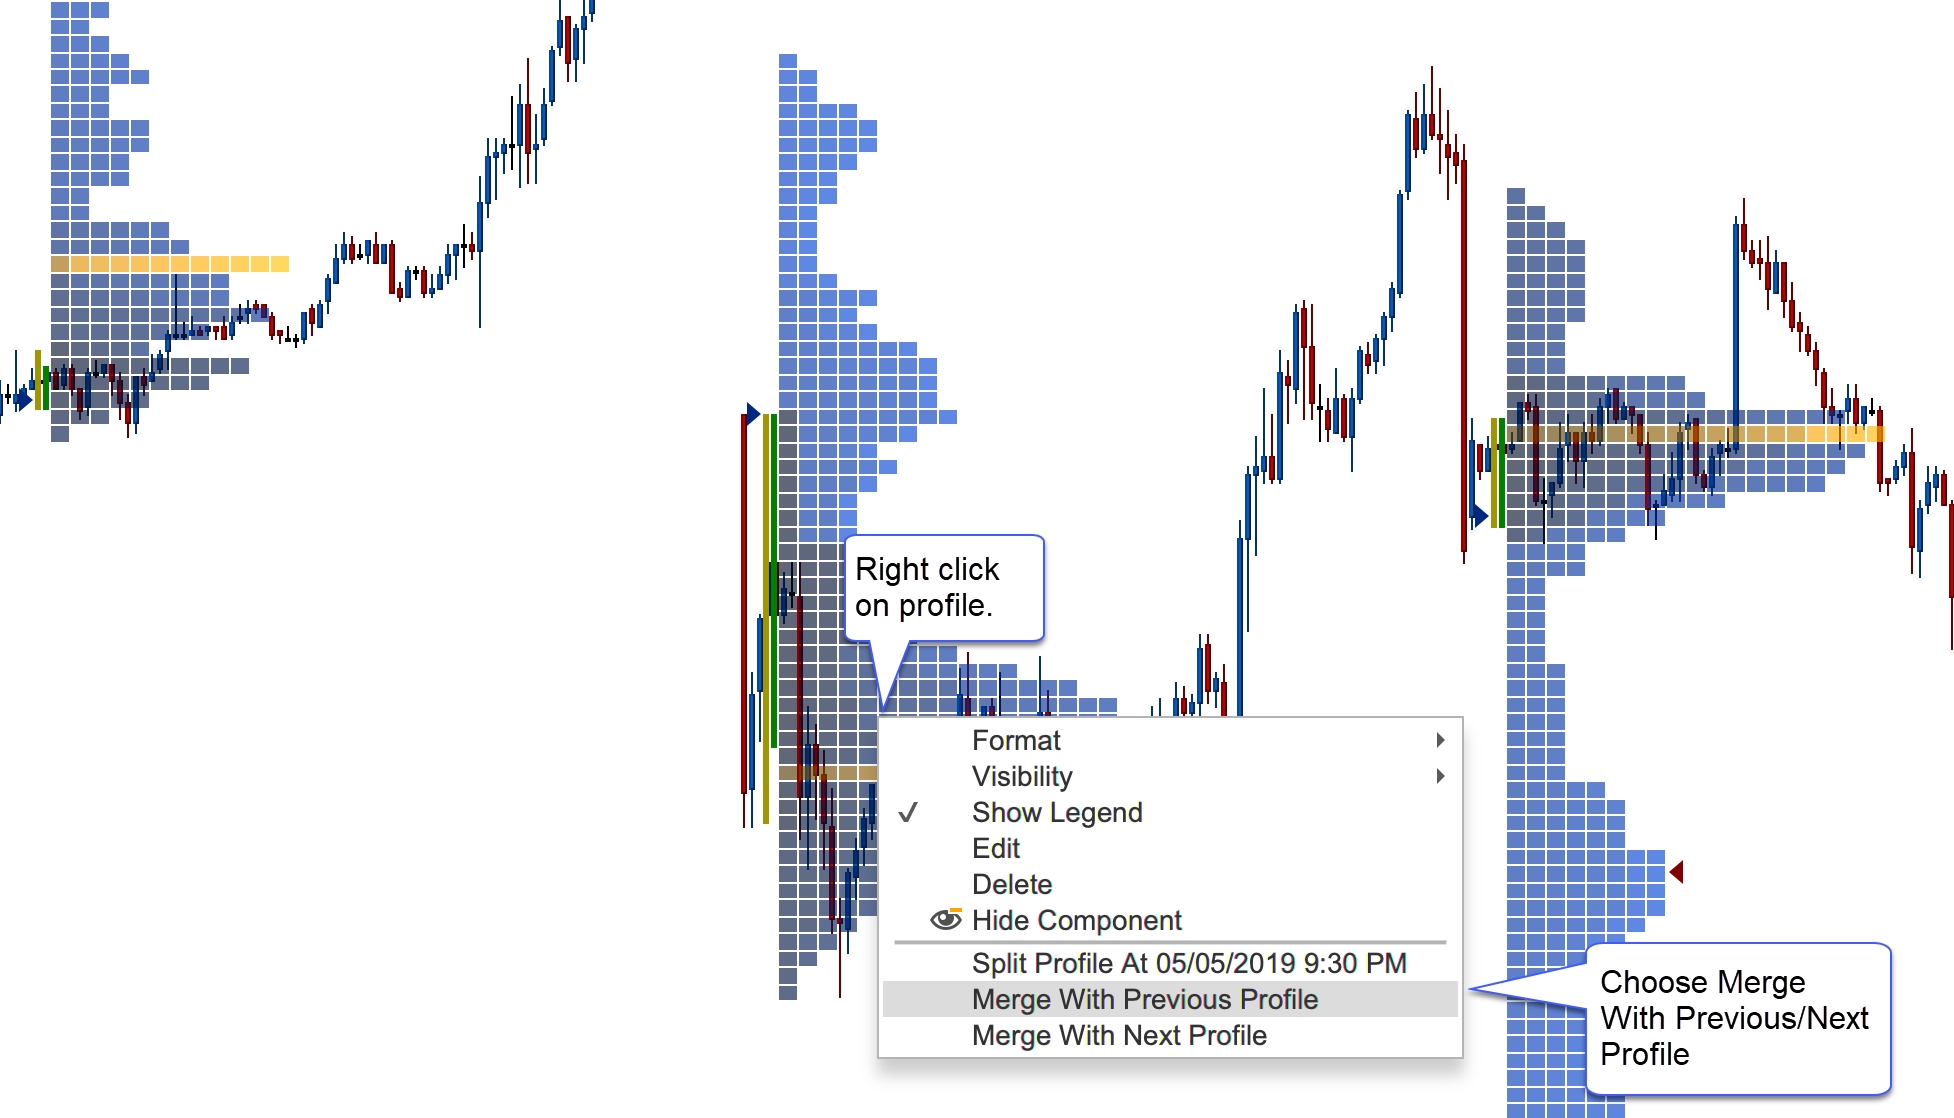
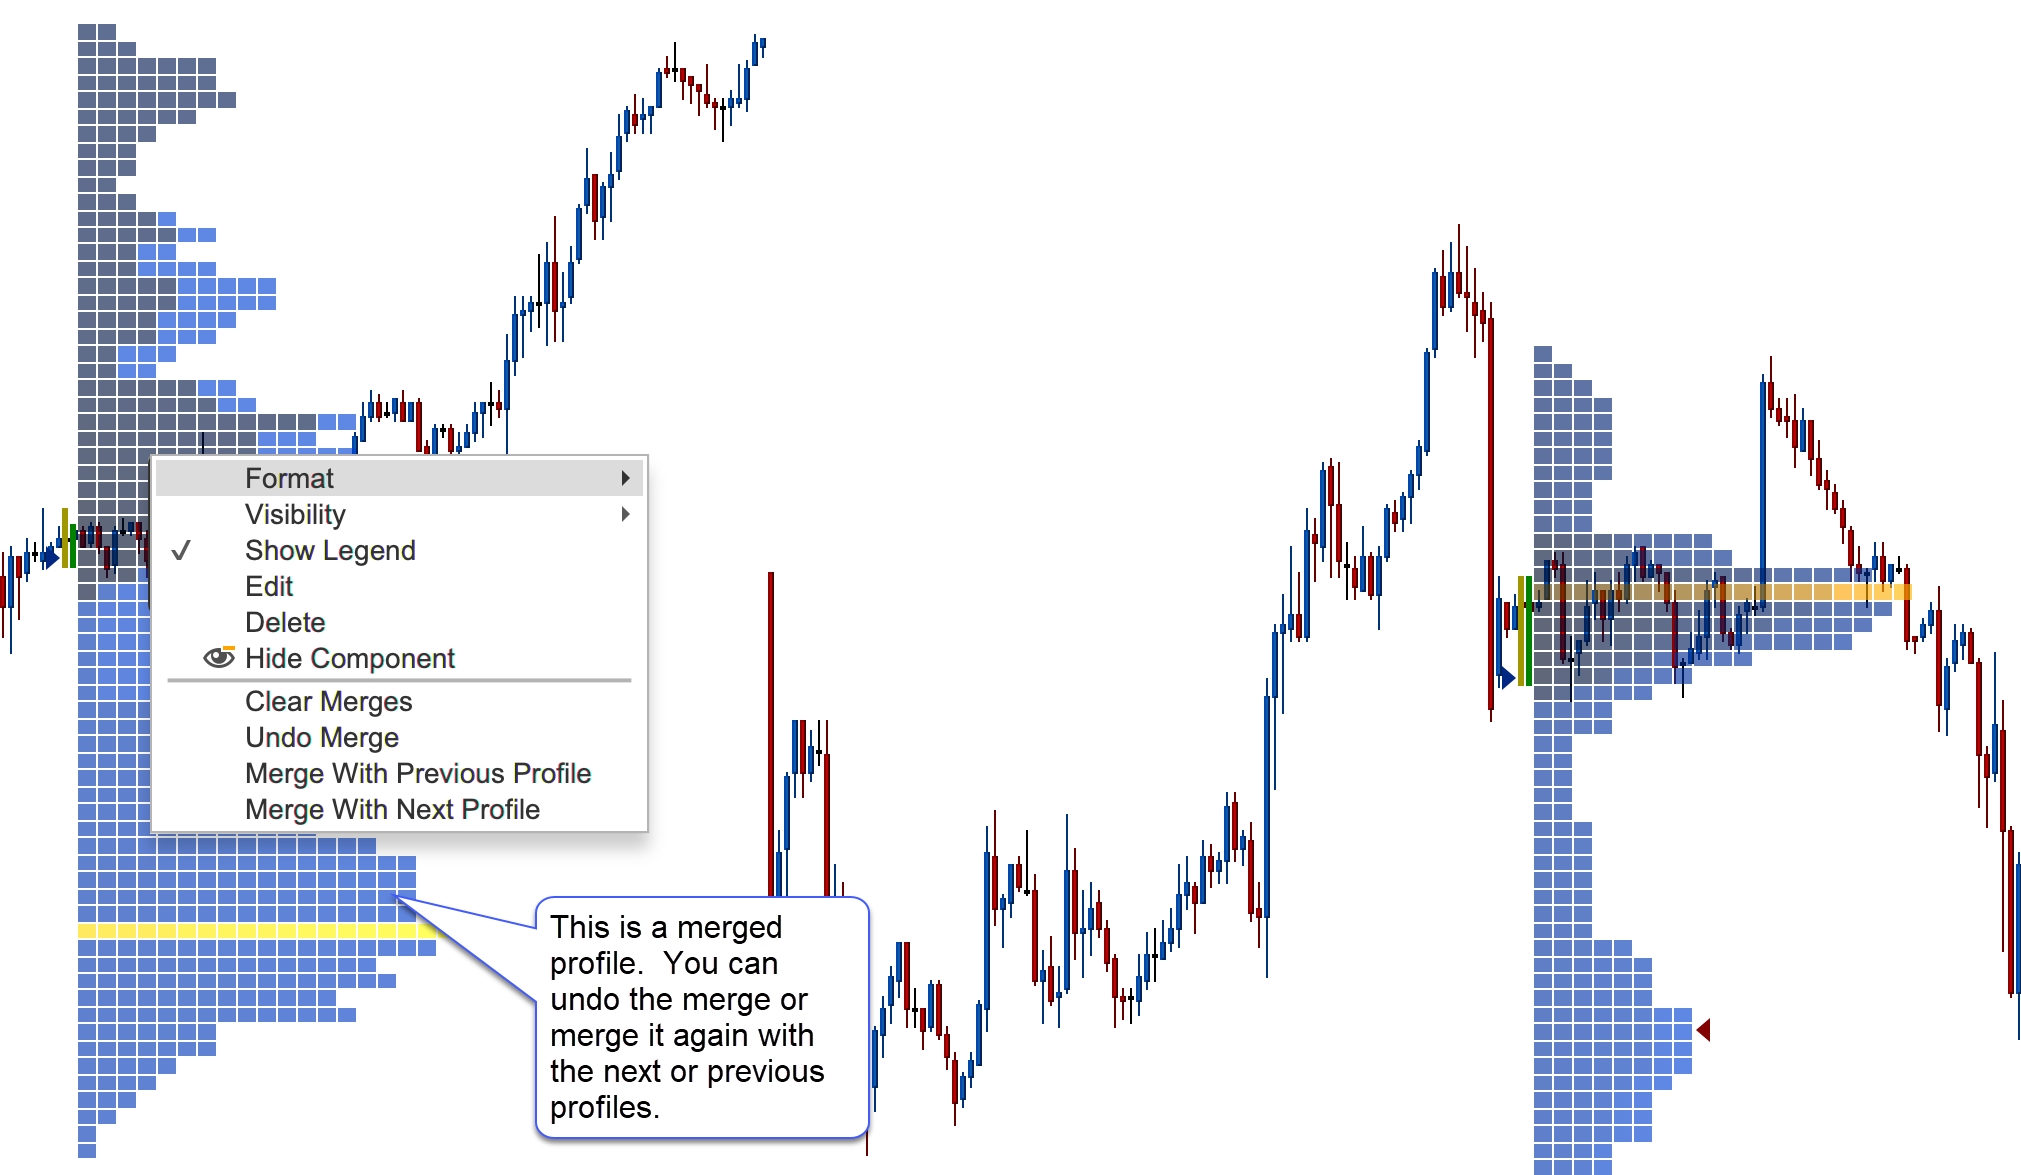
Profiles can be merged multiple times. You may also undo a merge (or all merges) from the context menu:
Split ETH/RTH
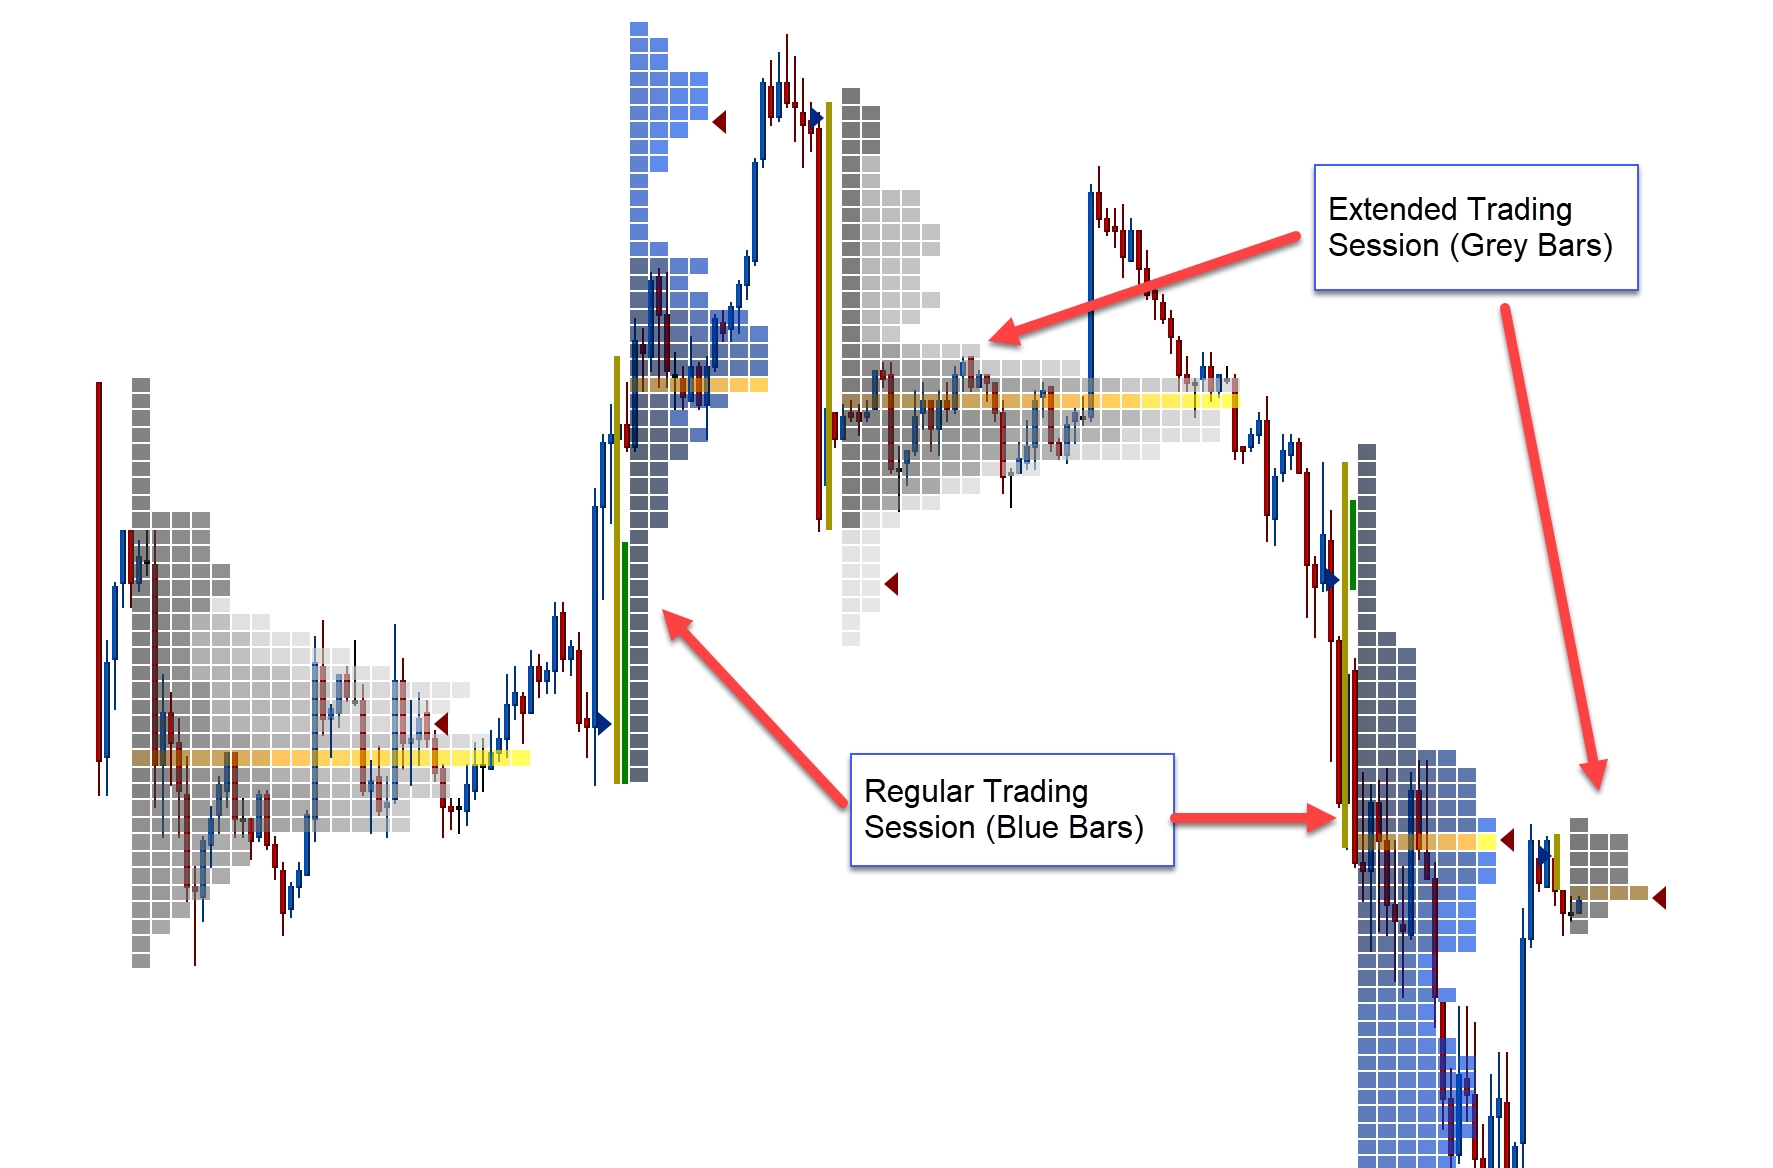
Daily TPOs can be split into two profiles where the first profile shows the regular trading session and the second shows the extended session. Note: this feature is only applicable to TPOs that have a 1-day timeframe.
This option can be found under the Display tab of the study dialog (double click on the study):
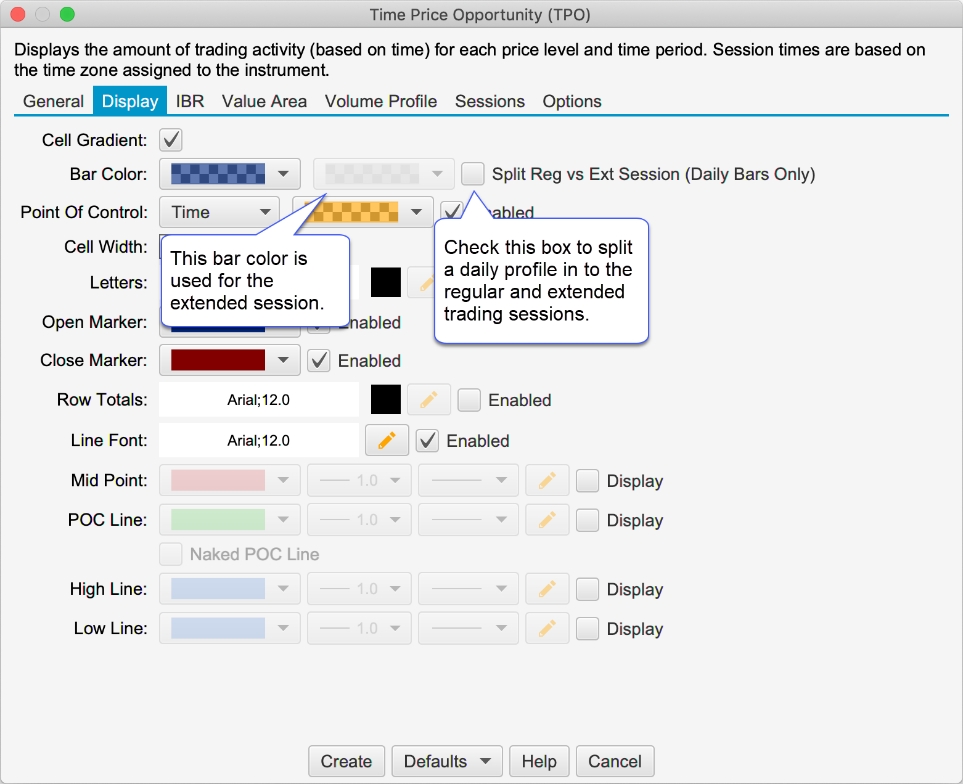
In the screen shot below, the regular trading session has the blue bars and the extended session has grey bars:
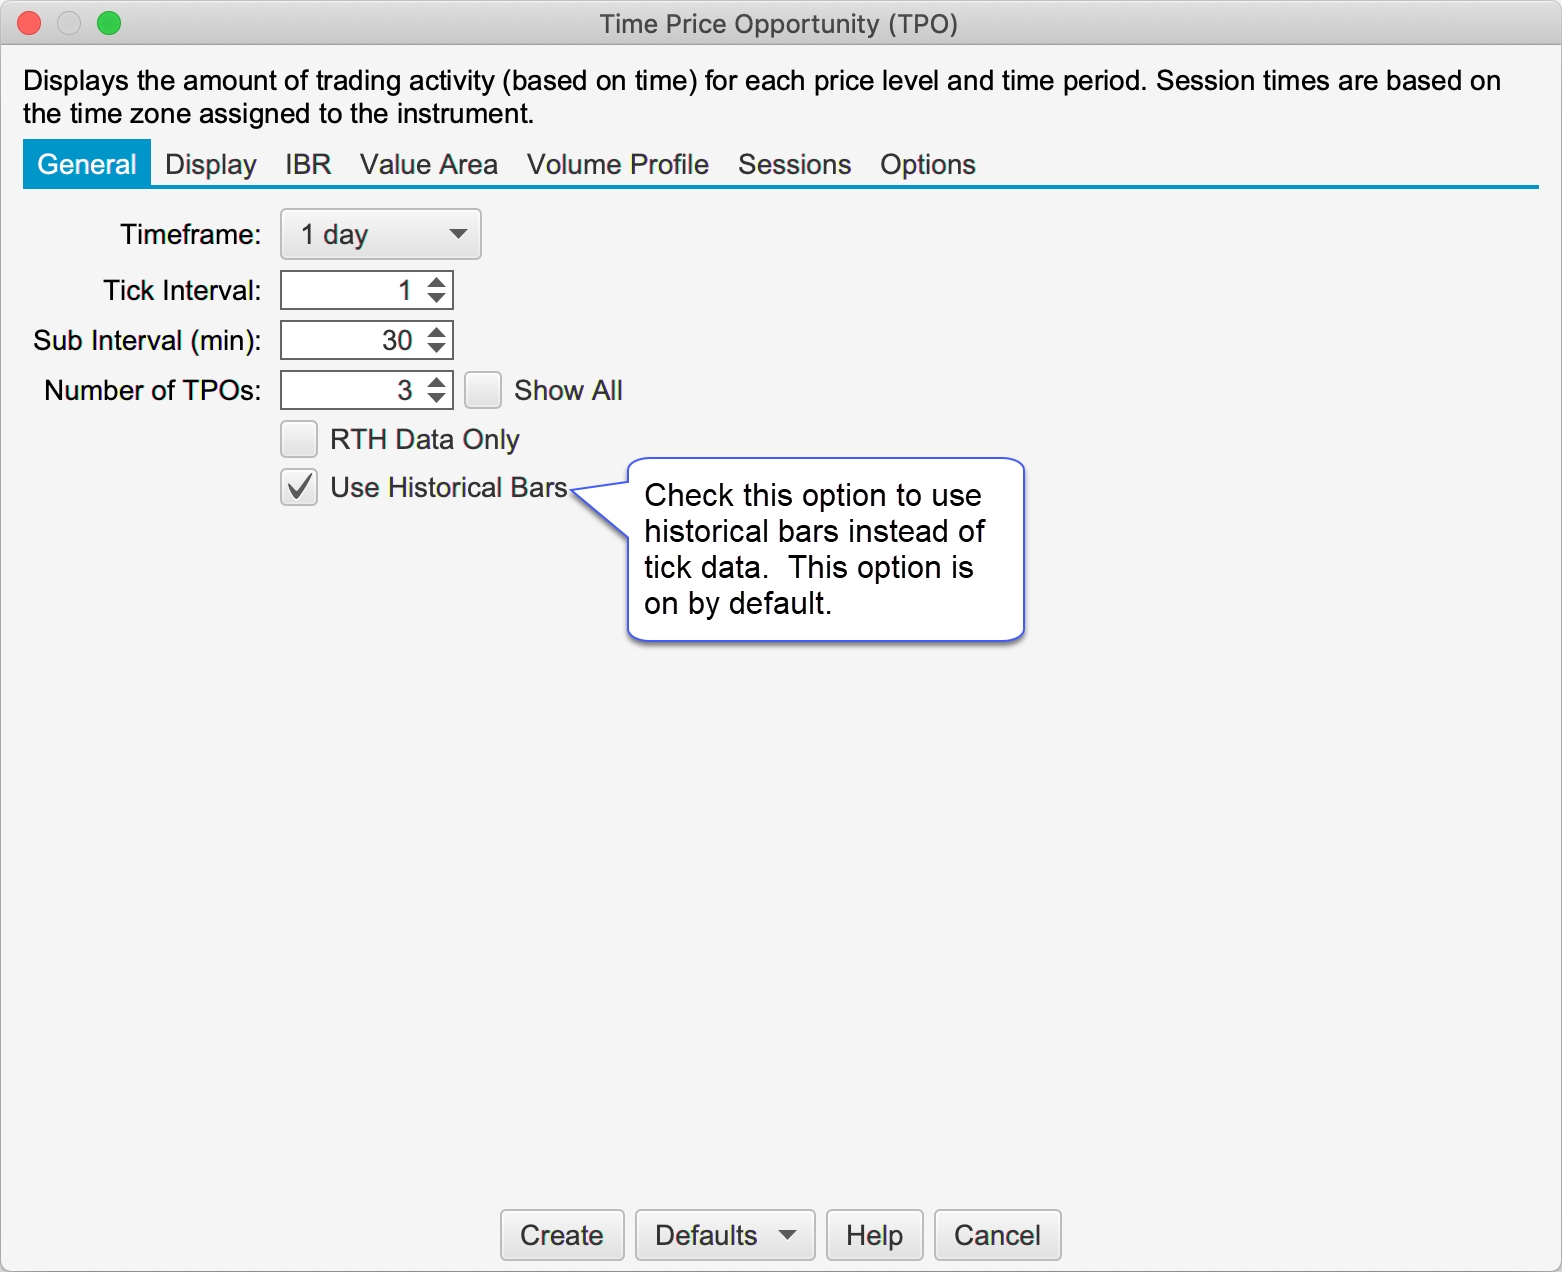
Historical Bars vs Tick Data
Optionally historical bars may be used instead of tick data (on by default). This significantly improves the loading time for the study and provides a greater range of data (at the expense of accuracy).
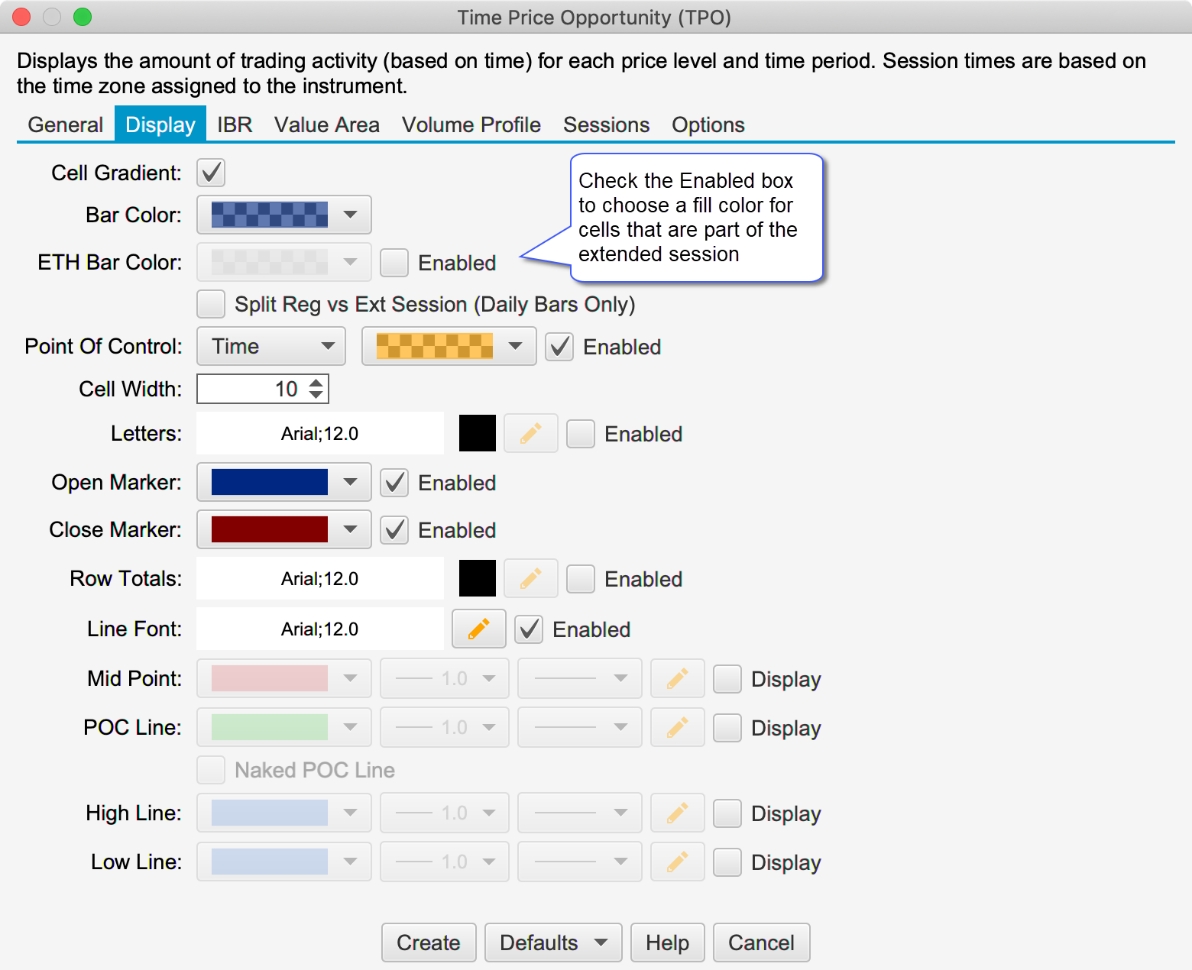
Background Cell Color
An additional option has been added to the TPO study to change the background color for cells that are part of the extended session (see screen shot below).
Font Color
Added a Font/Font Color option for letters displayed in the ETH session (see Display tab -> Letters ETH).
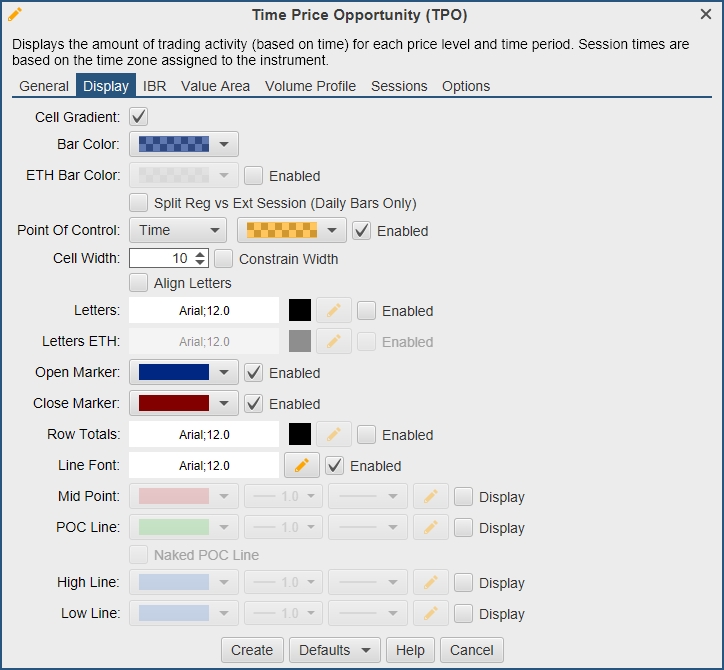
Constrain Width
If this option is checked it will automatically reduce the cell width if the profile overlaps the next profile.
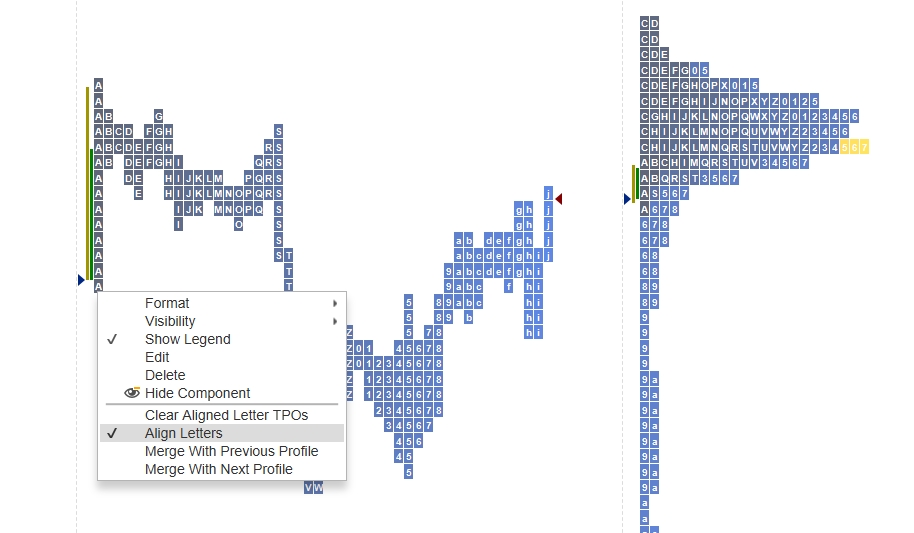
Align Letters in Same Column
This option (see Display tab, Align Letters in Same Column check box) will place each letter in a separate column to better represent the time when that cell occurred.
Volume Imprint Study
Multiple Columns
Two columns may be displayed for each Volume Imprint bar. This can be configured from the General tab of the study dialog:
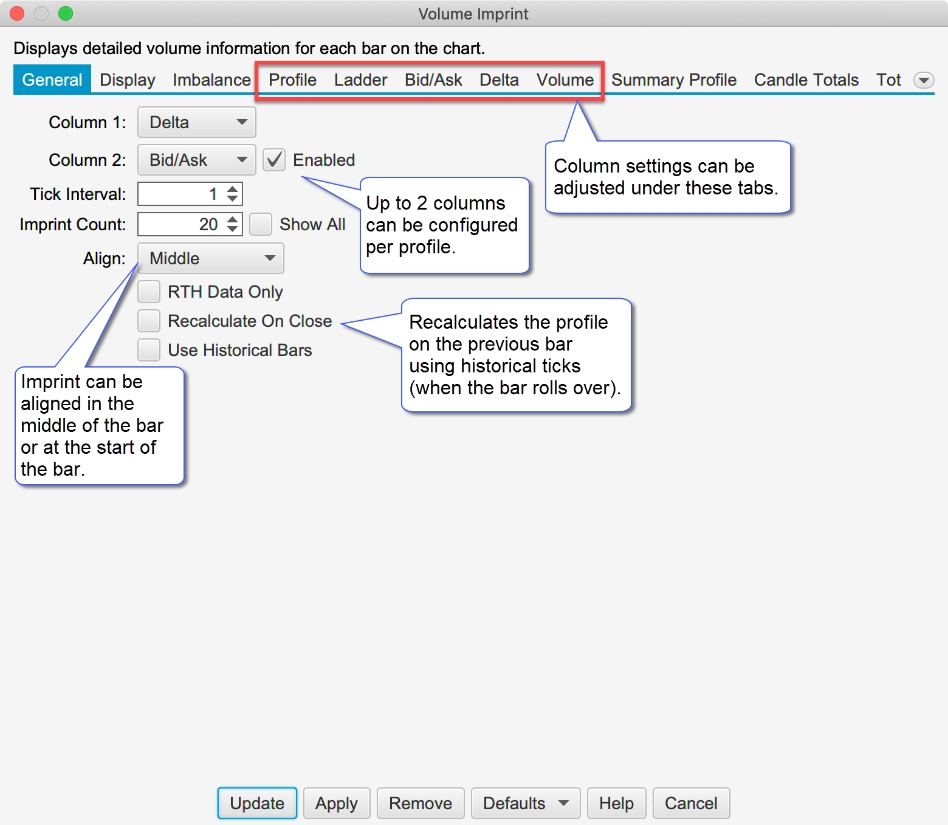
Settings can be tailored for each column under the Profile, Ladder, Bid/Ask, Delta and Volume tabs.
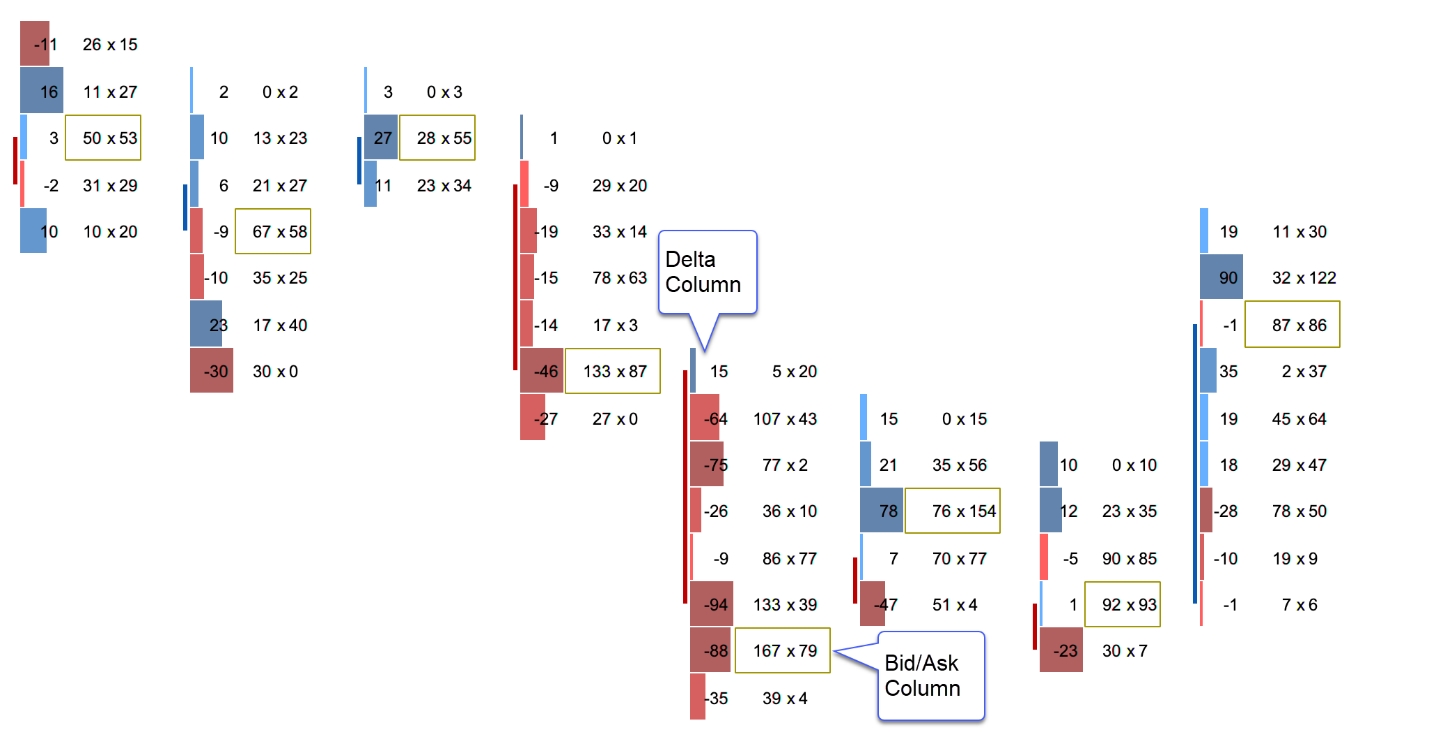
The following screen shot shows a Volume Imprint study with Delta and Bid/Ask columns:
Shading Levels
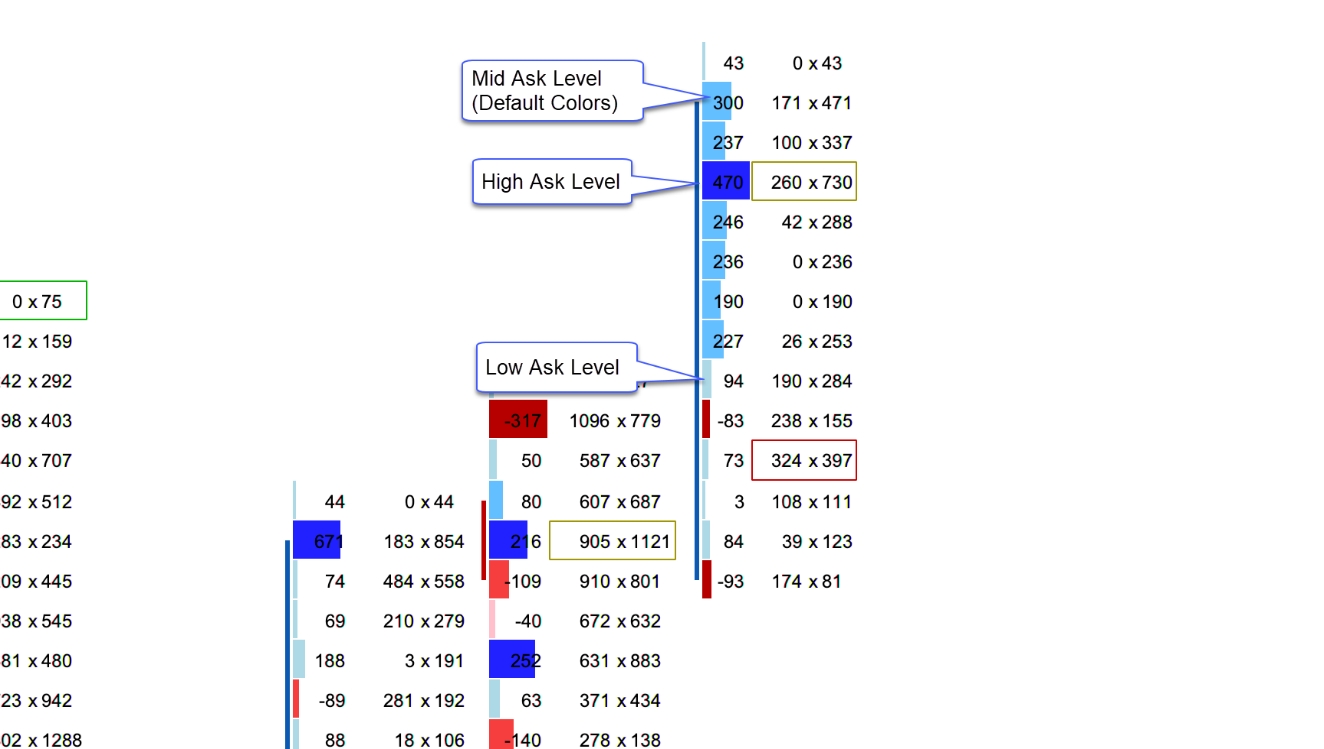
Shading levels may be customized based on a percentage of the highest value. This can make is easier to spot high or low values. If levels are not used (uncheck Use Levels), then the shading uses a gradient based off the bid/ask colors (see below).
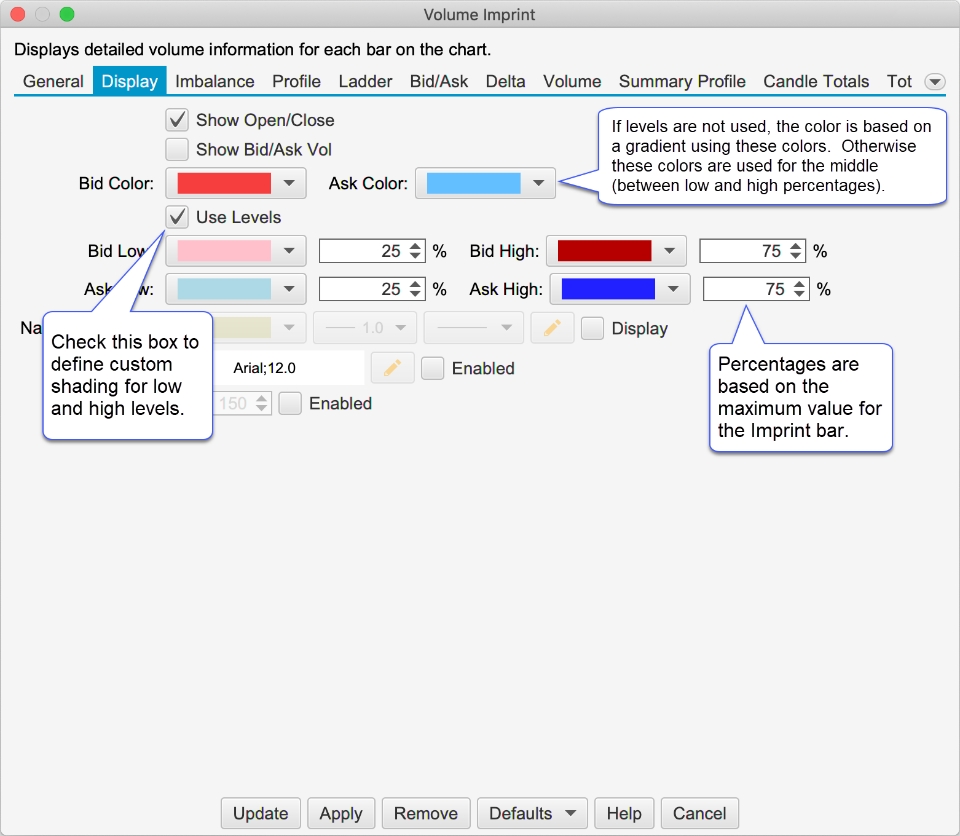
In the screen shot below, you can see the custom shading levels defined in the dialog box above.
Profile
Several enhancements have been made to the profile column (see Profile tab in the Study Dialog):
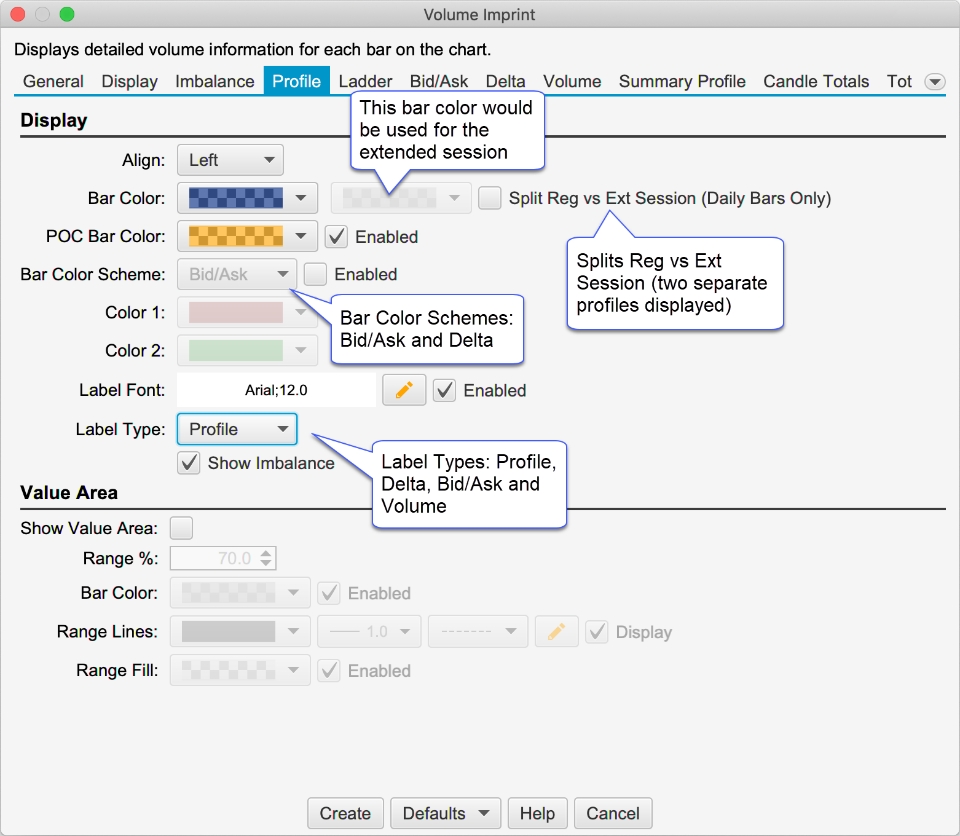
Split Reg vs Extended Session – Splits the regular and extended trading session (daily bars only)
Bar Color Scheme – Optionally show Bid/Ask volume or Delta.
Label Type – This option will change the label displayed on each profile bar. Available options include (Note: this option is also available on Bid/Ask, Delta and Volume columns):
Profile – Displays the volume
Delta – Displays the delta value (Ask Volume – Bid Volume
Bid/Ask – Displays the Bid and Ask volume (same as Bid/Ask type)
Volume – Displays volume (using imbalance coloring)
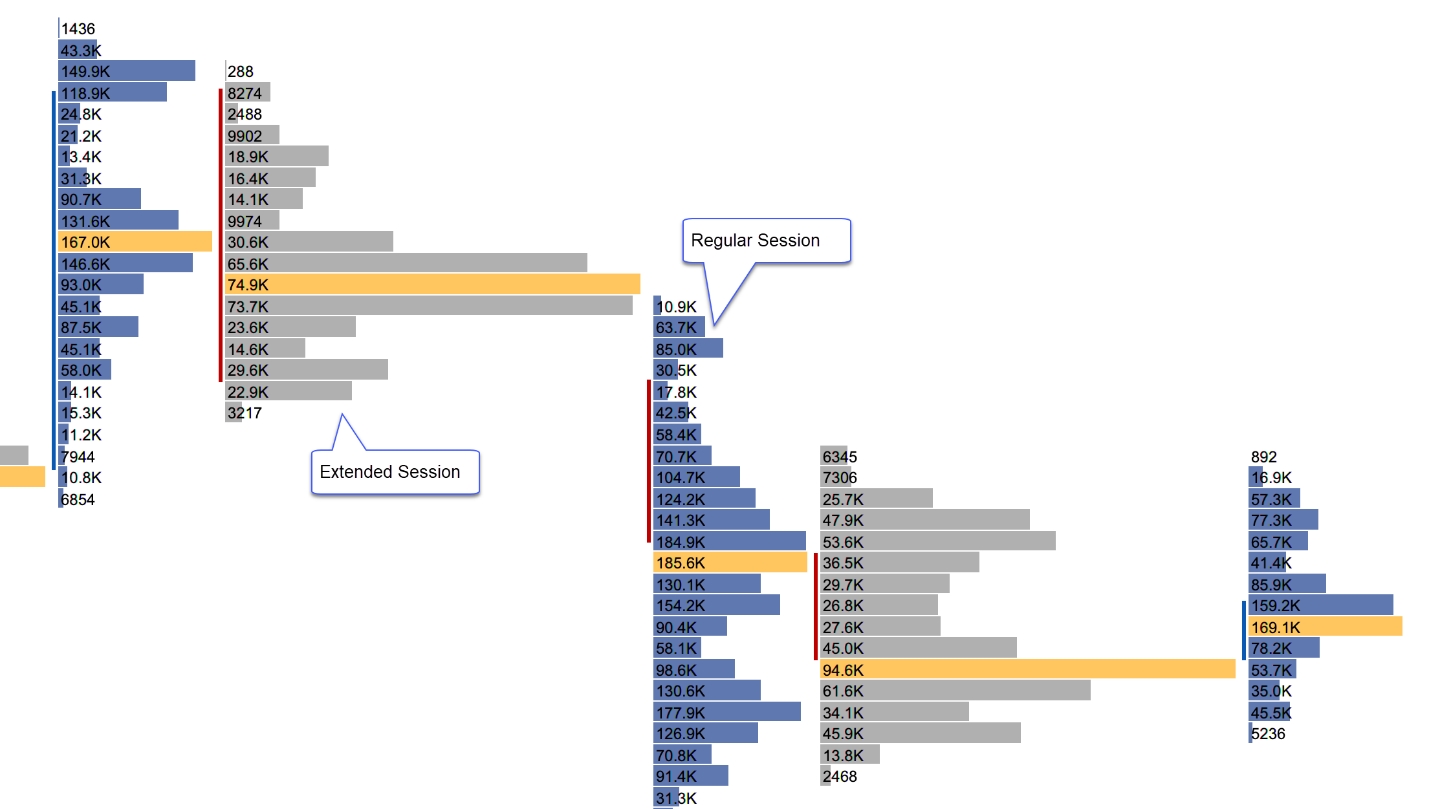
The screen shot below shows the profile split into Reg vs Extended session. Extended session bars are shown in grey:
Totals
The following options have been added to the Totals tab of the study dialog:
Show Cum Delta – Displays daily cumulative delta
Shading Levels – Similar to the shading levels for the candle, this applies shading to the totals section at the bottom of the chart.
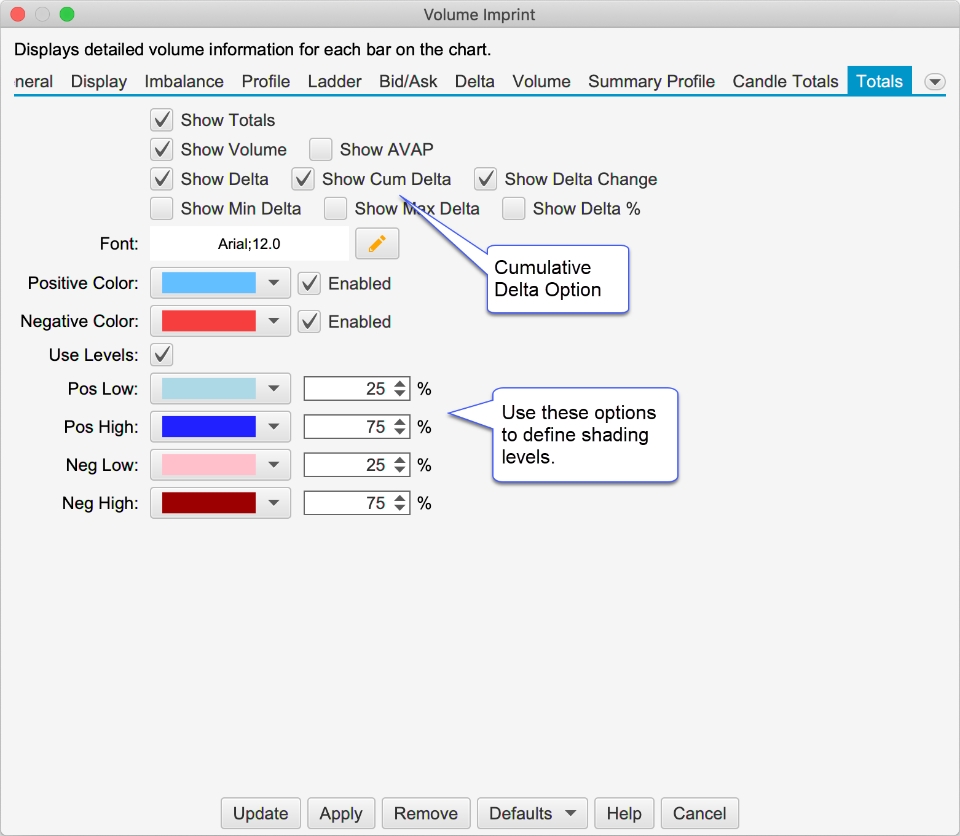
The screen shot below shows the totals at the bottom of the chart as configured in the dialog above:

Delta Summary Profile
Delta has been added as an option for the summary profile:
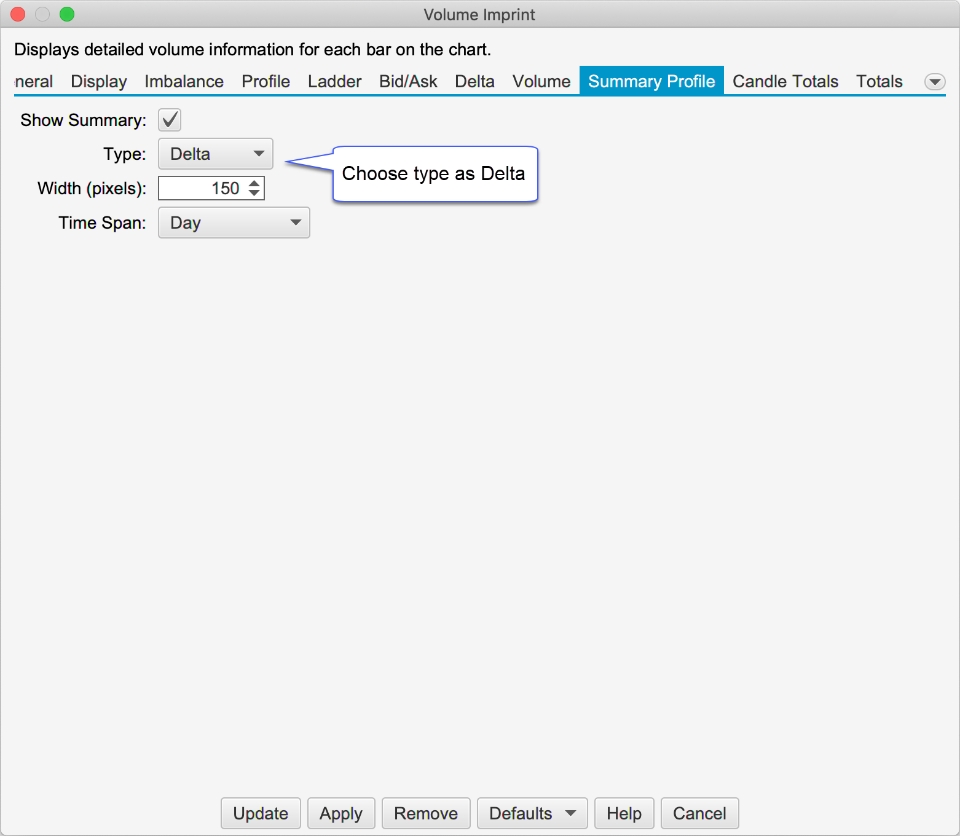
The screen shot below shows the Delta Summary profile on the right hand side of the chart:
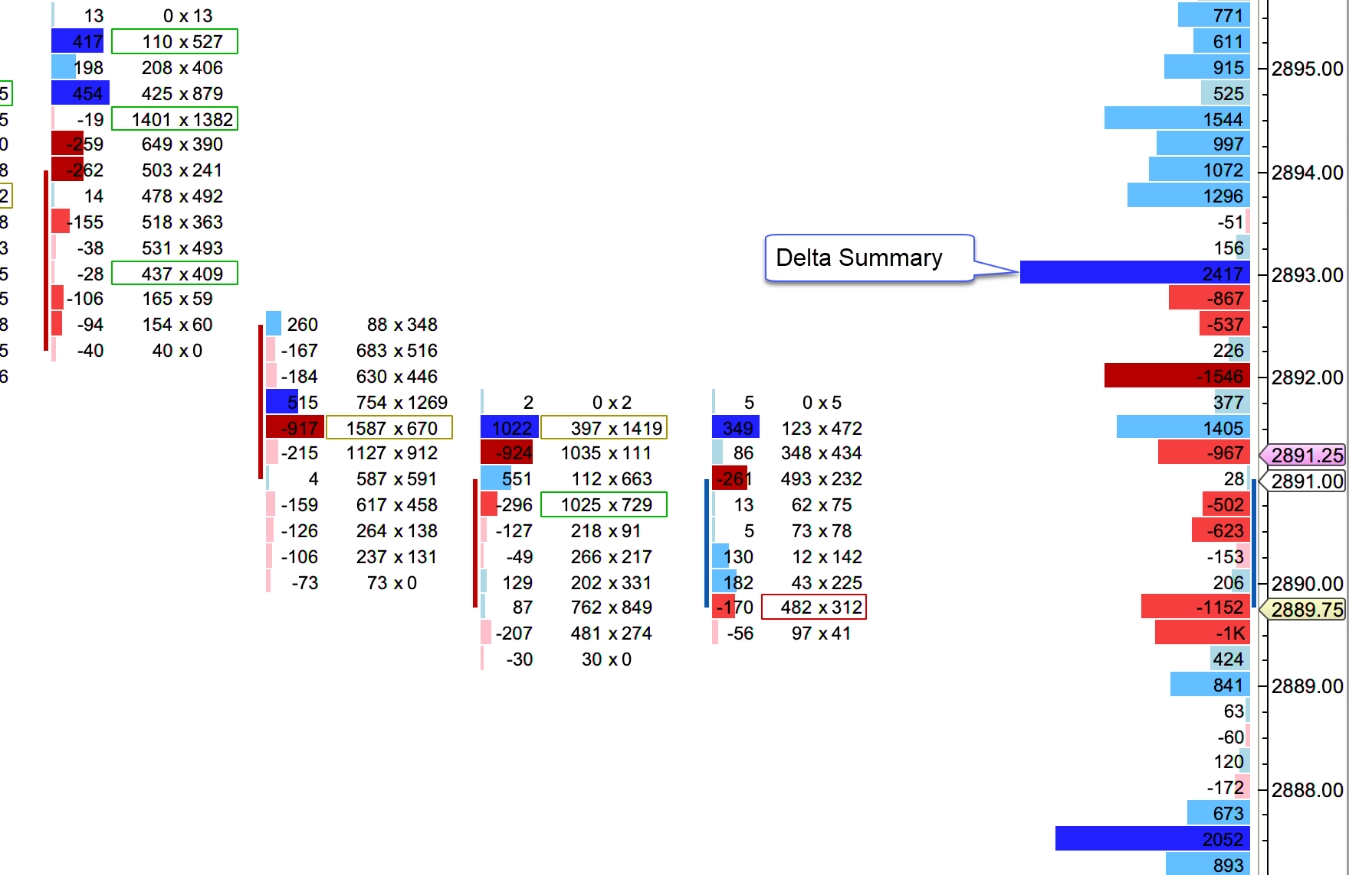
Disable Column 1
Added the option to disable Column 1. This will effectively hide the imprints, but allow you to show the imprints totals section at the bottom of the chart.
Font Colors
Added options to change the color for labels in the Volume Profile, Bid/Ask, Ladder, Volume, Delta and Totals.
Summary Profile Totals
Added the option to toggle the display of totals in the Summary Profile (see Summary Profile tab -> Show Totals).
DOM History
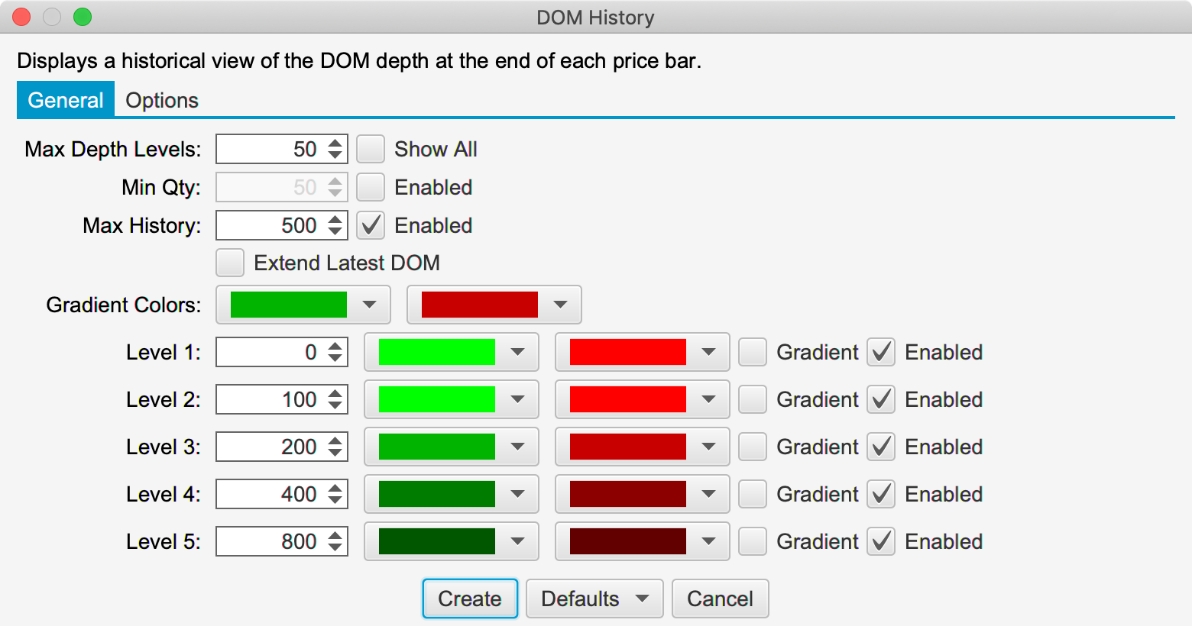
Significant enhancements have been added to the DOM History study to improve the performance and add more coloring options. This dialog has the following options:
Max Depth Levels – Maximum number of levels to display for history (default 50). This is mostly relevant for Rithmic™ (which supports unlimited depth levels) but will apply to future brokers/data services that provide more than 10 levels of depth.
Min Qty – Minimum quantity for displaying a depth level.
Max History – Maximum number of bars for displaying the history
Extend Latest DOM – Extends the latest DOM levels to the end of the chart.
Gradient Colors – This field is the same as in previous versions of MotiveWave, but is also the default colors to use if none of the color levels apply (see below)
Level 1 – 5 – These fields allow you to customize how the DOM history is colored for specify quantity ranges. If none of these levels apply, then the default Gradient Colors are used.
Big Trades Study
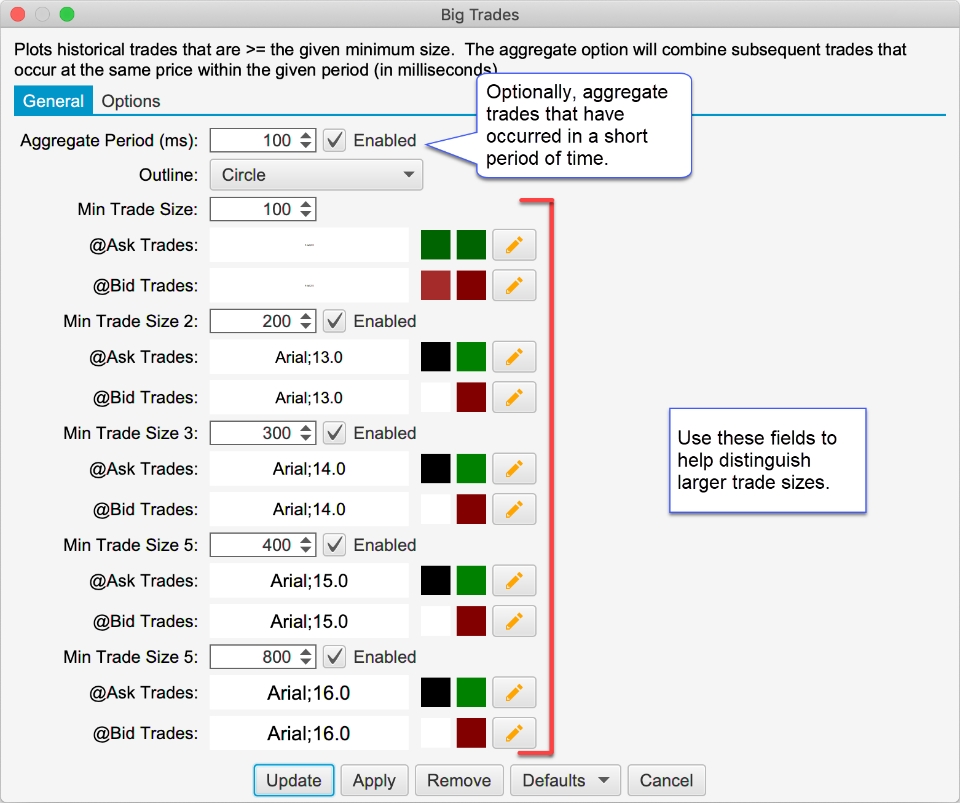
This new study shows historical trades on the chart. These are computed using historical tick data. This study has the following options:
Aggregate Period (ms) – Optionally aggregates trades that have occurred within the aggregate period (milliseconds). These trades must occur at the same price and the @Ask flag must be the same.
Outline – Options include:
Circle (default)
Rectangle
Rounded Rectangle
None (text only)
Min Trade Size – Up to 5 trade sizes can be defined to distinguish between smaller and larger trades. Use the Min Trade Size for each level to define the tiers.
@Ask Trades – These fields define the font, font color and background color for trades that occurred at the ask price. The size of the trade can be modified by changing the size of the font. Text can be hidden by choosing the same font color as the background color.
@Bid Trades – Same as @Ask trades, but applies to trades that occurred at the bid price.
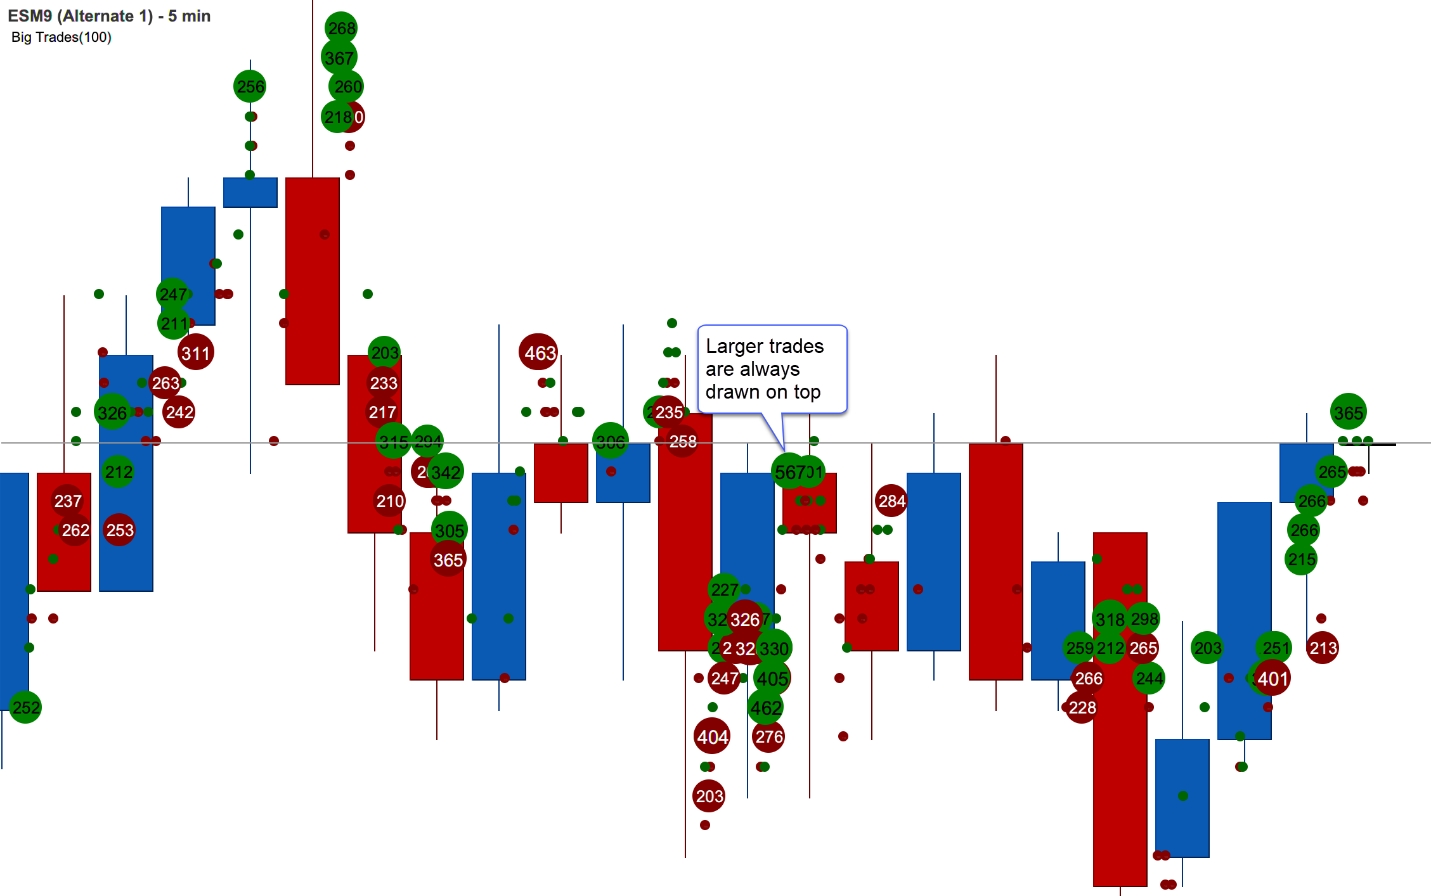
The screen shot below shows the Big Trades study with the settings from above. For convenience larger trades are drawn on top (potentially hiding smaller trades underneath). The following limitations are imposed to avoid performance issues with the study:
Max 25000 Trades – The study will only compute a maximum of 25000 trades that meet the given criteria
Max 500 Visible – A maximum of 500 trades will be drawn on the chart at one time.
OHLC Study
This new study plots the daily (ETH or RTH) information for the following: Note: this study only works on intraday bars.
Open – Opening price for the day
High – High price for the day
Low – Low price for the day
Prev Close – Close for the previous day
Mid – Midpoint between the high and low
Prev Low – Low price for the previous day
Prev High – High price for the previous day
Range (min) – Time range for computing the Range High/Low lines. The time starts at the opening time for the day (regular trading hours)
Range High – High value for the range defined above
Range Low – Low value for the range defined above
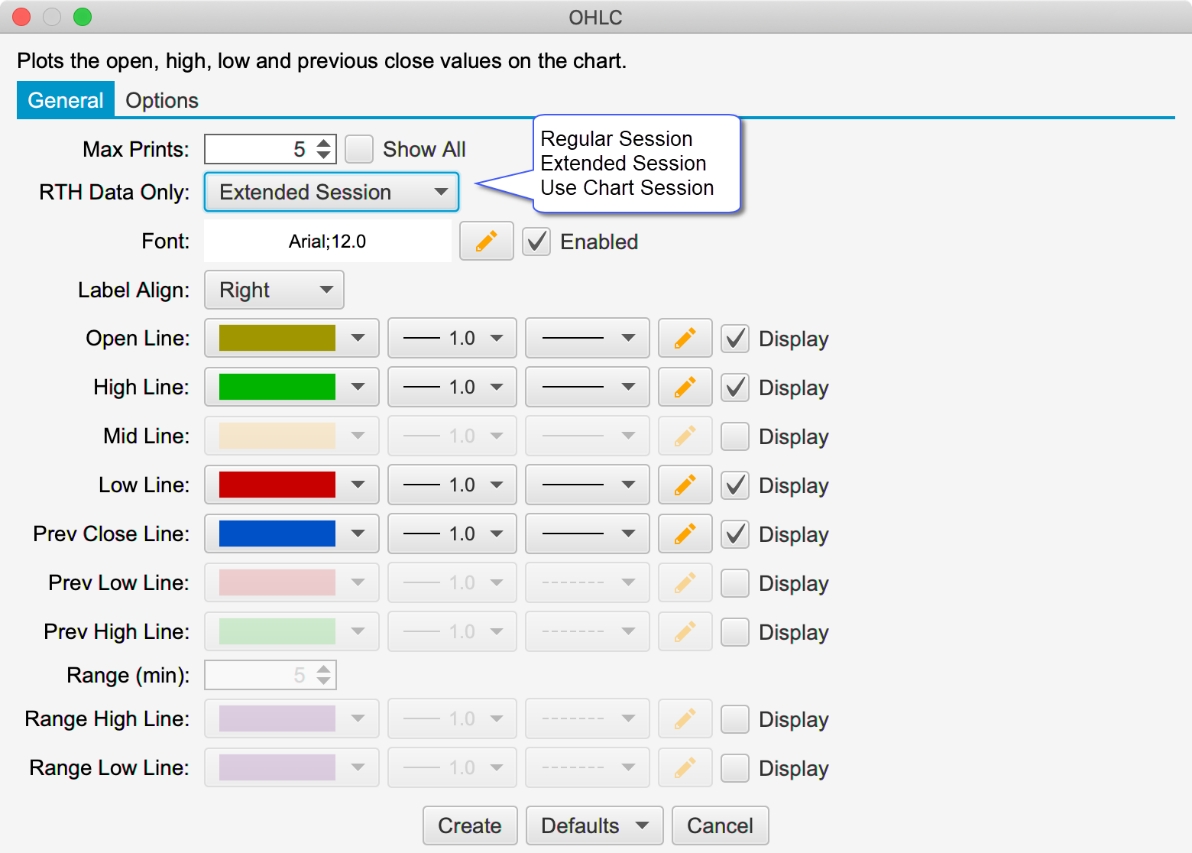
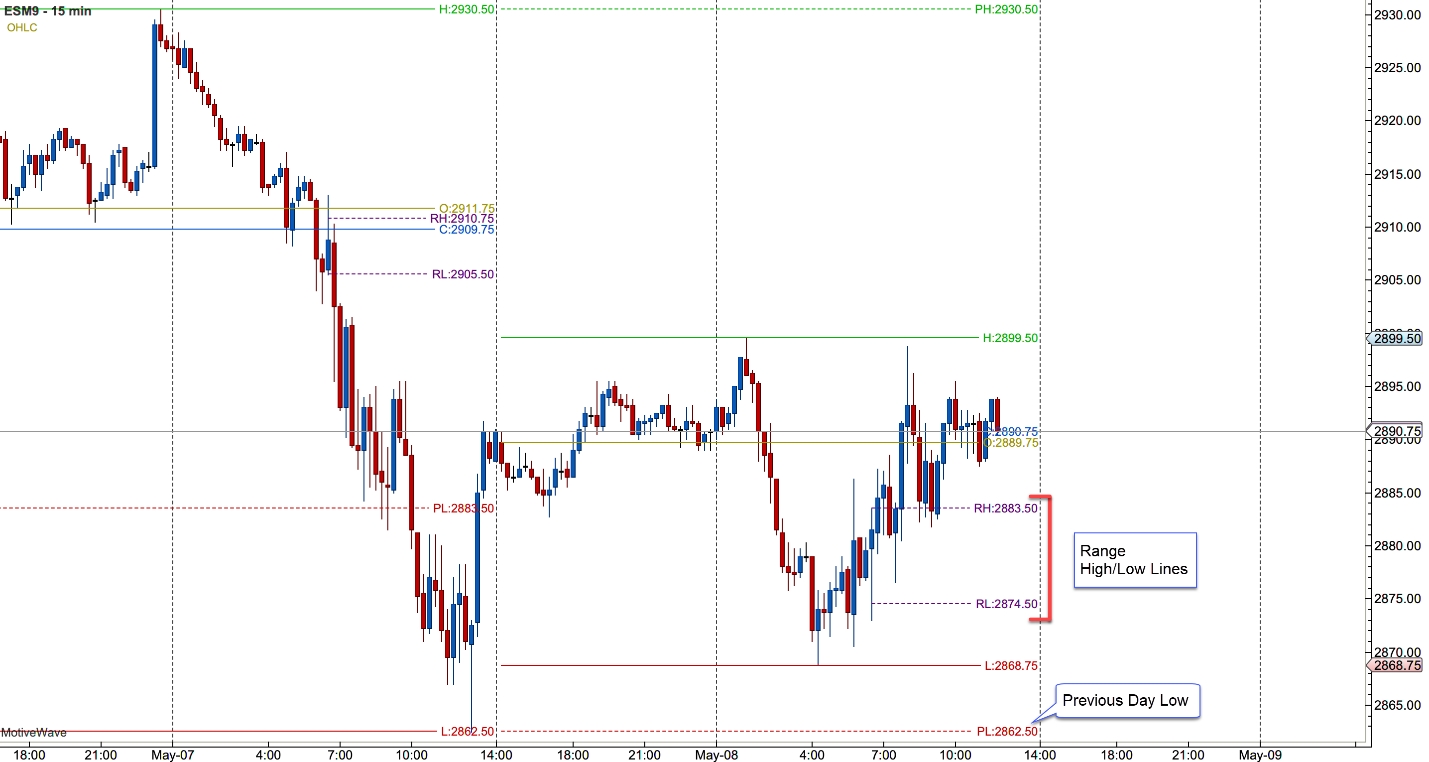
The screen shot below shows the study using the settings in the dialog above:
Volume Profile Study
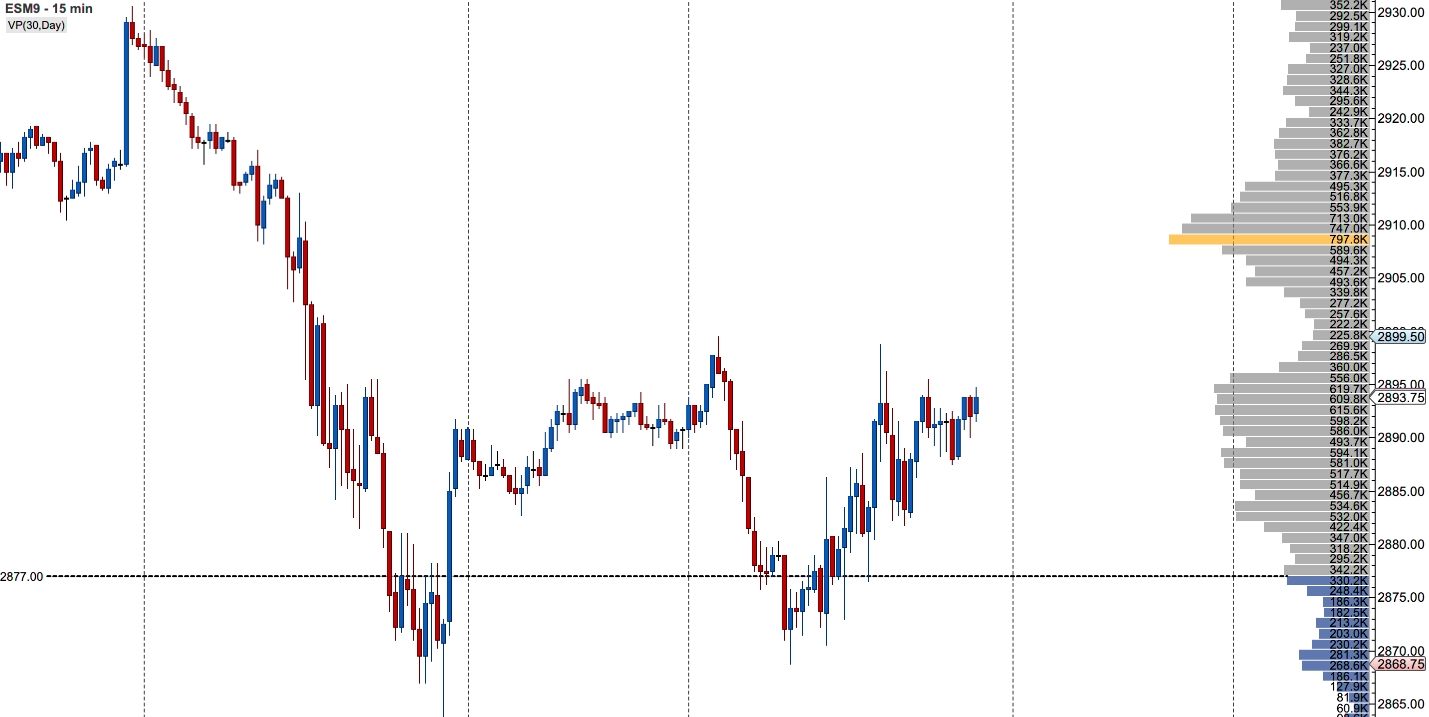
The existing Volume Profile study has been rewritten in this update to use tick data and define a time range. The purpose of this study is to display a summary volume profile on the left or right side of the chart over an extended period of time.
General Tab
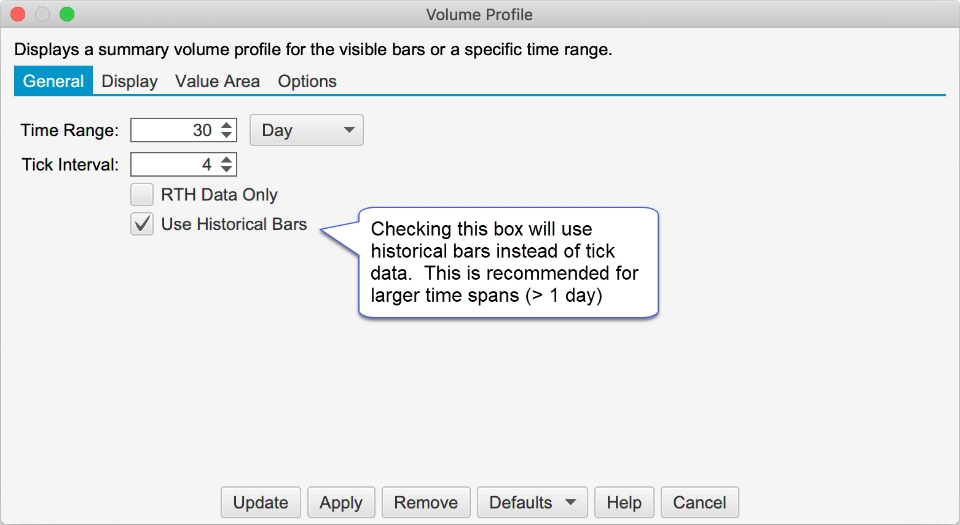
The following options are available on the General tab:
Time Range – Specified the time range for the volume profile. The range will “roll over” when it hits the end of the range. For example, if “Day” is chosen, the time range will shift when the start of the next day is reached. Available options include:
Day
1 Min
5 Min
10 Min
15 Min
30 Min
45 Min
1 Hour
Tick Interval – number of ticks that make each bar in the profile
RTH Data – only uses regular trading hours data if checked
Use Historical Bars – Uses historical bars instead of tick data. This is recommended if the time range is larger (greater than 1 day) or tick data is limited from your broker/data service.
Display
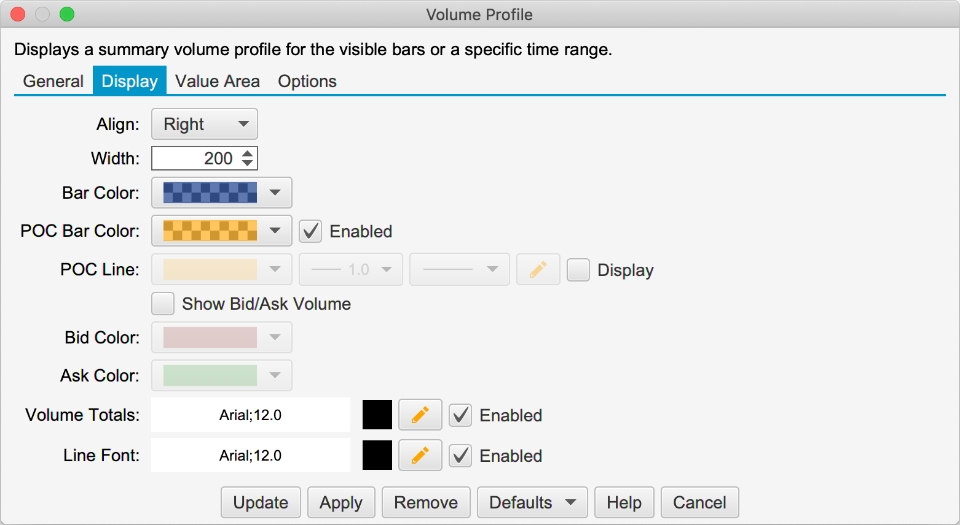
The following options are available in the Display tab:
Align – Displays the profile on the left- or right-hand side of the price graph
Width – Maximum width for the profile bars.
Bar Color – Default color for the bars (not displayed if Show Bid/Ask Volume is checked)
POC Bar Color – Bar color for the bar that is the Point of Control (bar with the highest volume)
POC Line – Optionally displays a line across the chart from the middle of the POC bar
Show Bid/Ask Volume – Separates the Bid/Ask volume in each profile bar using the Bid/Ask colors below
Bid Color – Color for the bid volume in the profile bar
Ask Color – Color for the ask volume in the profile bar
Volume Totals – Toggles the display of the volume totals for each bar and defines the font/font color
Line Font – Toggles the display of the prices for the horizontal lines. This applies to the POC line as well as the Range Lines (see Value Area tab).
Value Area
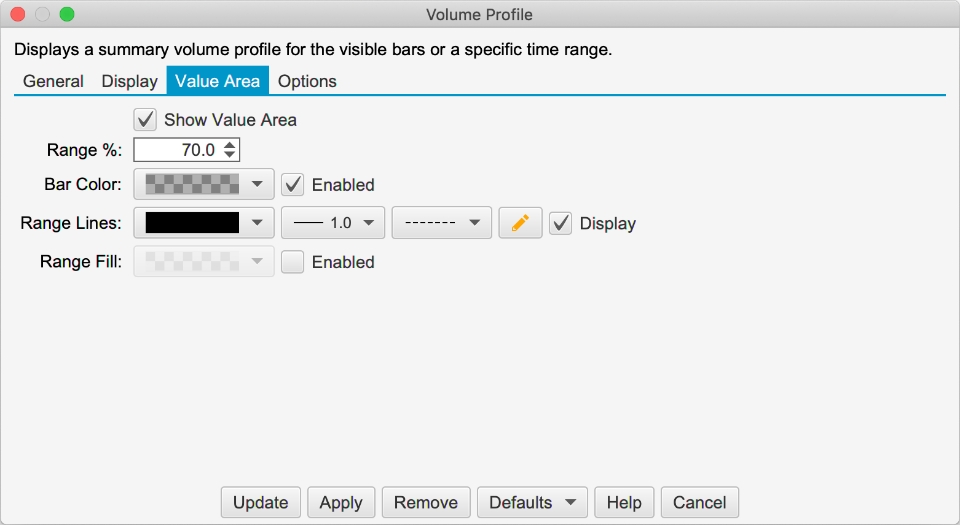
Use this tab to display the value area for the profile. It has the following options:
Show Value Area – Toggles the display of the Value Area
Range % - Defines the percentage for calculating the value area. For example, 70% will select the range of bars that encompass 70% of the volume for the profile. This range must include the Point of Control and includes the minimum number of bars.
Bar Color – Bar color for the bars that are included in the value area
Range Lines – Optionally displays horizontal lines at the top and bottom of the value area
Range Fill – Optionally draws the given fill color for the value area.
The following screen shot shows a 30 day volume profile displayed on the right side of the price graph:
VWAP Study
Tick Data
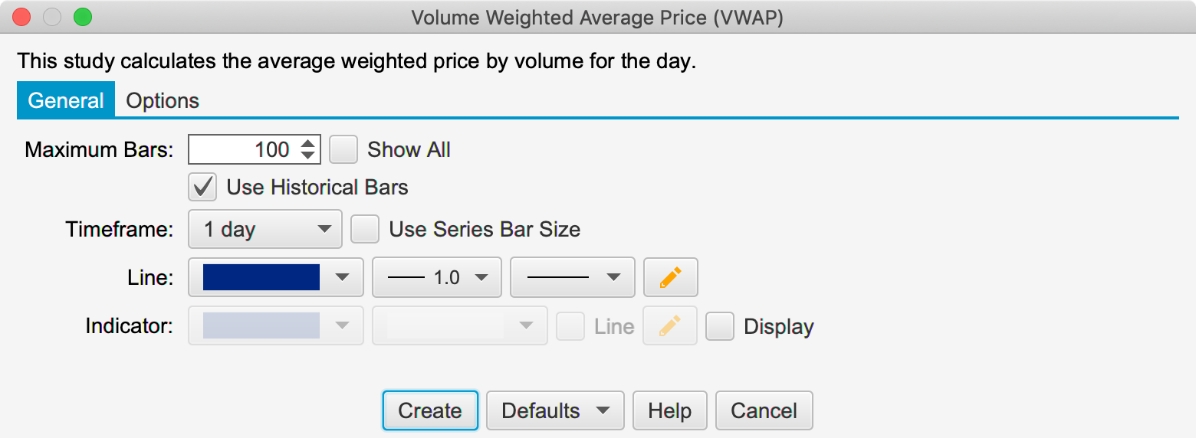
The VWAP (Volume Weighted Average Price) study has been re-written to use historical tick data (instead of bar data). Optionally, ticks can be generated from historical minute bars (see Use Historical Bars option below).
Standard Deviation Bands and Anchors
The following enhancements/changes have been added to the VWAP study:
Std Dev Calculation – The calculation for the standard deviation has changed. It is now calculating using the difference between the HLC3 – VWAP (instead of the VWAP alone)
Std Dev Bands – Up to 3 band lines can be configured
Anchored VWAP – The starting point can be set for calculating the VWAP via right click (see menu options below):
Remove Anchor – This option will remove a previously set anchor
Anchor VWAP at <Time> - This will set the anchor at the given time.
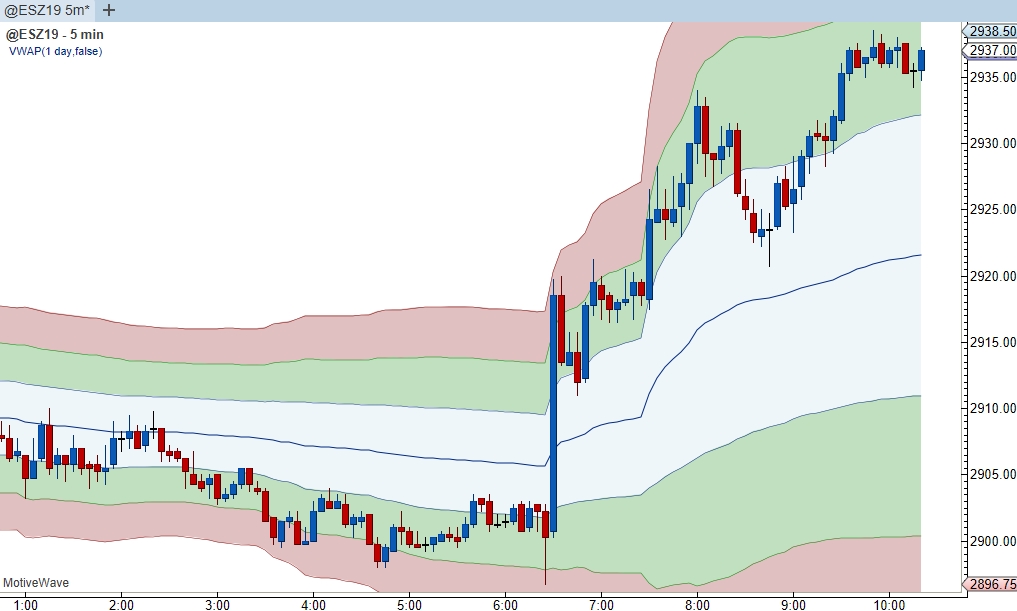
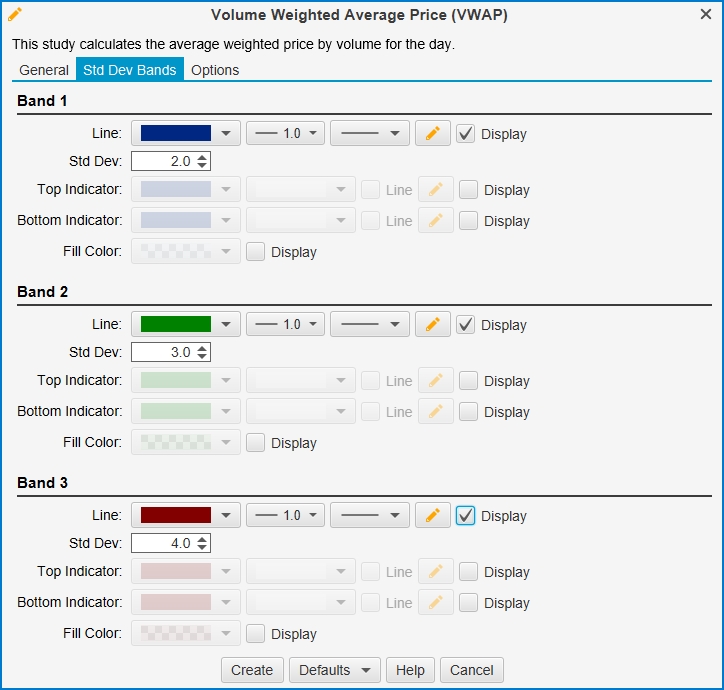
Relative Volume Study
This new study compares the volume on the current bar to the average volume for that same bar (same time of day) for the given period (see Study -> Volume -> Relative Volume).
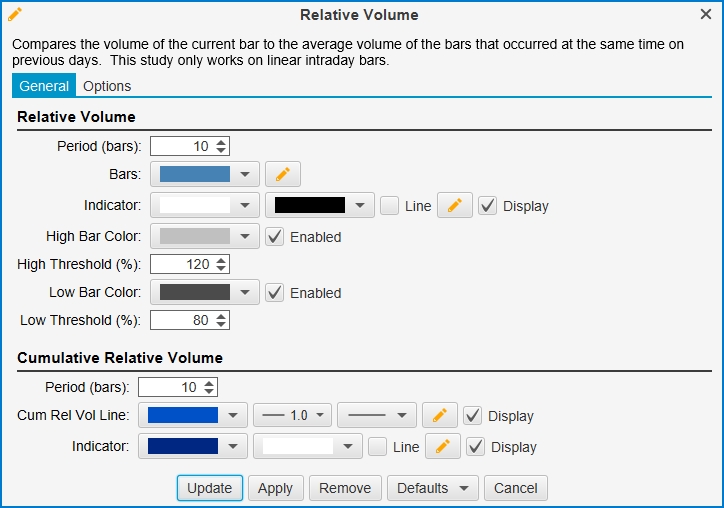

Pivot Points Study
Standard pivots have been added to the Pivot Points study. This uses the following calculation:
Pivot Point (P) = (High + Low + Close)/3
Resistance 1 (R1) = (P x 2) – Low
Resistance 2 (R2) = P + (High – Low)
Support 1 (S1) = (P x 2) – High
Support 2 (S2) = P – (High – Low)
The standard option can be found in the Pivot Type drop down:
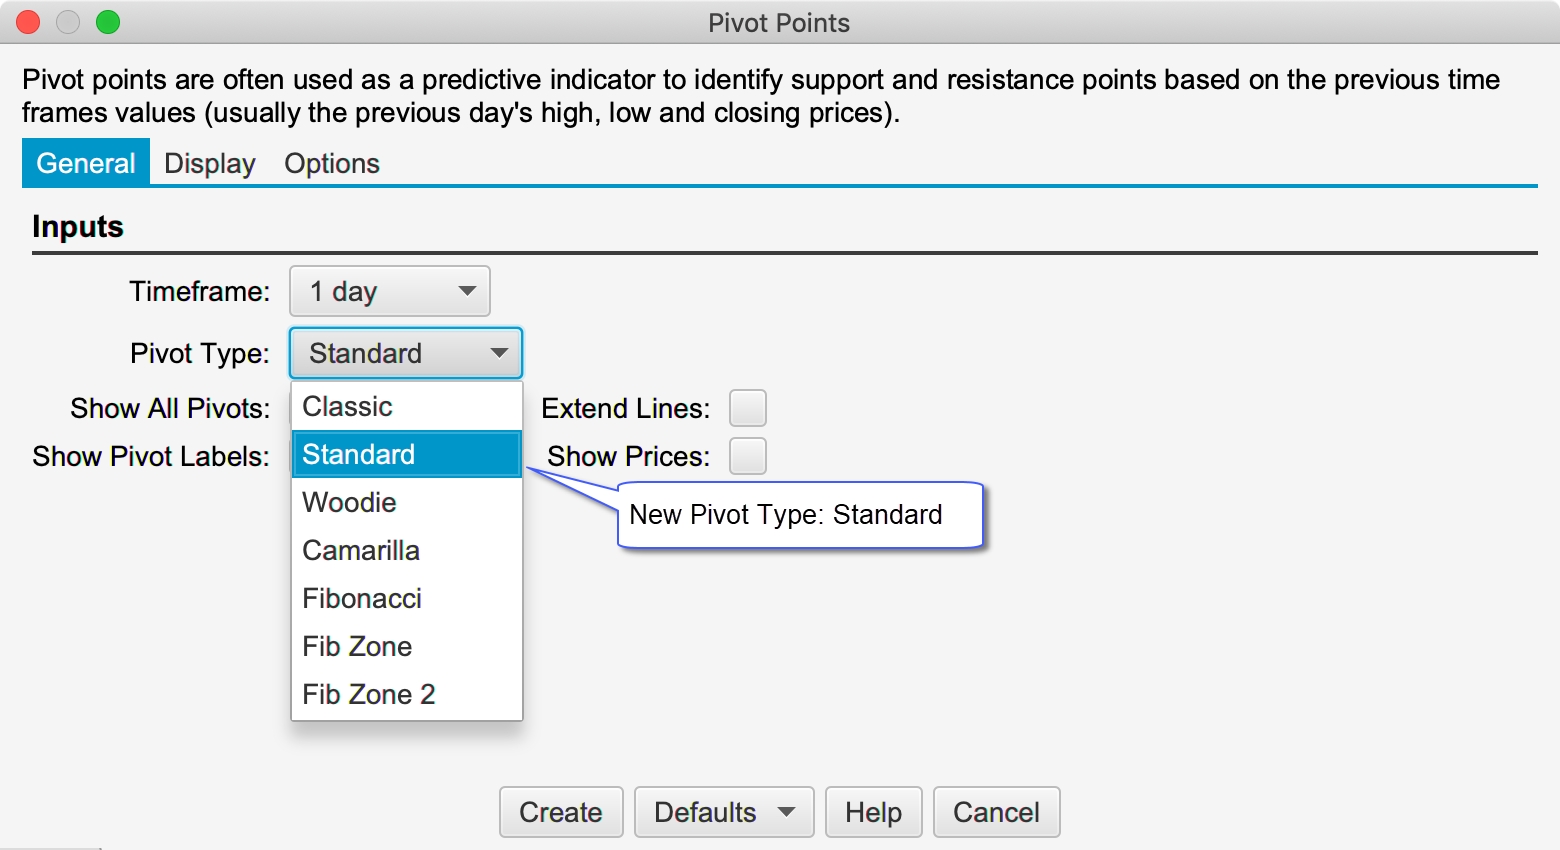
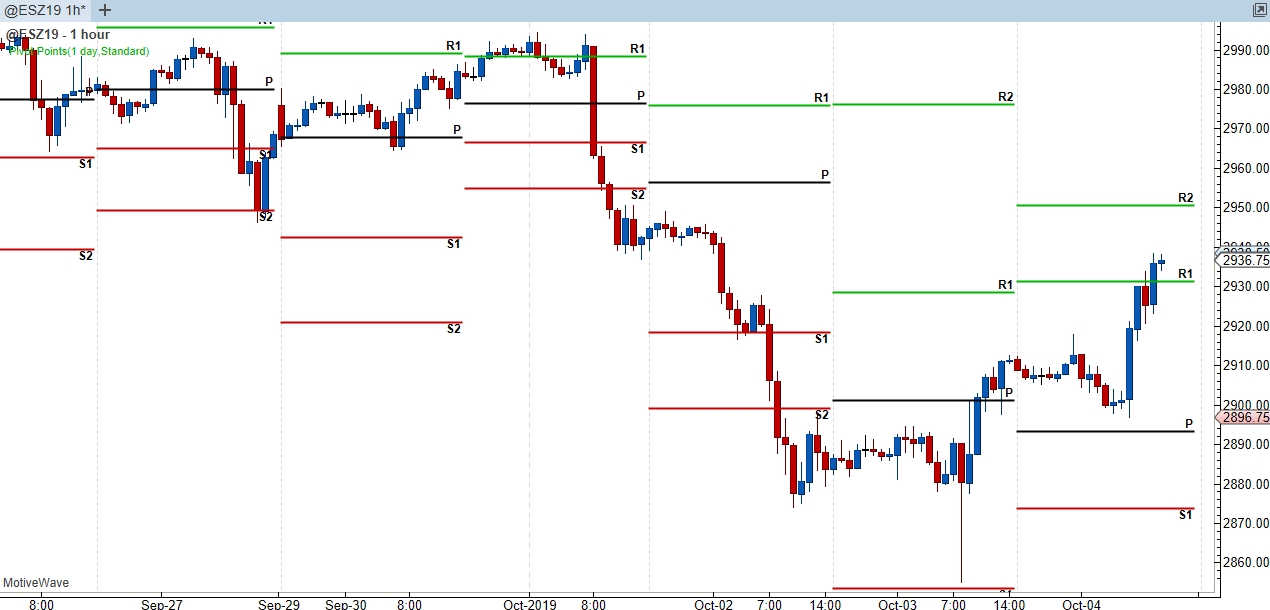
Continuous Contracts and Rollover
Continuous Contracts
Continuous contracts may be constructed by MotiveWave using historical data from expired contracts. This feature is particularly useful for brokers/data services that do not have a continuous contract option (such as CQG, Rithmic and GAIN Futures). The amount of historical data depends on the futures contracts and data available on the MotiveWave back fill server.
By default, continuous contract calculation is enabled. This can be configured globally in the General Preferences Dialog (Configure -> Preferences from the Console menu bar, see General -> General tab).
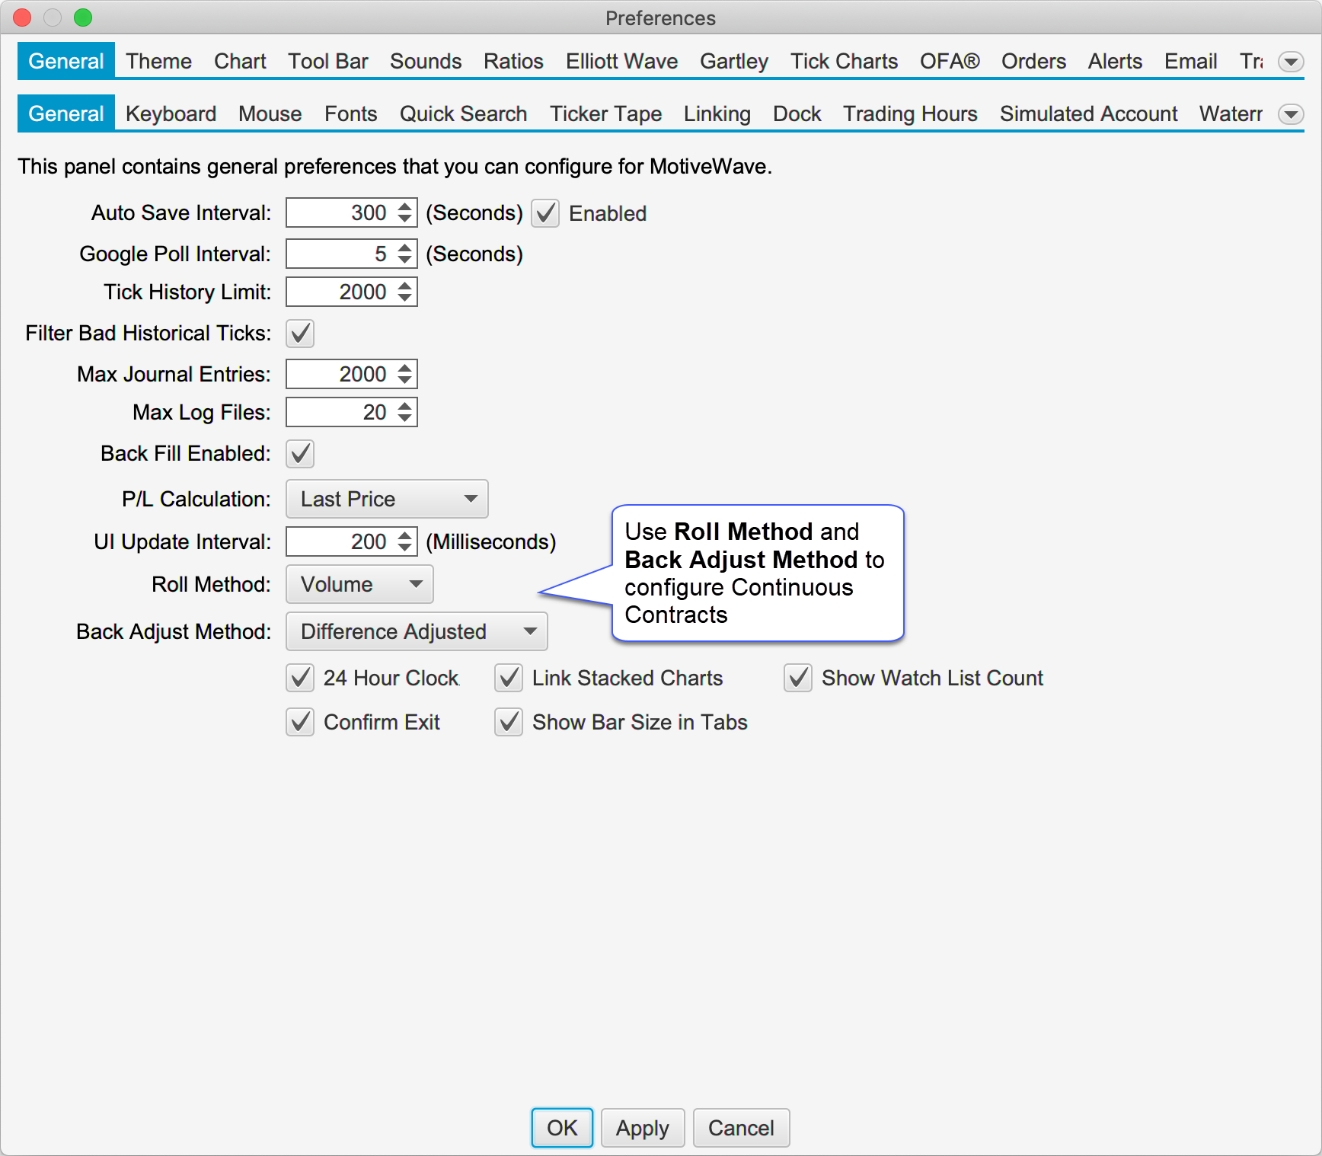
The following options are available for configuring continuous contracts:
Roll Method
The roll method determines how the dates for rolling from one contract to the previous contract are calculated.
None – If this is chosen then continuous contracts are disabled by default and only the historical data for the selected futures contract is displayed
Volume – The option will choose the roll date based on the daily volume for each futures contract. The roll date is chosen when the daily volume for the preceding contract exceeds that of the current contract.
Back Adjust Method
The back adjust method determines how to adjust the historical data between each contract. The following options are available:
Unadjusted – This option will leave the historical data unchanged. Gaps will appear where the data rolls over to the next contract.
Difference Adjusted – Adjusts the data for the preceding contract using the difference between the daily opening prices on the roll date. Note: this difference is cumulative for each contract. For example, the third futures contract will be adjusted using the difference of roll date 1 + difference of roll date 2.
Ratio Adjusted – Adjusts the preceding contract using the ratio calculated from the daily opening prices on the roll date (ie OPEN(i)/OPEN(i-1)). Older contracts will be adjusted by multiplying the ratio by the adjustment ratio from the next roll over date
Continuous contracts settings may also be configured for each instrument (overriding the options in General Preferences) from the Edit Instrument dialog (right click on a chart and choose Edit Instrument).
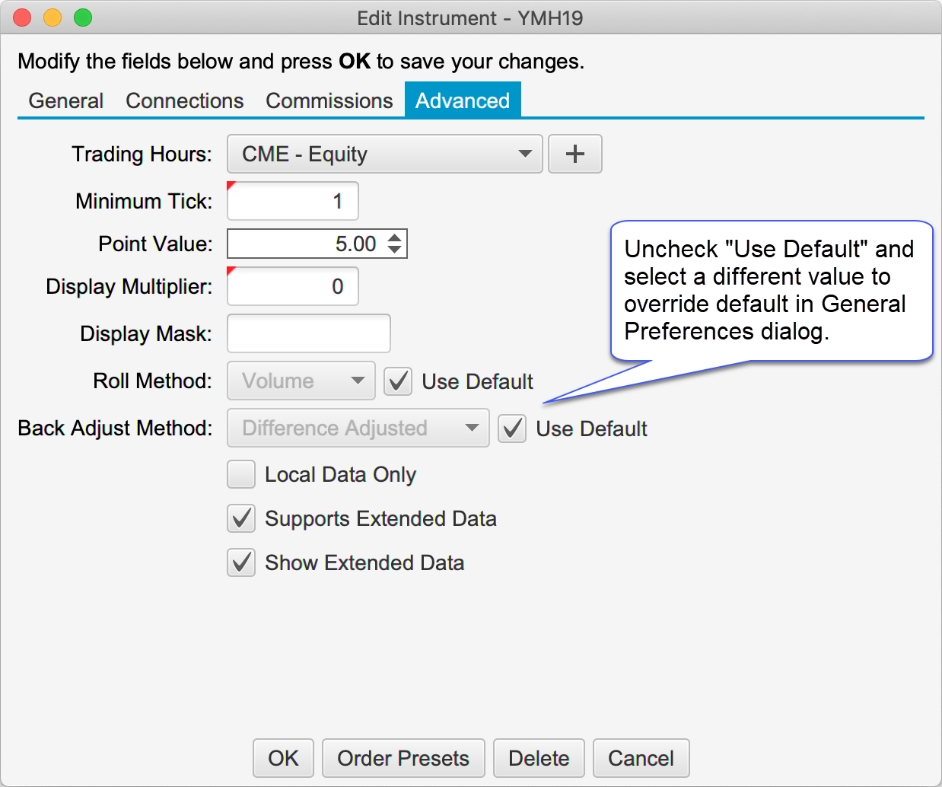
Roll Futures Contract
This option is useful when the front contract for a futures contract changes. This feature will copy existing analysis files and optionally adjust the prices to the front contract. Open charts, watchlists and Depth of Market panels can also be updated to the new contract.
Right click on the chart and choose Roll to Next Contract to open the dialog.
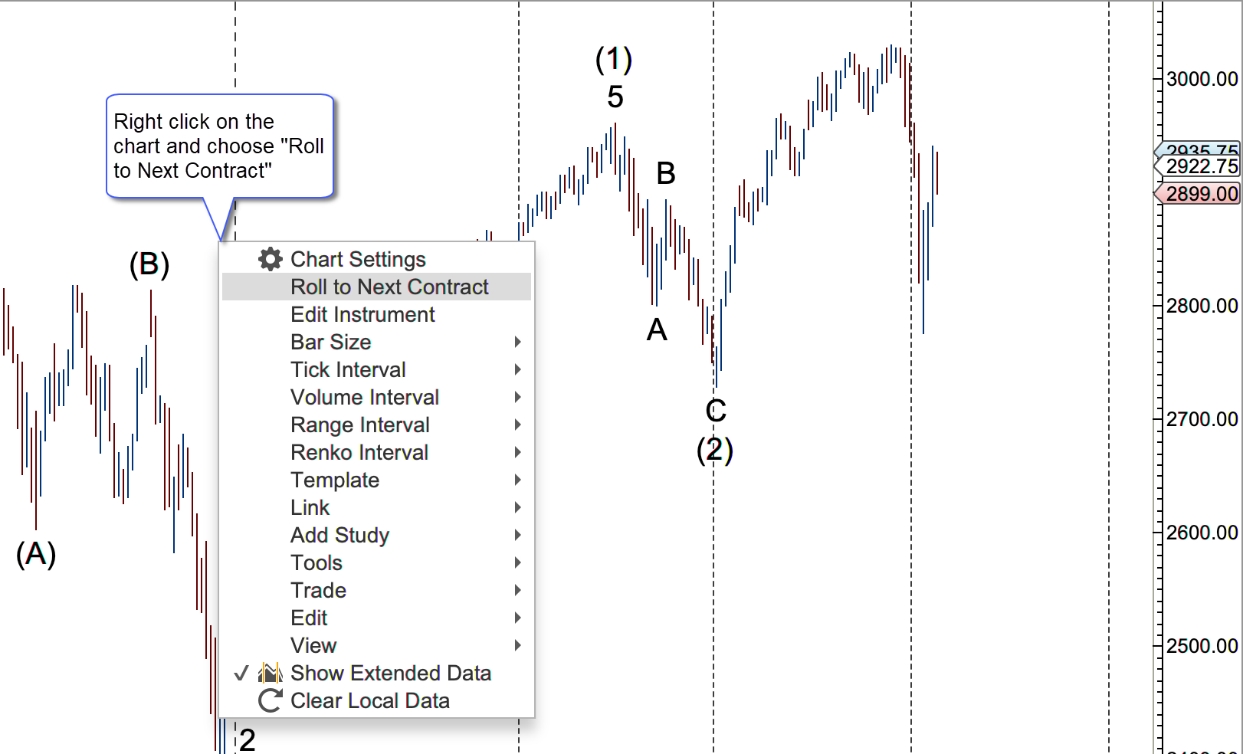
The dialog in the screen shot below presents the options for rolling to the next contract:
Instrument – This field will default to the next contract. If you want to skip a contract (or migrate to a similar instrument) you can type the symbol or use the search button.
Adjust Method – Use this field to adjust the prices for each of the components in the analysis. This has the following options:
Volume Adjusted – Automatically calculates the price adjustment by analyzing the volume between the contracts.
Unadjusted – No price adjust is made
Specific Amount – Enter a specific amout for the price adjustment
Roll All Charts/DOMs/Time Sales – Updates the symbol for any open charts, Depth of Market panels or Time & Sales panels
Roll All Watch Lists – Looks for all occurences of the symbol in watch lists (or quote sheets) and replaces them with the new symbol.
Roll Instrument Settings – Will roll the historical instrument settings and options under the Advanced tab (see Edit Instrument dialog).
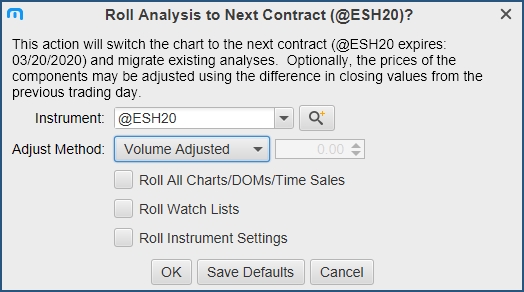
Keyboard Shortcuts
Custom Order Actions
A custom order can be defined and assigned a keyboard shortcut (Professional Edition and above). This option is available under the General Preferences Dialog (Configure -> Preferences from the Console menu bar). Click on “General” then on “Keyboard” then on “Custom Orders”
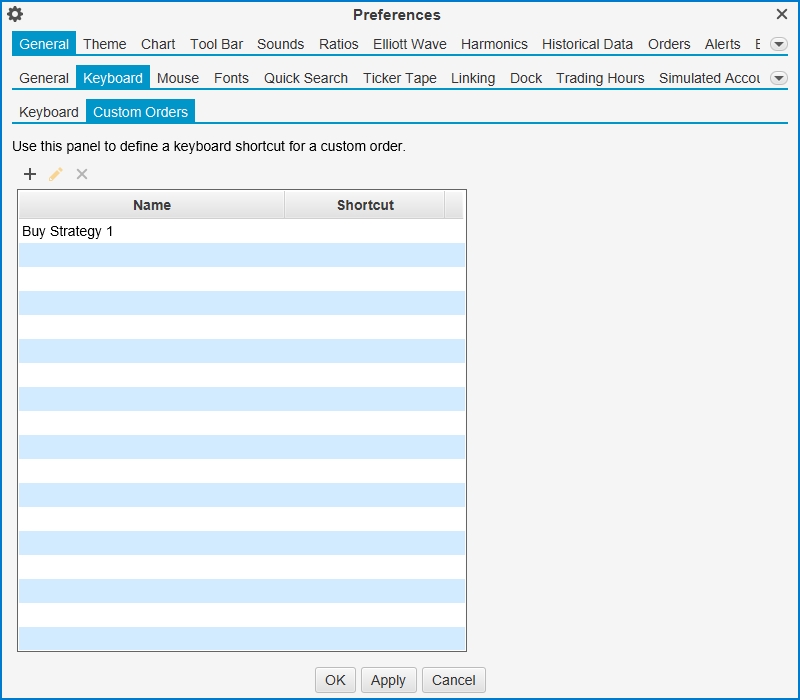
Quantity Shortcuts
Keyboard shortcuts can be assigned to preset quantities (see Order Presets dialog from the Edit Instrument Dialog). By default, the number keys 1-9 will set the quantity to the preset quantity for the instrument in numerical order. Shortcuts can be modified from the Keyboard tab in the General Preferences Dialog (Configure -> Preferences from the Console menu bar) click on “General” then on “Keyboard”.
Dock Shortcuts
The following keyboard shortcut options have been added for navigating pages, stations and tabs in the docking framework (unassigned by default, see Preferences Dialog -> “General” -> “Keyboard”):
Next/Previous Page – Sets the active page to the next/previous page.
Next/Previous Station –When a station is maximized these actions will move to the next / previous dock station (same as the left/right arrow icons in the dock tool bar)
Next/Previous Tab – Sets the active tab on the active station to the next/previous tab.
Time Axis Lines
Major vertical lines displayed from the time axis can be configured from the Preferences Dialog (Configure -> Preferences from the console menu bar. Click on “Chart” then on “Time Axis”). The following lines may be configured:
Spacing – Minimum spacing for major times displayed on the time axis
Midnight – midnight using the time zone set for the chart
Start of Day ETH - Start of the day for extended trading hours (enabled by default)
Start of Day RTH – Start of day for regular trading hours
End of Day ETH – End of day for extended trading hours
End of Day RTH – End of Day for regular trading hours
Start of Week – Start of week (Sunday midnight) using the time for the chart
Start of Month – Start of the month (midnight) using the time zone set for the chart (enabled by default)
Start of Year – Start of the year (midnight Jan 1) using the time zone set for the chart (enabled by default)
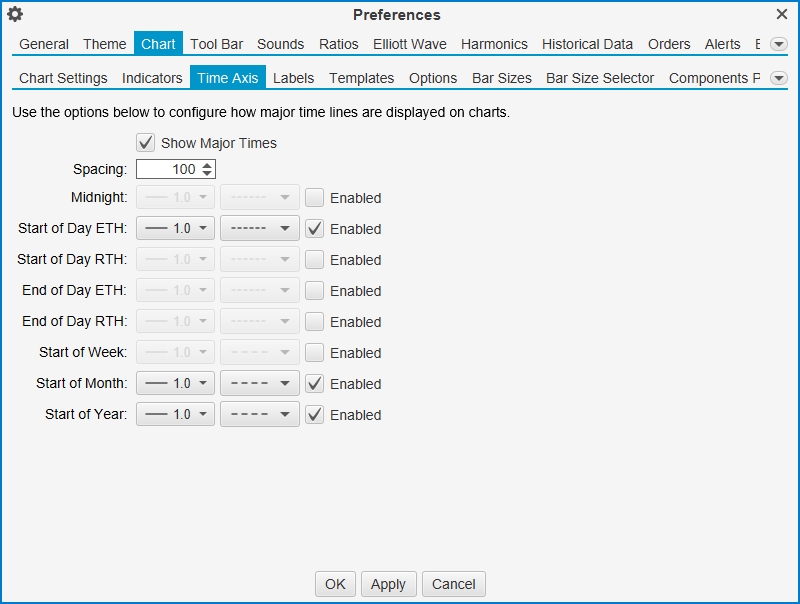
Table Row Colors
The even and odd row colors for table elements can be customized from the Preferences Dialog (Configure -> Preferences from the console menu bar, click on Theme. See option: Table Row Colors). Note: a restart of MotiveWave is required to see the changed values.
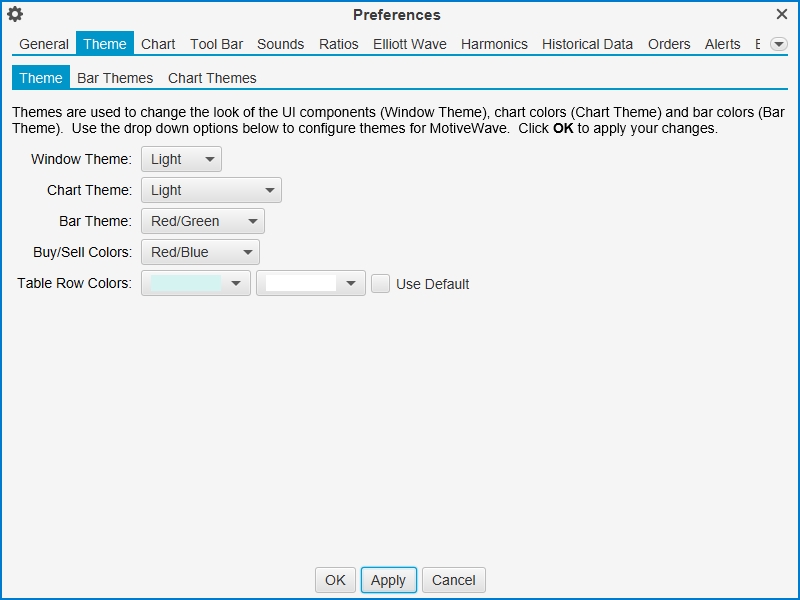
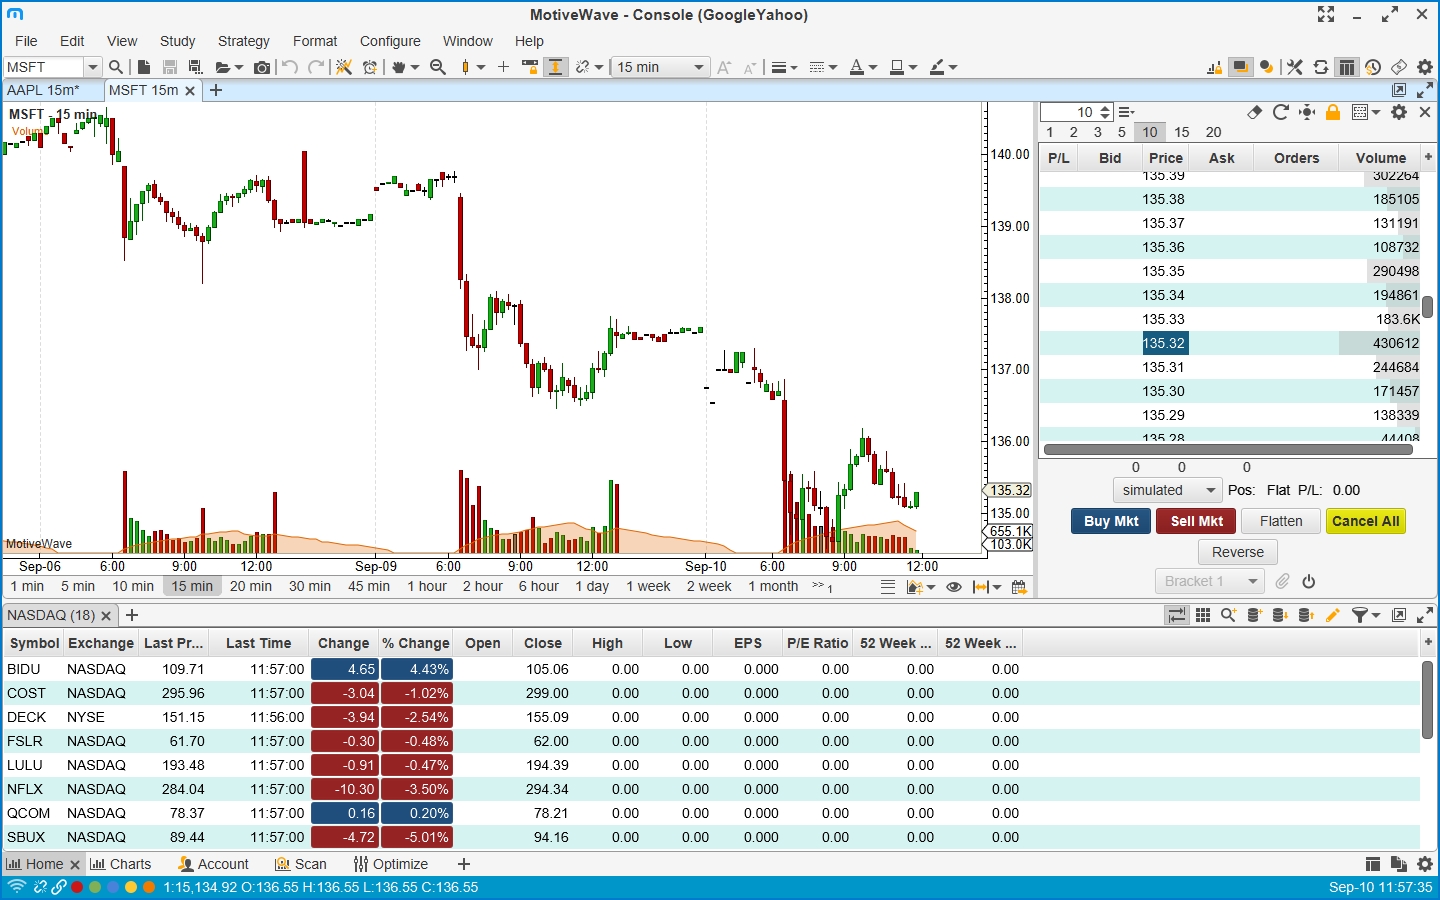
Other Enhancements
This section outlines some other small enhancements that have been added to this update.
Guide Templates
Templates have been added for price and time guides. See properties dialog when creating or editing a guide. Guides for a specific template can be added directly from the right click menu on the price or time axis.
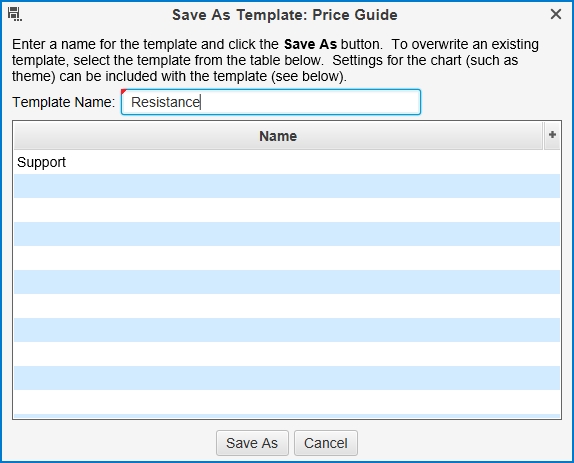
Delete Expired Instruments
Expired instruments (futures contracts and options) can be removed from the workspace in the Manage Instruments Dialog (Configure -> Instruments in the Console menu bar). See: Delete Expired button at the bottom of the dialog.
Horizontal Line Tool
Added a mouse tool for creating a horizontal line. See tools drop down (hand cursor by default).
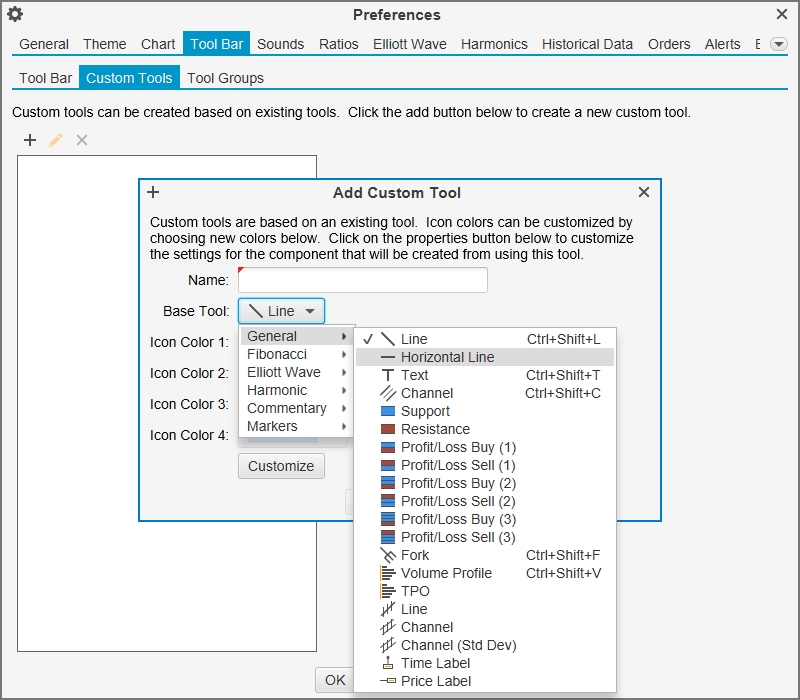
Line Graph Label
Added the symbol to the price graph when displayed as a line graph.
Lock/ Unlock Components
This action will toggle the locking of components on the active chart (instead of locking components individually). (See View -> Lock/Unlock Components from the menu bar)
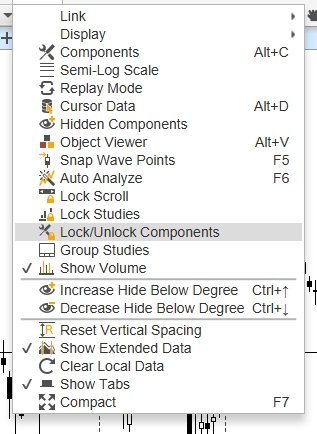
Alert Colors
Colors may be assigned to alerts or signals generated from studies. The color may be useful for identifying the purpose or urgency of an alert when it is triggered.
Price/Study Value Alerts
A color may be assigned from the Advanced tab of the alert dialog:
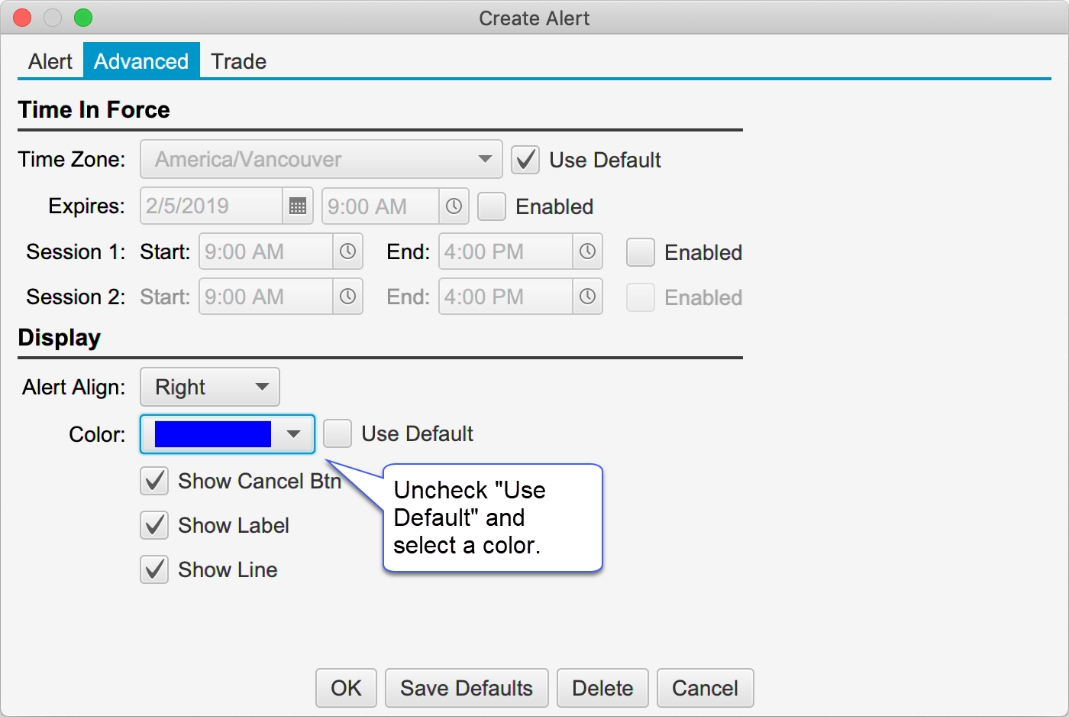
This color is displayed as a background color for the alert on the price chart, Alerts panel and the Alert History window:
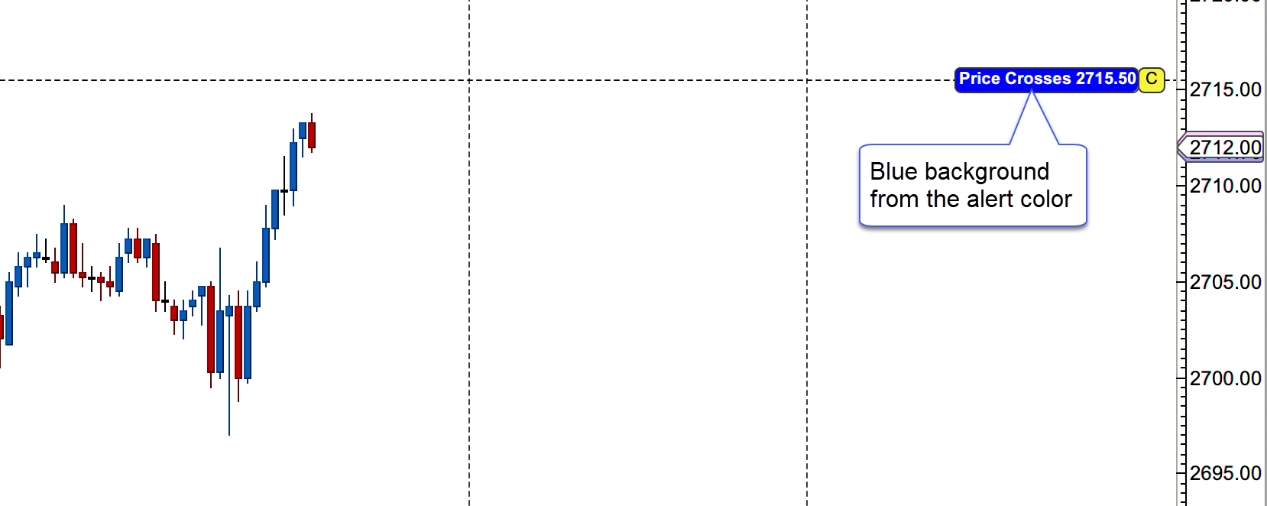
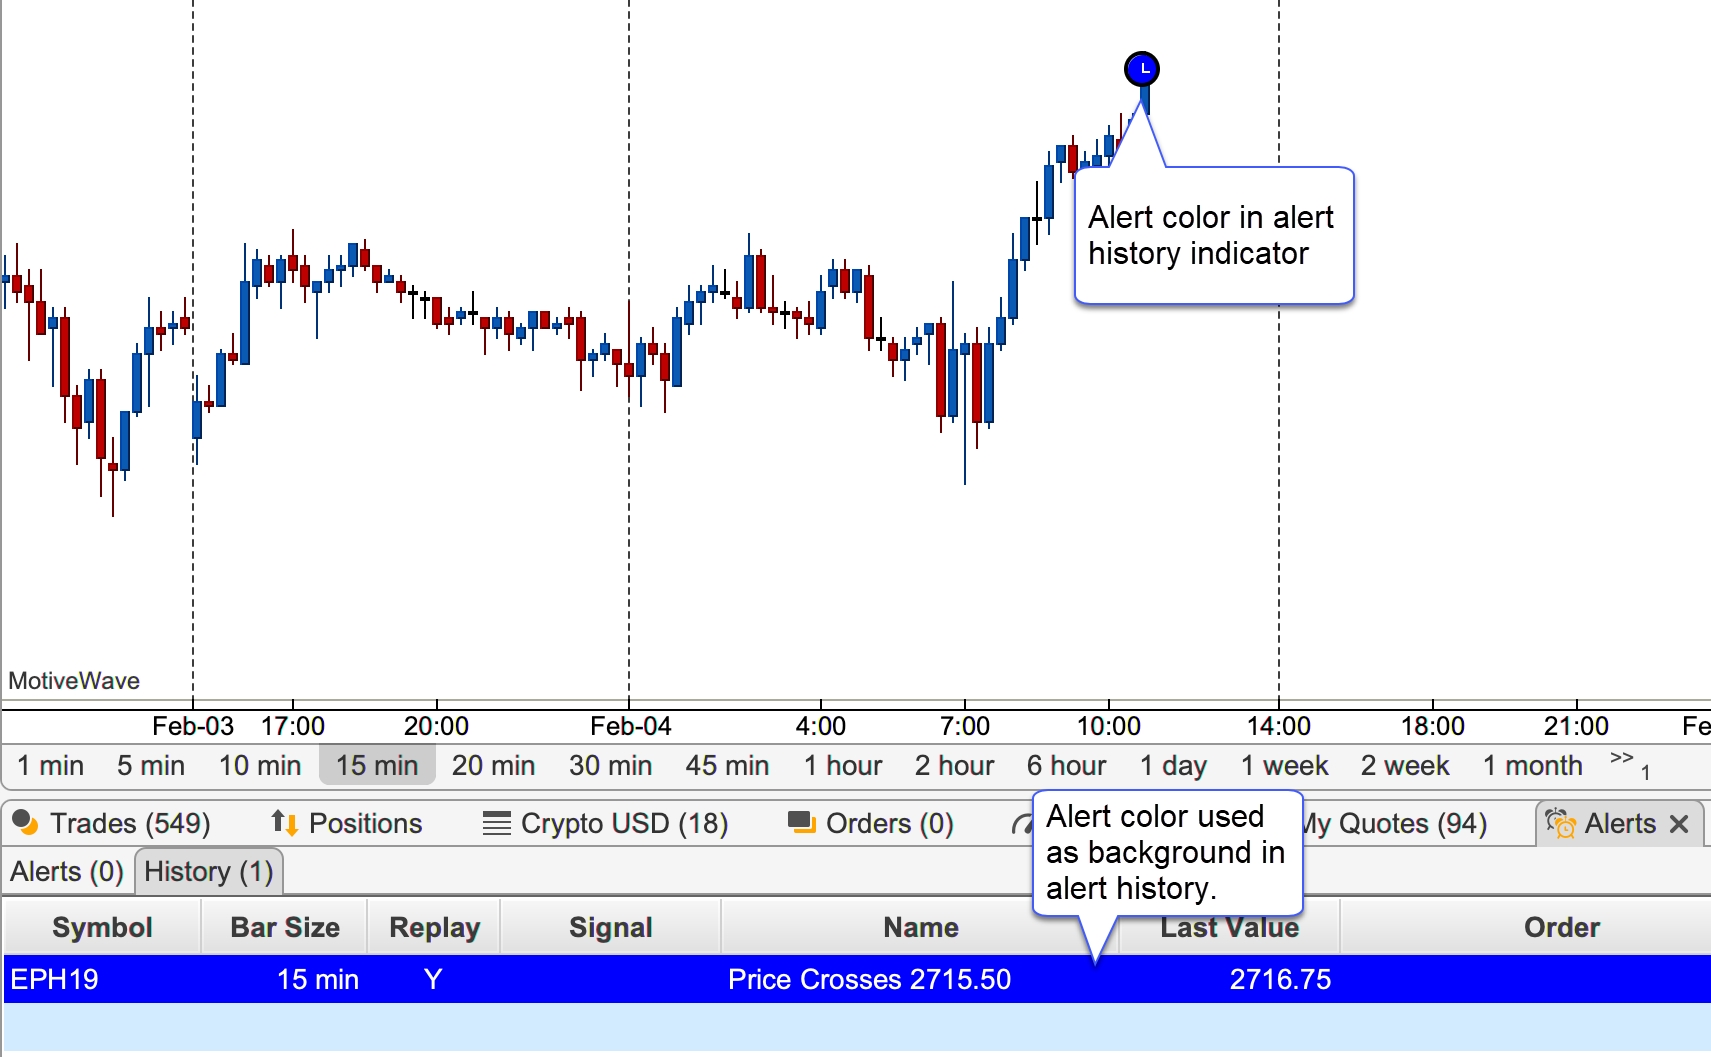
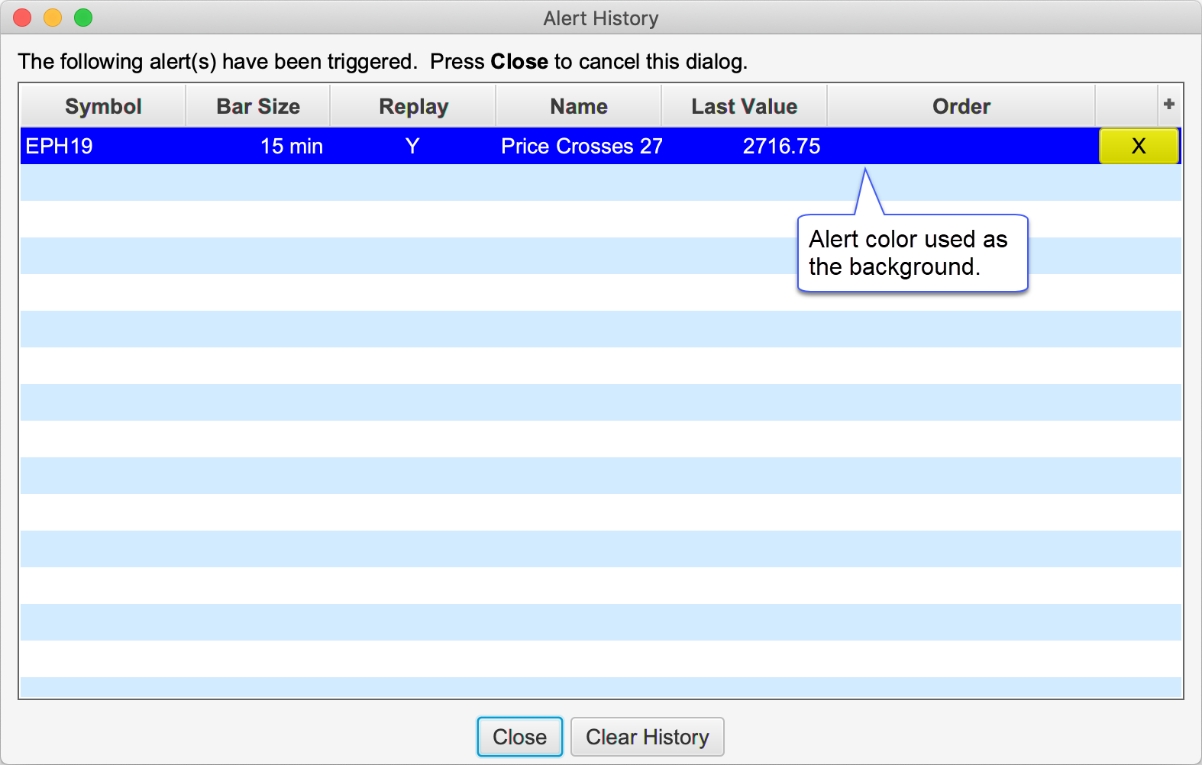
Study Signals
Colors for signals generated by studies can be set from the Signals tab of the Study Dialog. The example below shows a blue color assigned when the Fast MA crosses above the Slow MA and a red color assigned when the Fast MA crosses below the Slow MA (using the Moving Average Cross study).
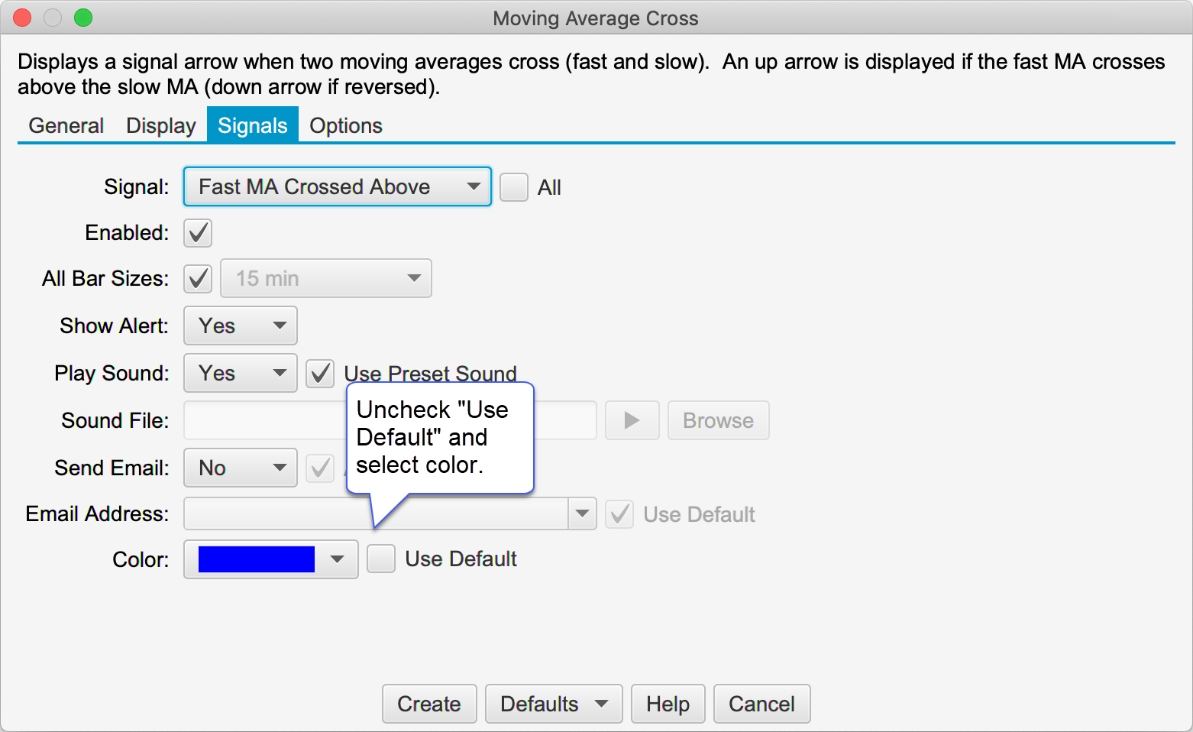
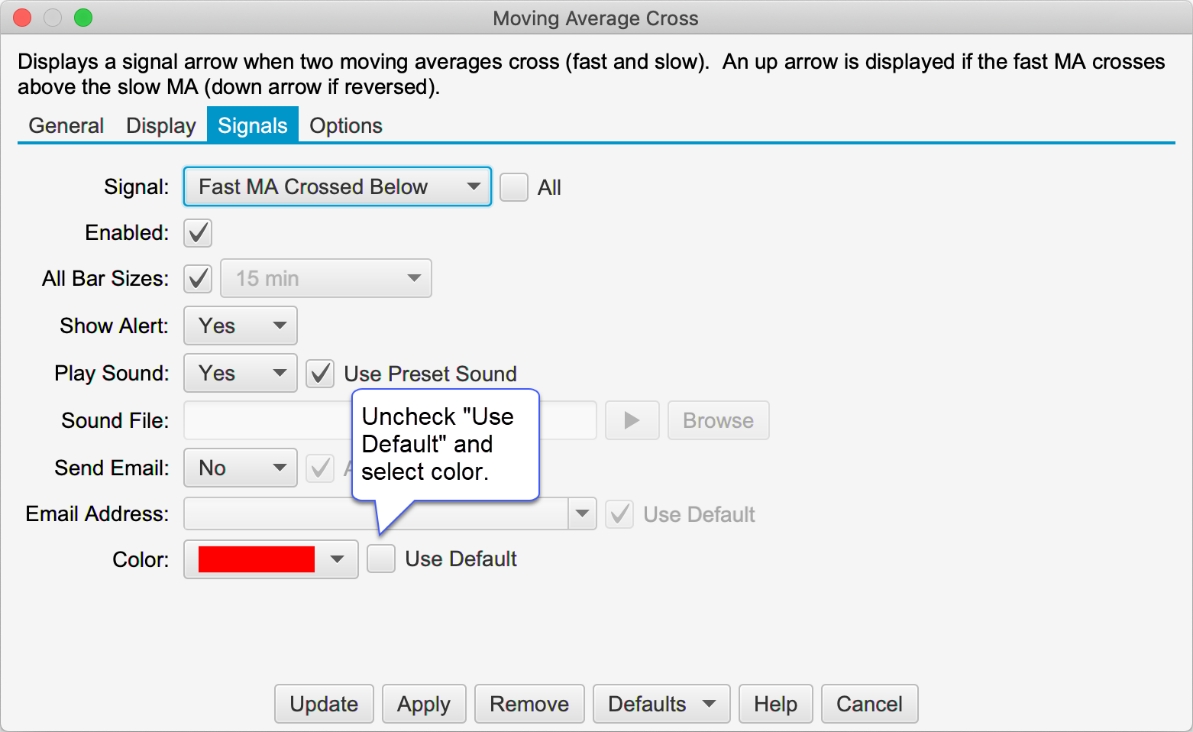
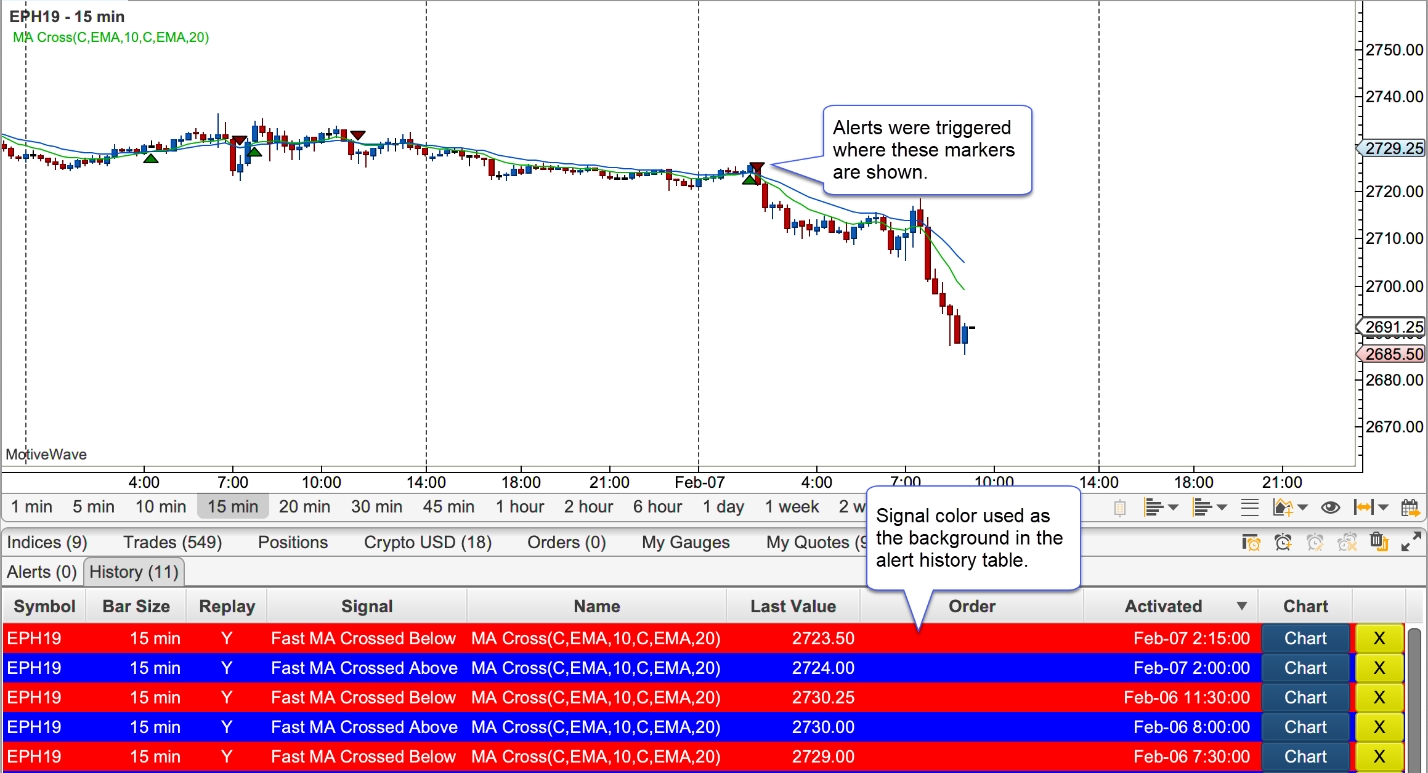
CryptoCompare API Key
The CryptoCompare connector has been updated to accept an API key. An API key is not currently required, but may be required in the near future. For details see: https://min-api.cryptocompare.com/faq
Auto Backup
The auto backup feature will automatically create a backup of your open workspace on a given interval. Choose Configure -> Preferences from the Console menu bar and click on General, then on Auto Backup (see below).
The max files option will limit the number of backup files in the saved folder. When the limit is reached, the oldest backup file is removed from the folder (deleted).
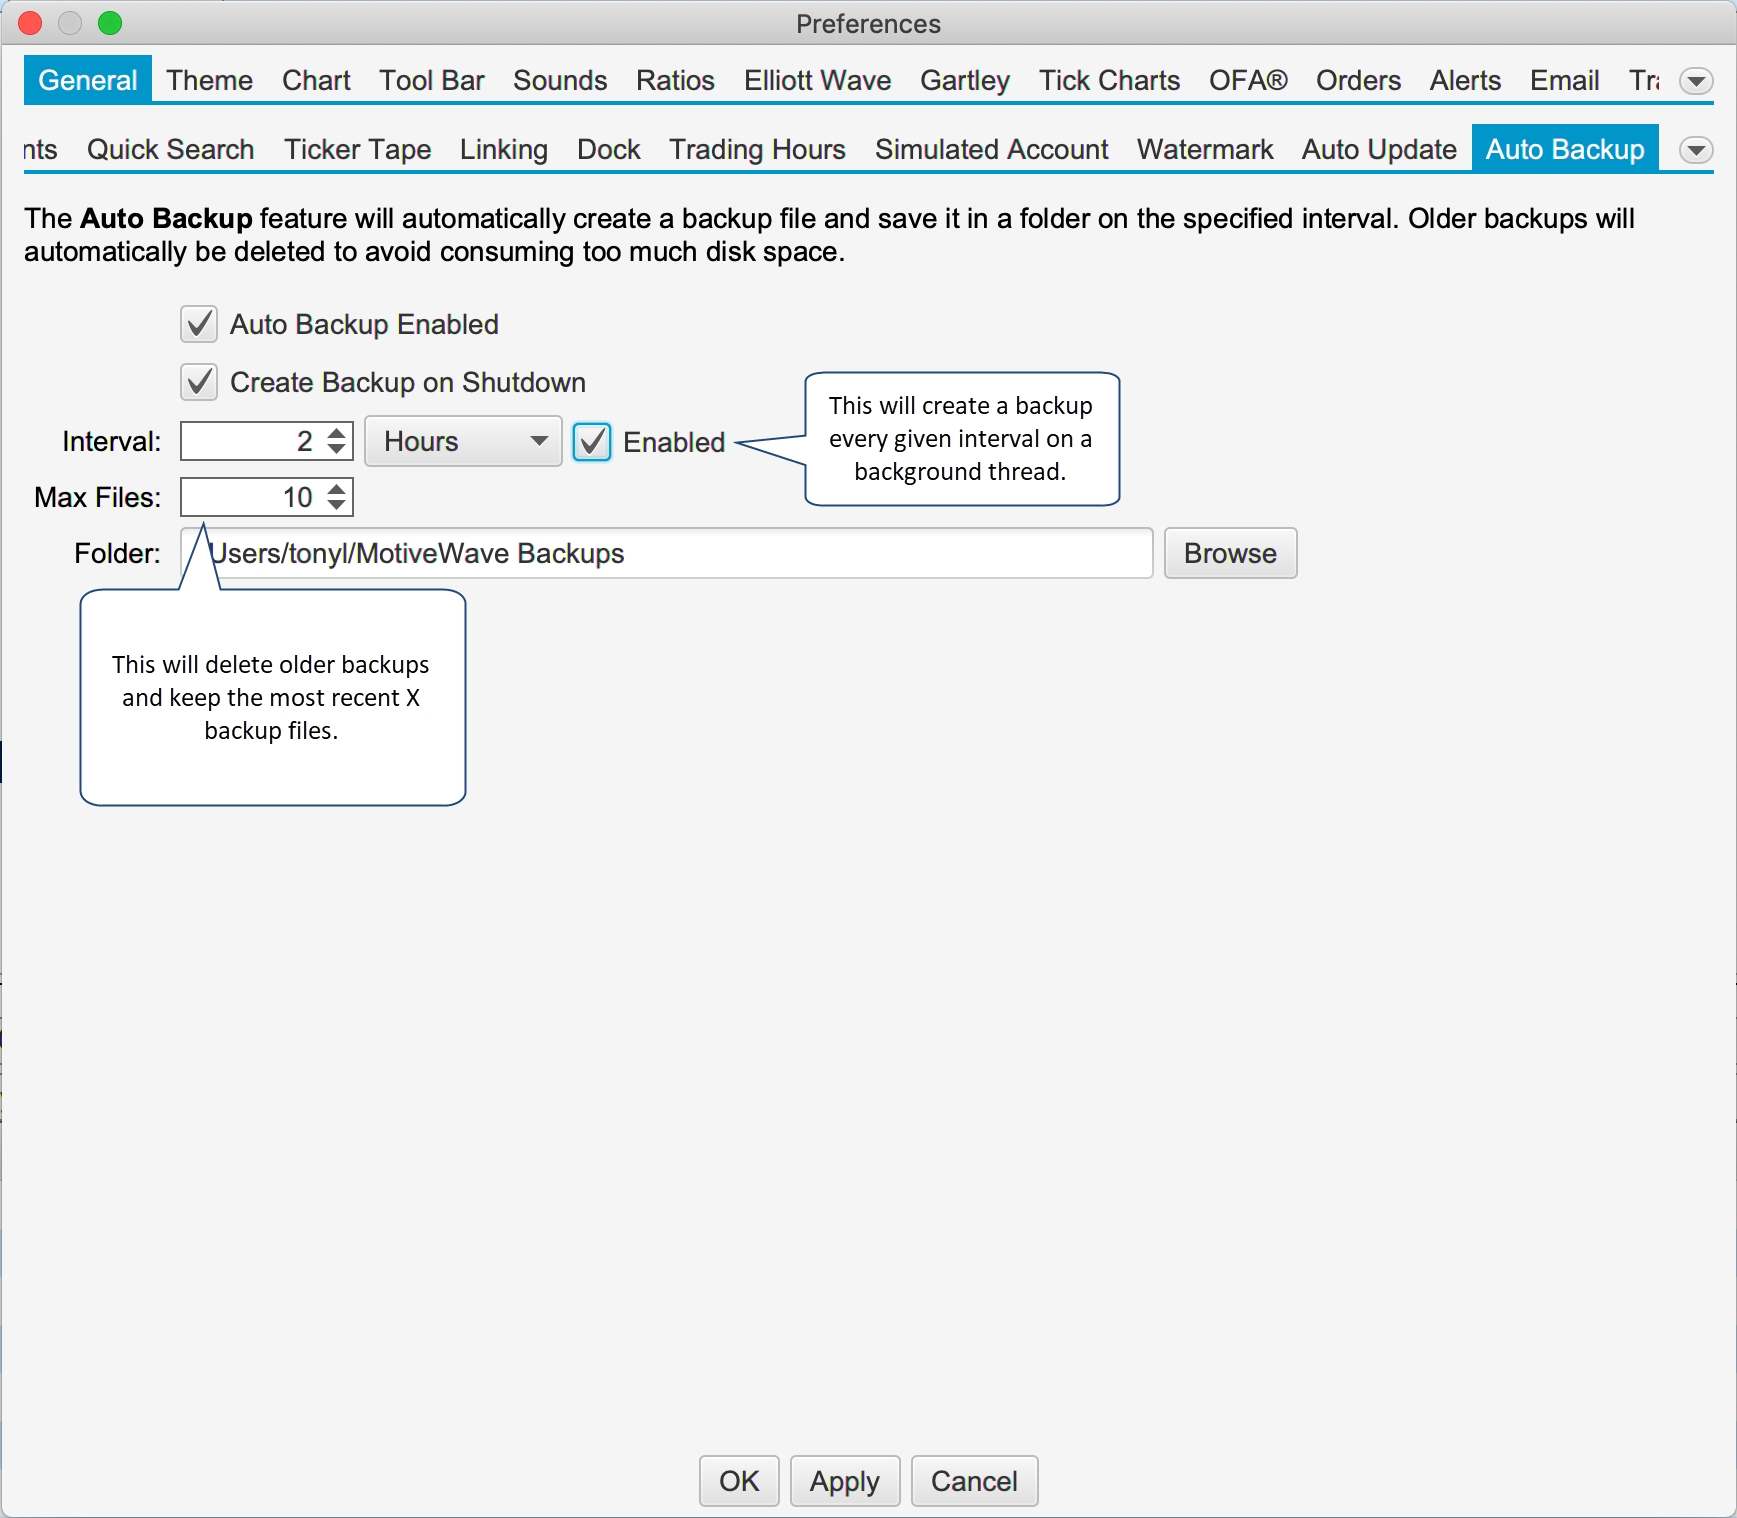
Log File Trimming
Every time MotiveWave™ is started a log file is created in the Log Folder (choose Help -> Log Files from the Console menu bar, or Options -> Log Files from the startup screen). Over time the number of log files in this folder can become quite large. As part of version 6, the number of files in this folder is trimmed to 20 (newest files are kept). You can change the number of log files that are kept (minimum of 5) in the Preferences Dialog (Configure -> Preferences from the Console menu bar, see General -> General tab).
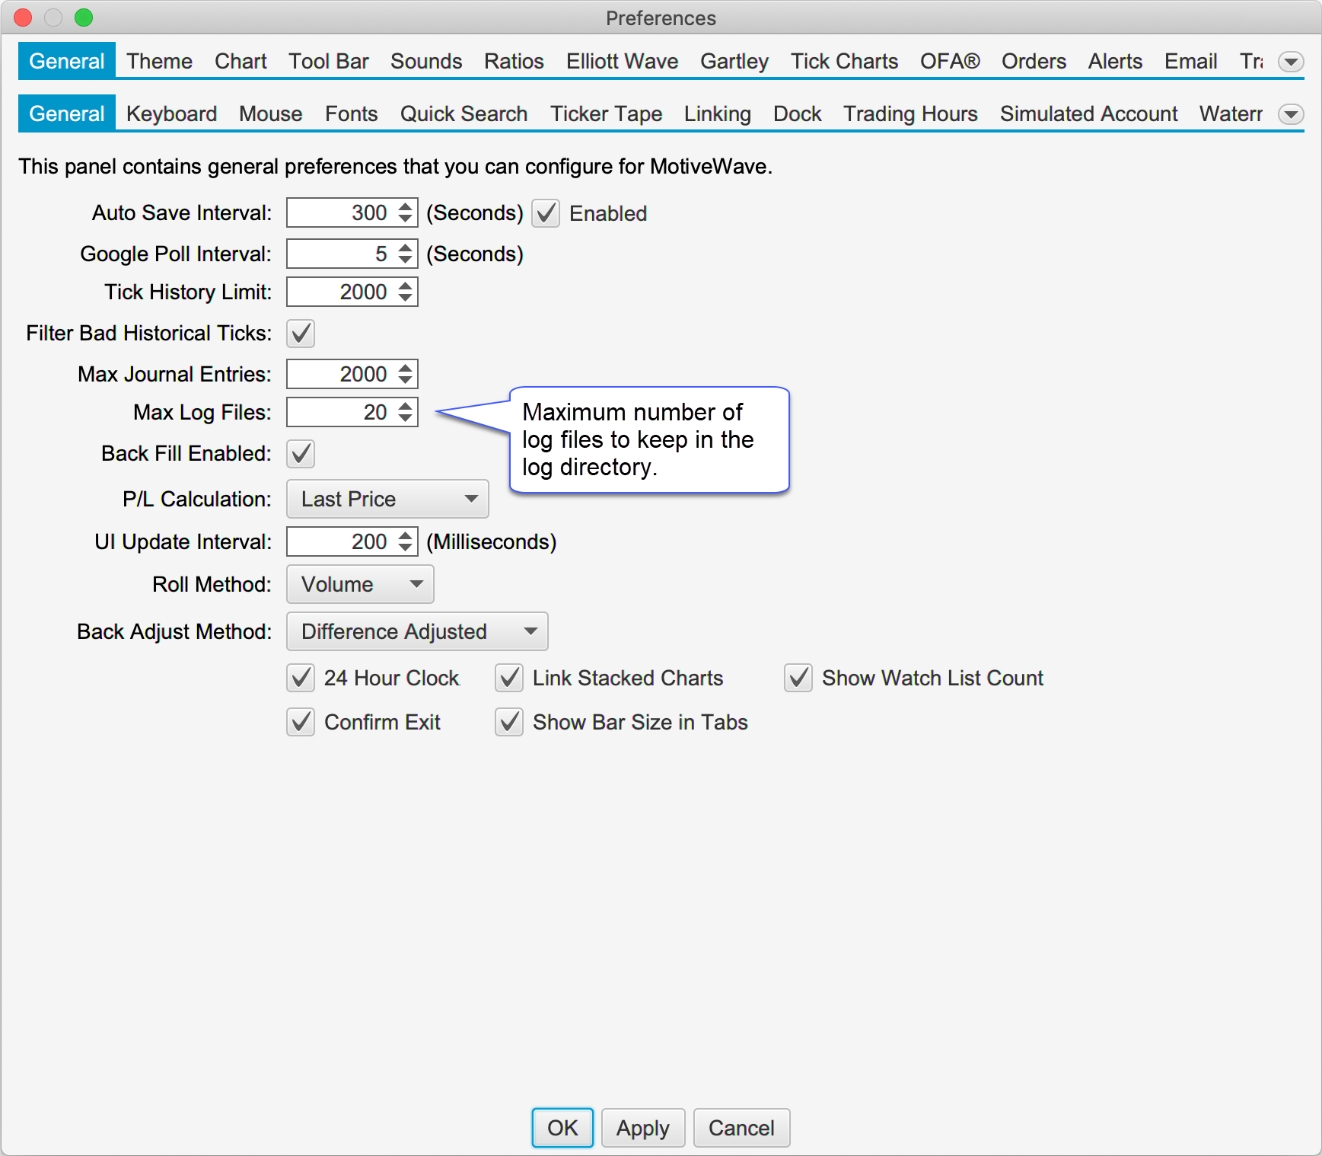
Backfill Settings
Back Fill may be enabled (or disabled) per instrument in addition to globally. This option can be found in the Instrument Dialog (right click on a chart and choose Edit Instrument, see Advanced tab):
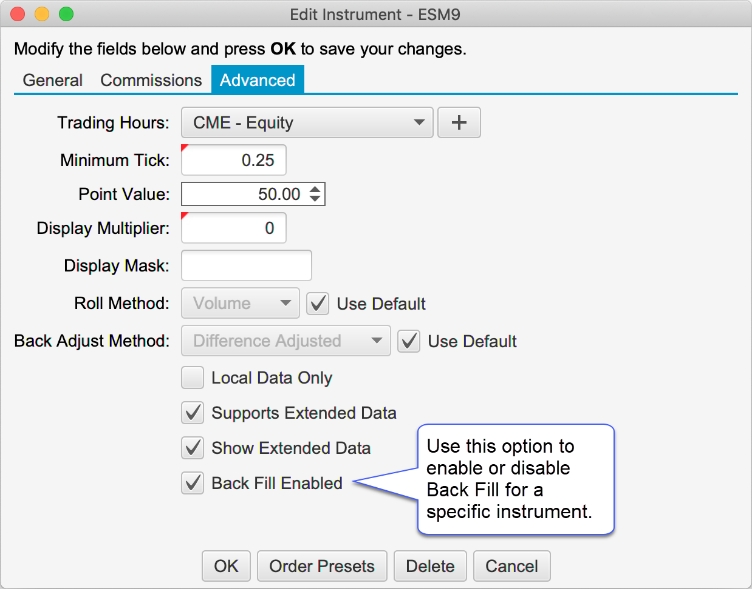
Reversal Bars
This new bar type has been added that has the following parameters:
Reversal Amount – price movement in ticks from the high or low of the bar for the bar to complete. The bar is considered complete when the close has reversed from the high/low by an amount equal or greater than this amount. Reversal bars alternate between reversing from the high and low (ie if one bar reverses from the high, the next bar will reverse from the low)
Minimum Amount – Minimum range for the bar (high – low) before the reversal amount is applied.
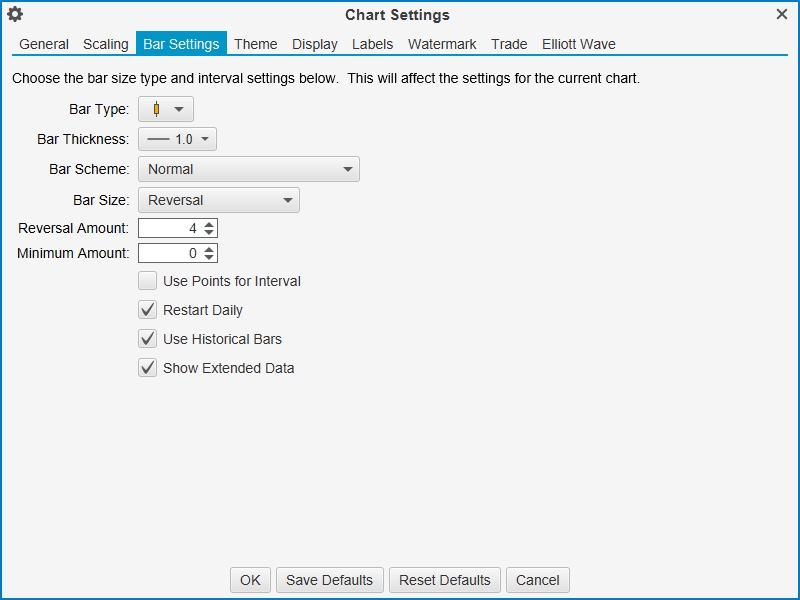
Intraday Bar Build Method
Depending on which broker/data service you are using, MotiveWave will receive and store historical bars in one or more of the following sizes (raw bar sizes): 1 min, 5 min, 30 min and 120 min.
All other bar sizes are built by combining data from the raw bars. By default, these bars are built on a weekly interval starting at 9:00 am on Sunday (EST).
This feature is now configurable in the Preferences Dialog (Configure -> Preferences from the Console menu bar, see Historical Data -> General tab). The following options are available:
Method – Weekly or Daily. For weekly the bars will be built starting at the given time on Sunday
Time Zone – Relative timezone for the start time
Start Time – Time of day to start building the bars (using the time zone above).
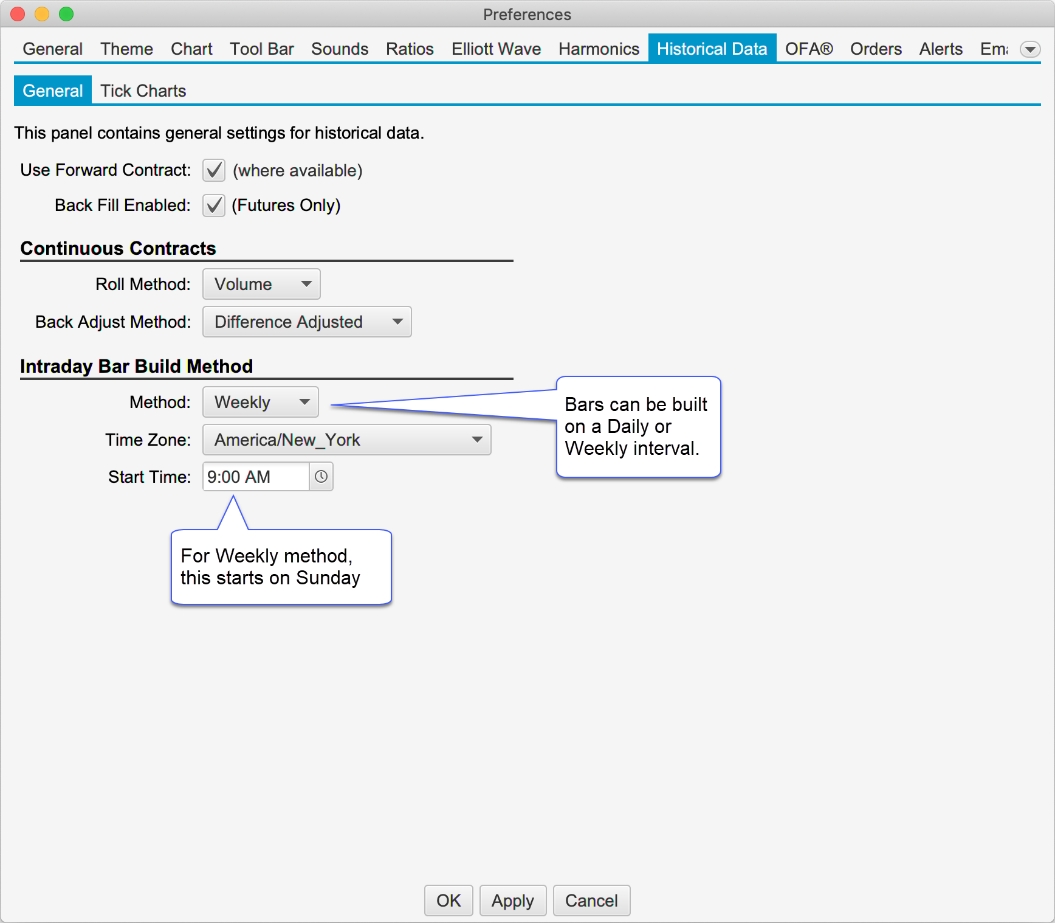
Price Scaling Ticks From Edge
A new option has been added to the Price Range scaling option (see Chart Preferences Dialog Scaling tab, double click on the chart):
Ticks From Edge – Keeps the current price at least X ticks away from the top or bottom of the chart. This setting only applies when the current price is shown on the chart.

Tick Data Performance
Significant enhancements have been made to the loading and processing of tick data. In some cases, multiple concurrent requests for tick data are combined into a single fetch operation.
Non-Linear Bars
The approach to building non-linear bars (Tick, Renko, Range, Point & Figure, etc) has been re-written to be more consistent and efficient.
The maximum number of days of tick data (default 10 days) can be controlled from the Chart Settings dialog (see General Panel).
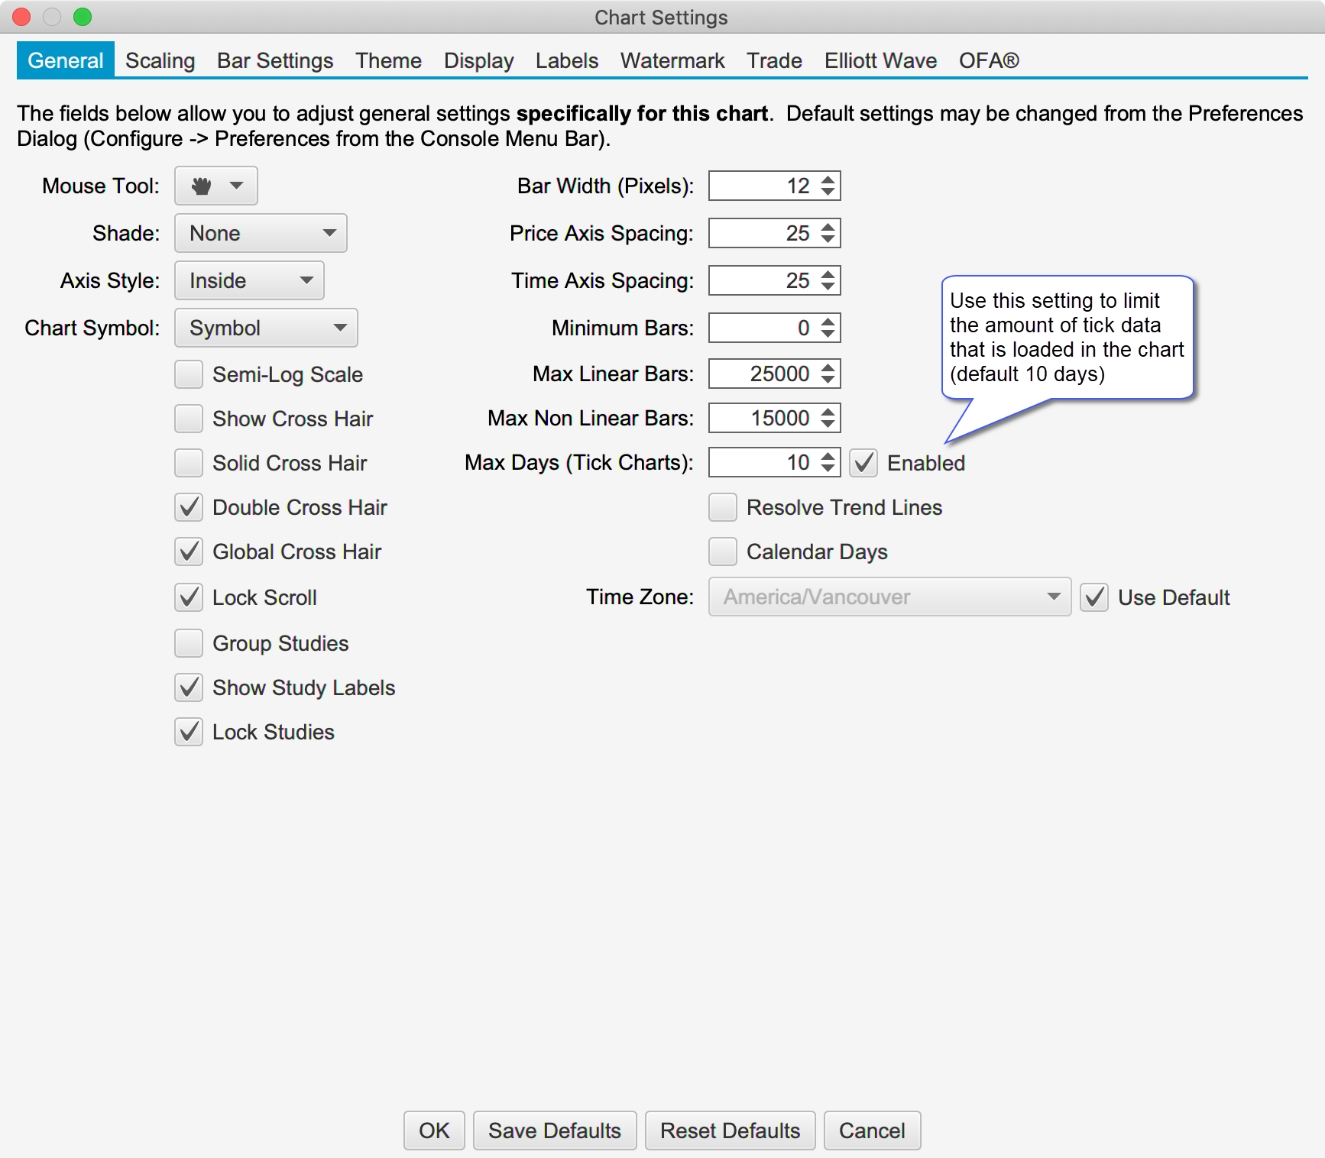
Two additional parameters have been added to the Bar Settings panel for Non-Linear bars:
Restart Daily – Restarts the calculation of the bars each day.
Use Historical Bars – Builds bars using historical minute bars (instead of tick data).
These settings are specific to the chart as opposed to the global settings in the general preferences dialog (Configure -> Preferences from the Console menu bar Historical Data -> Tick Charts).
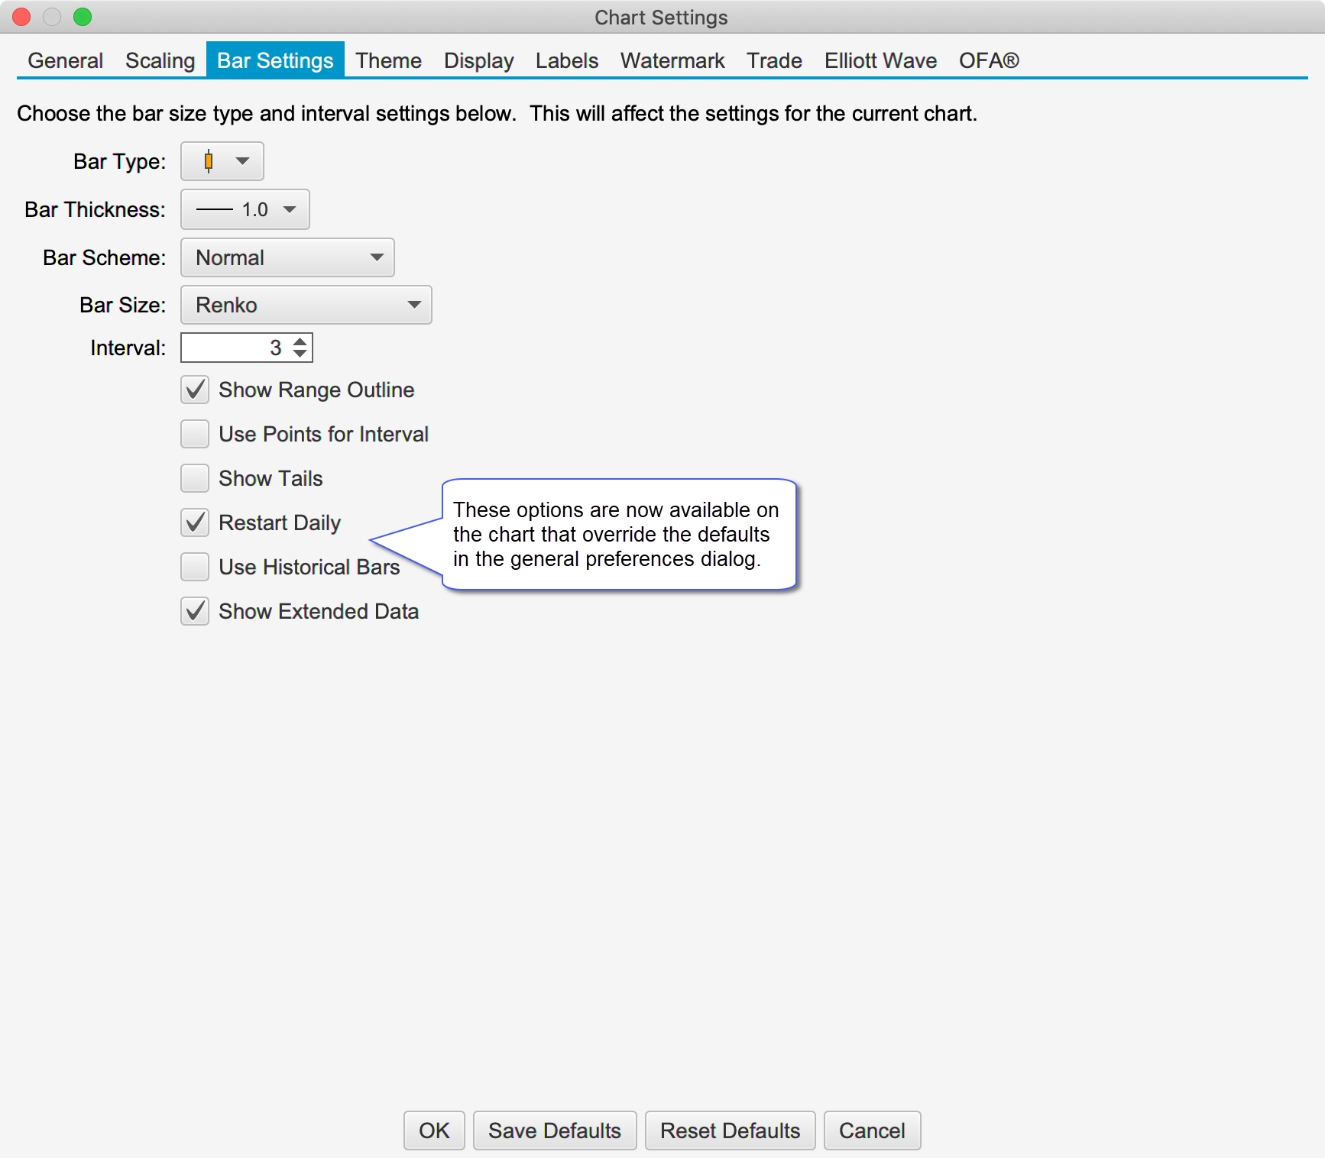
Copyright Watermark
Note: this feature is only available in Professional Edition and above.
This feature is similar to the Watermark feature, but displays a copyright notice at a specific location on the chart. Day, month and year can optionally be inserted using the variables [DD], [MMM] and [YYYY]. This feature is in the General Preferences dialog (Configure -> Preferences from the Console menu bar, click on Chart, then on Copyright).
The copyright message can be moved or hidden on specific chart via the right click menu: Move Copyright -> Location.
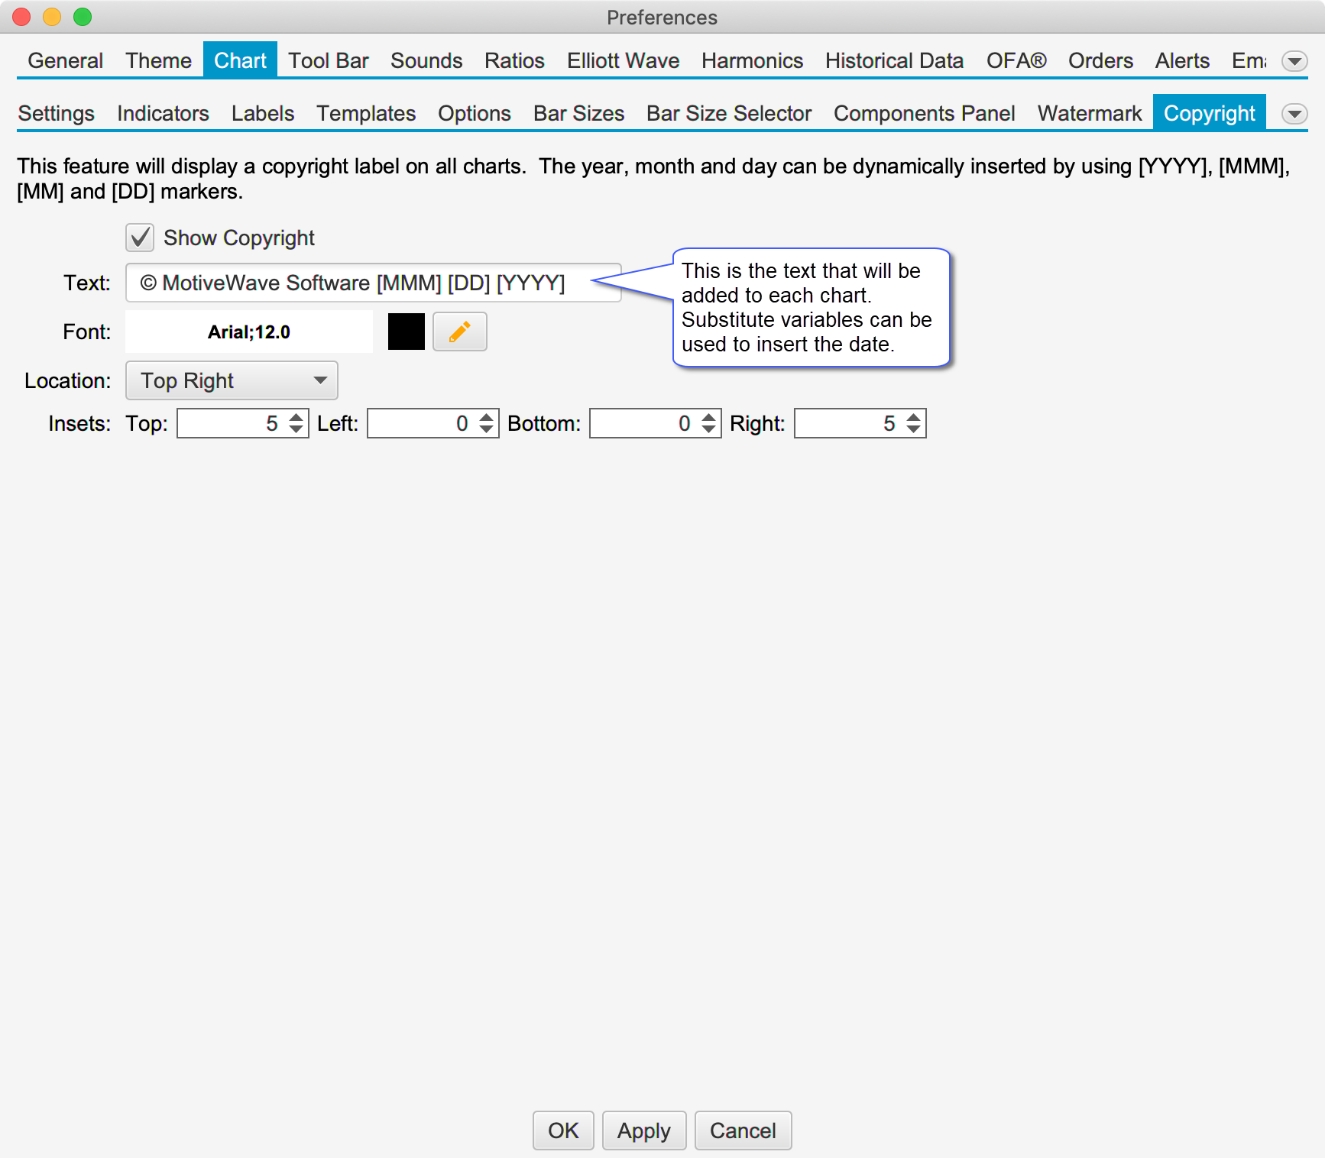
The screen shot below shows the copyright statement on a chart (top right corner):
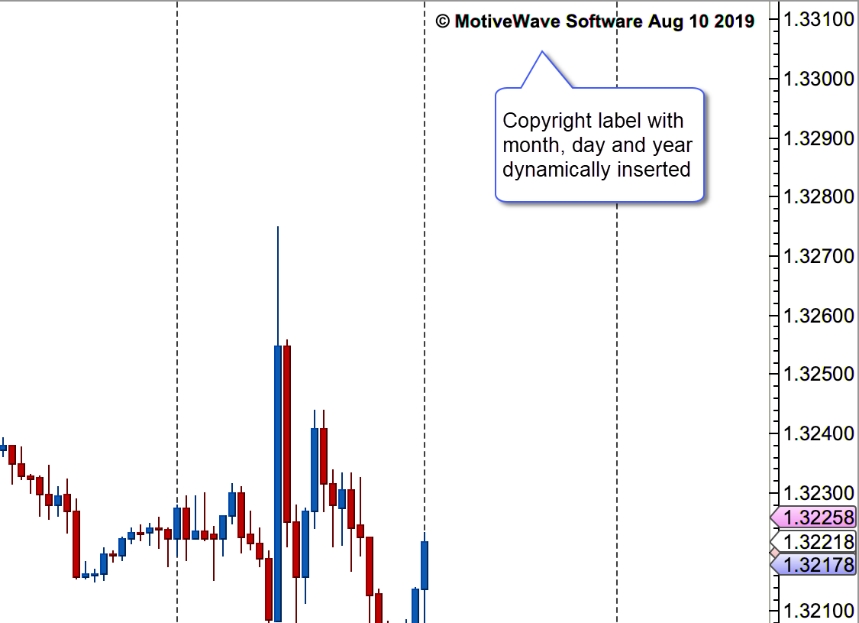
The copyright display can also be selectively disabled for a chart from the Chart Settings dialog (right click on chart an choose Chart Settings, see Display tab). Check the Disable Copyright box and press the OK button.
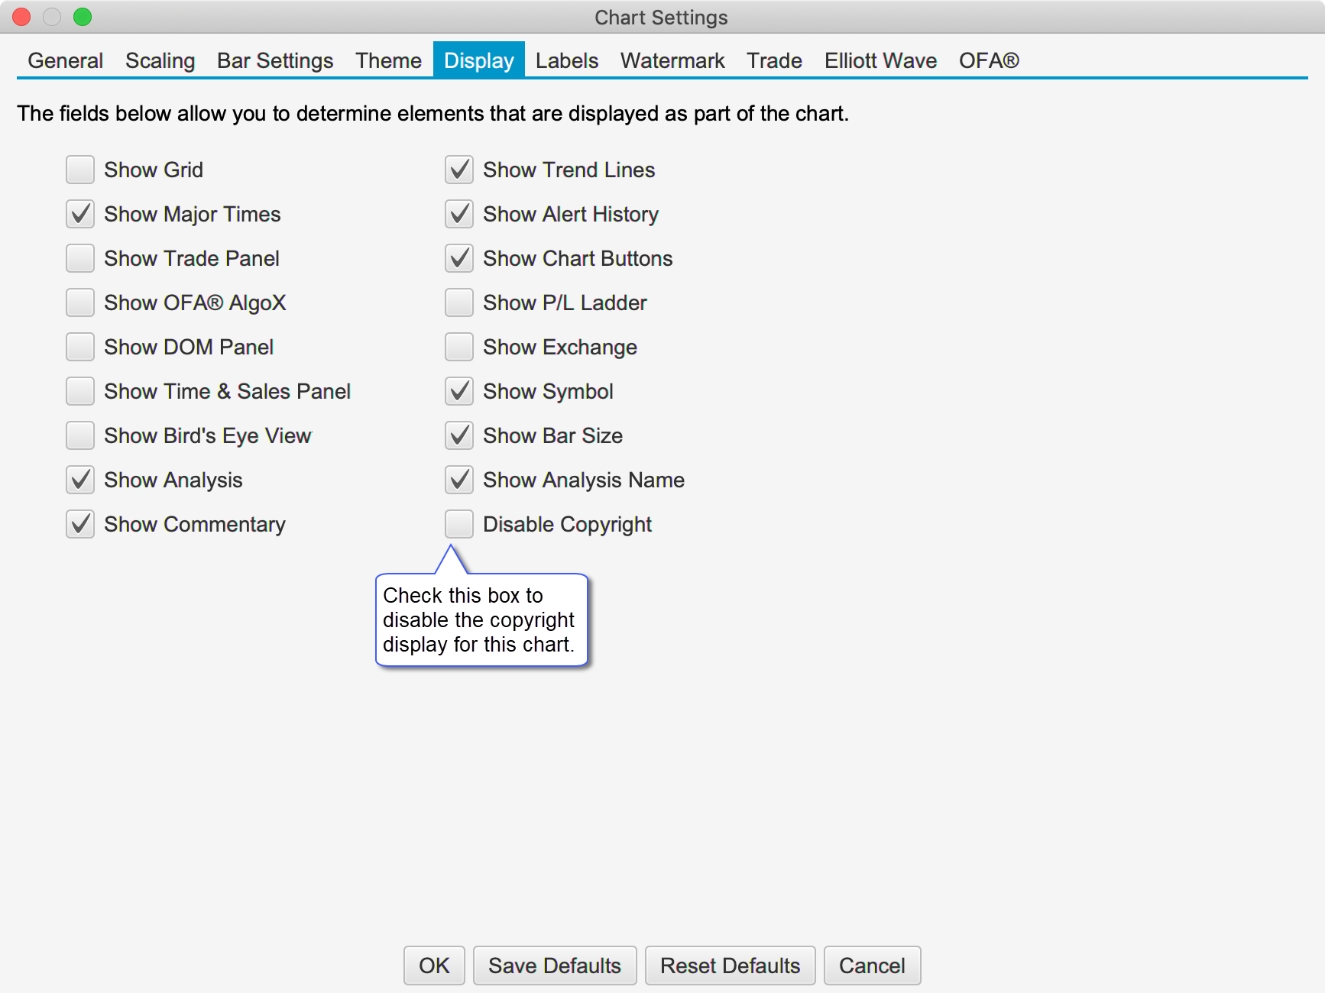
Trend Line Type
A Line Type option has been added to the Trend Line component (see Properties dialog). This option will allow you to set a trend line to be Horizontal or Vertical. The main purpose of this feature is to enable the creation of a custom horizontal or vertical line tool (see Custom Tools feature).
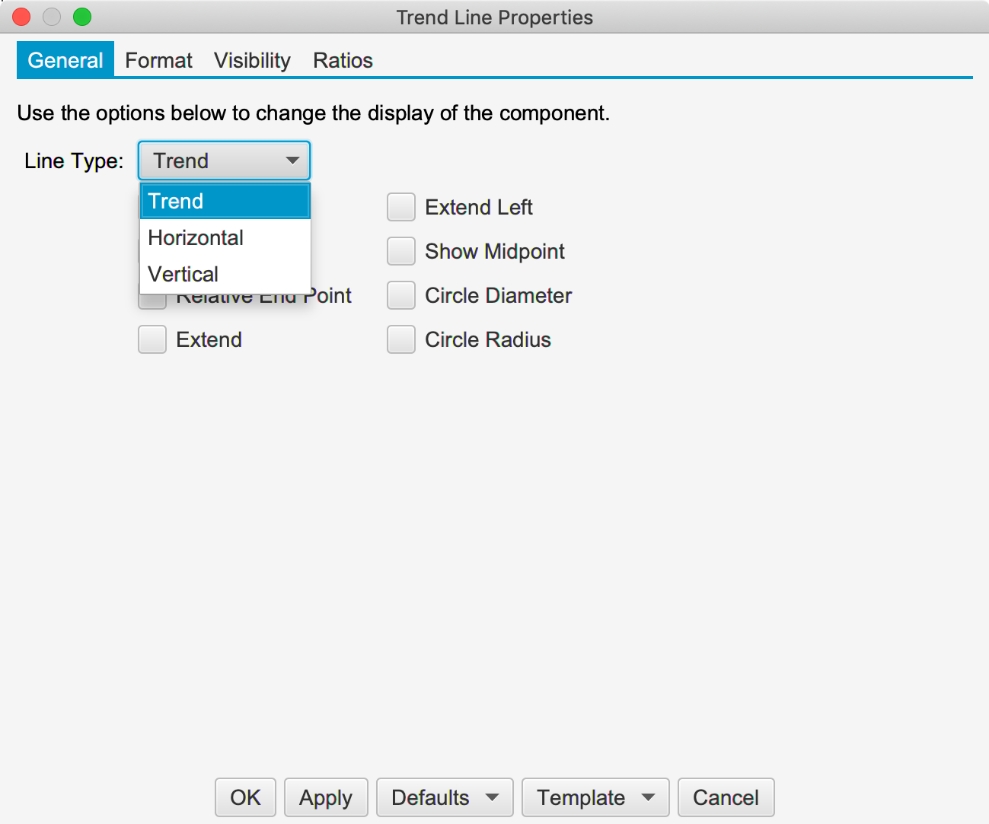
Profit Loss Mouse Tool
Mouse tools have been added for each of the Profit/Loss Calculator components. These tools can be added to the tool bar from the General Preferences dialog (Configure -> Preferences from the Console menu bar).
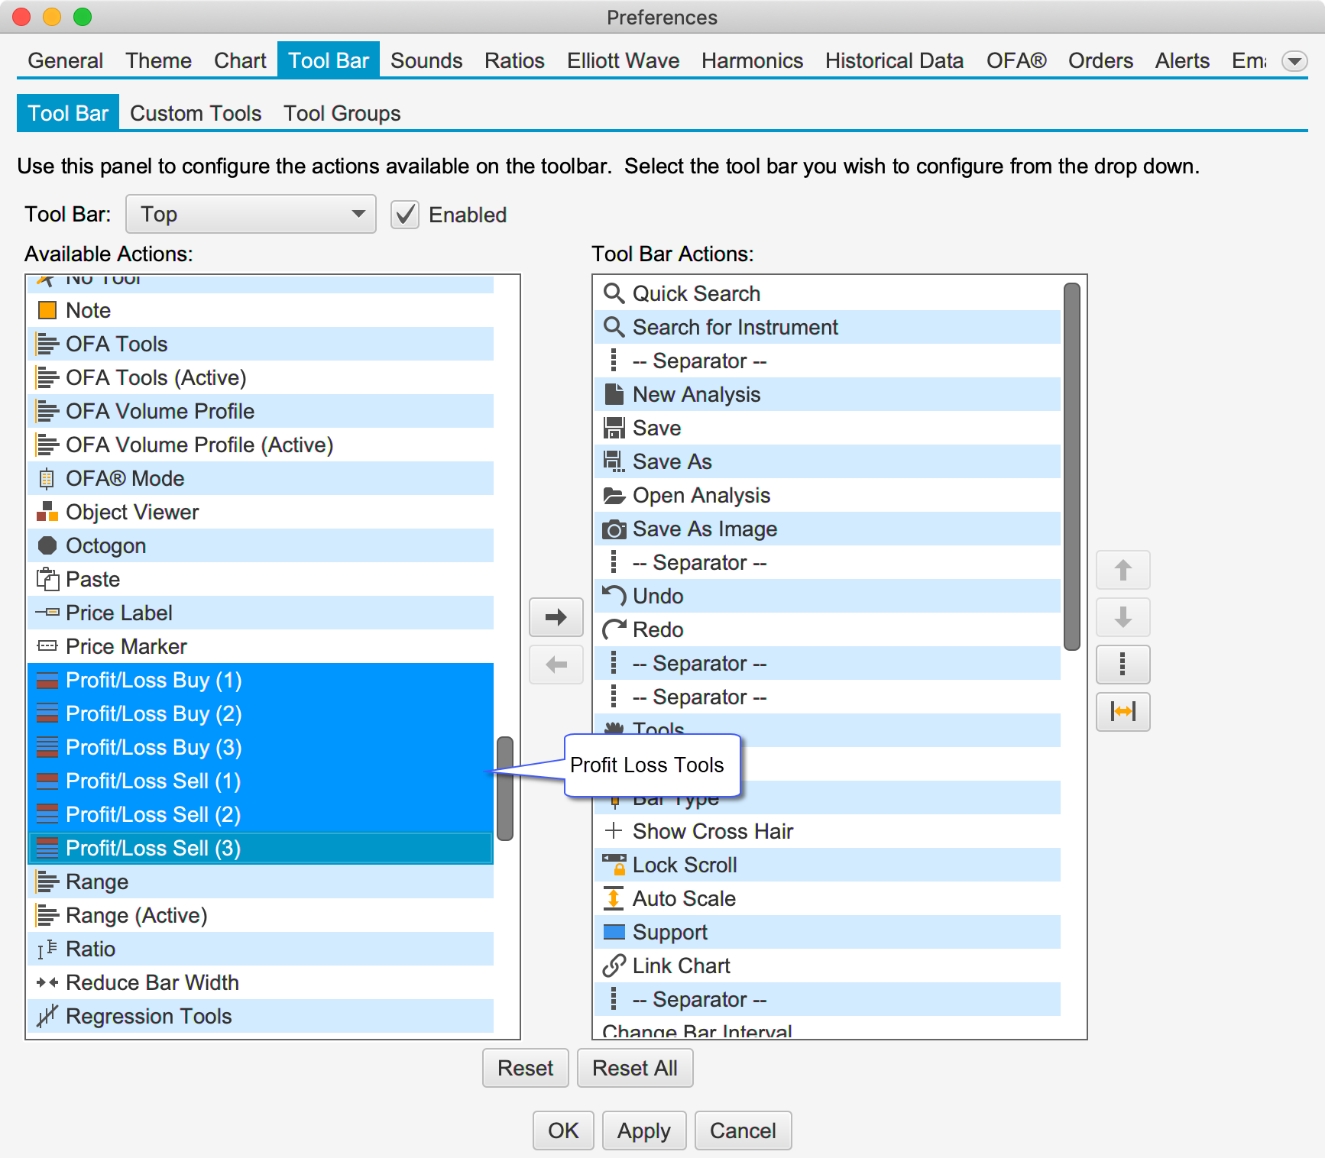
Chart Window Default Size
A default size can be applied to a chart window when they are created or popped out from the console.
Object Viewer
Components can be locked directly in the Object Viewer (View -> Object Viewer from the menu bar).
Scanner
Added the number of results in the “Scan Complete” message.
Save As Image Types
An additional image type has been added to the Save As Image action: GIF. The last saved type will be used as the default for future Save As Image actions. You can save as .PNG or .GIF
Visibility Options
Added the following visibility options to the Visibility tab (see Component Properties Dialog):
Visible On Current Bar Size Or Higher – Sets the visibility to be GTE current bar size
Visible On Current Bar Size Or Lower – Sets the visibility to be LTE current bar size.
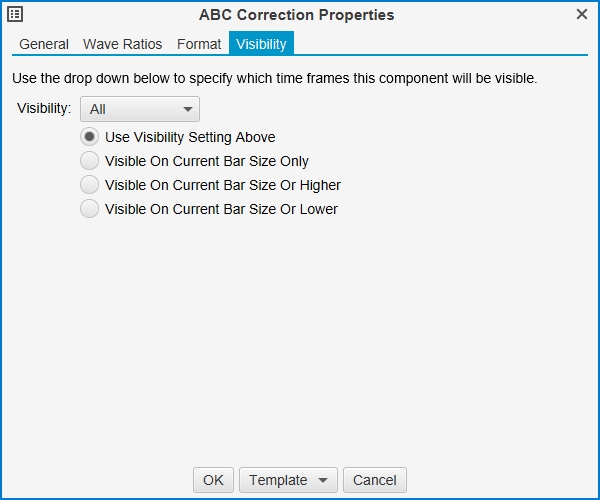
Display Bars
The display bars setting can now be set individually for the chart. See chart settings “General” tab.
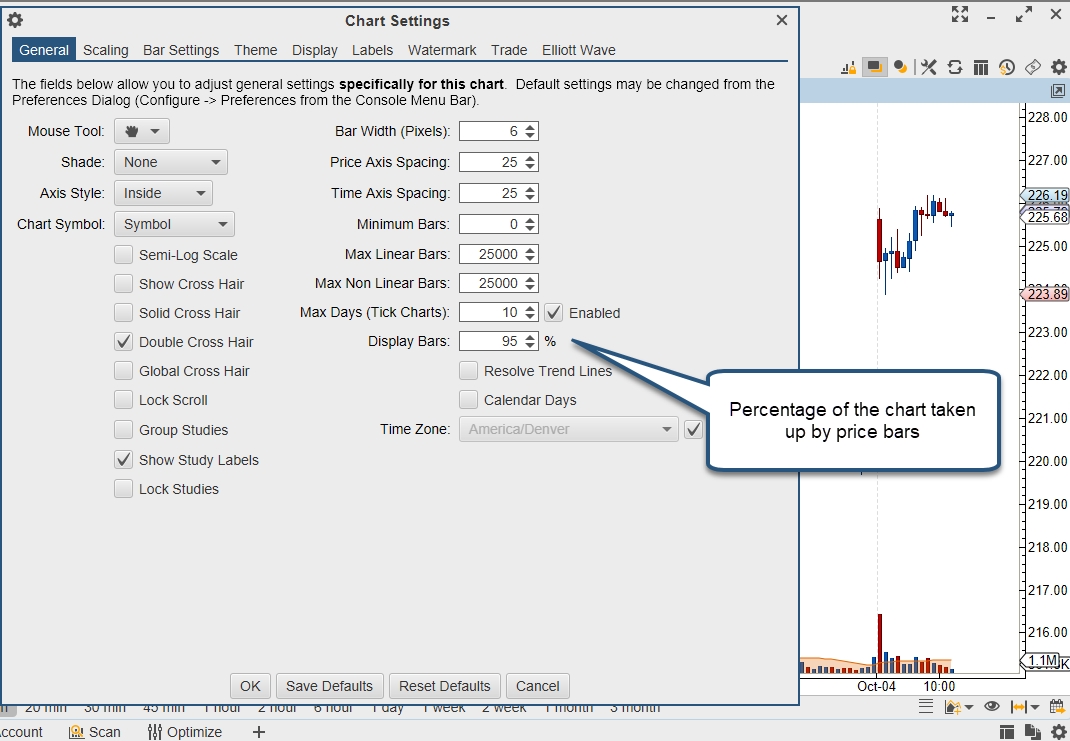
Bar Theme Price Line
The ability to change the price line for a custom bar theme has been added (when displaying a line chart vs a bar chart).
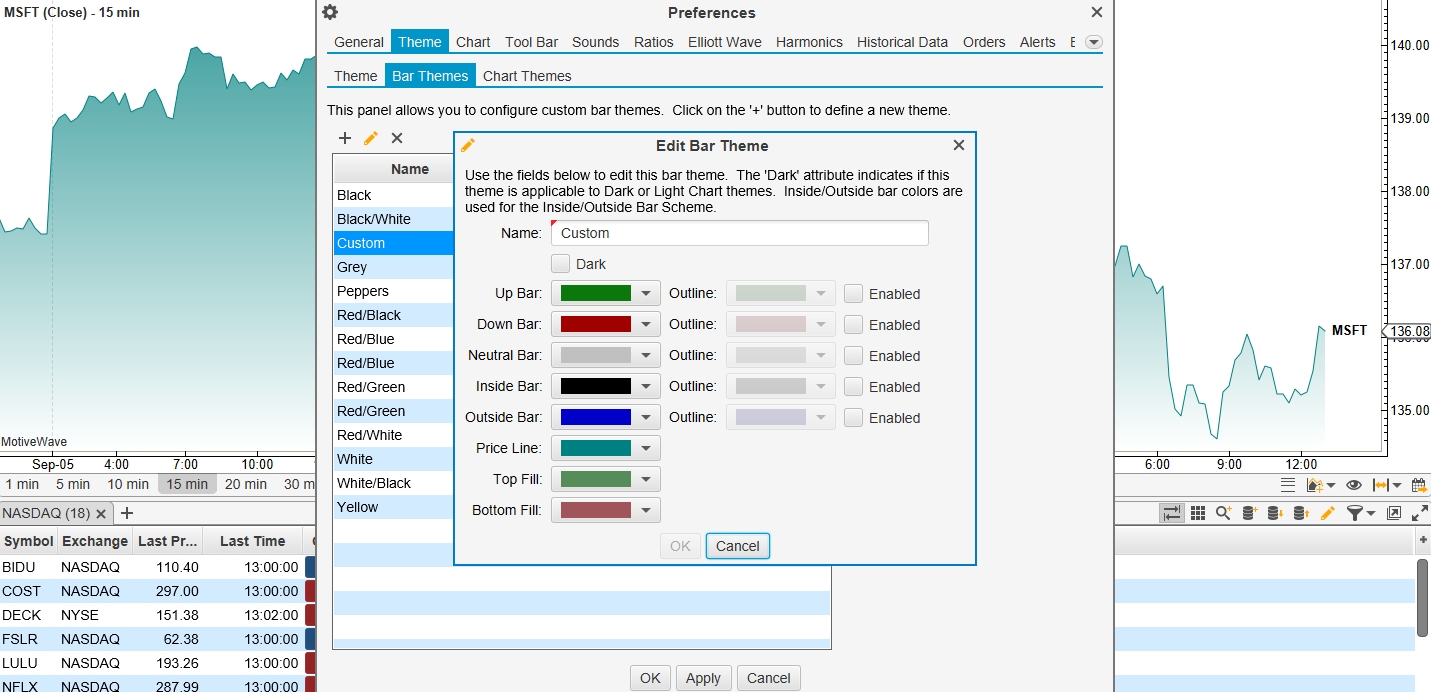
Extended vs Regular Bar Scheme
A new bar scheme has been added to color the extended and regular trading hours bars differently.
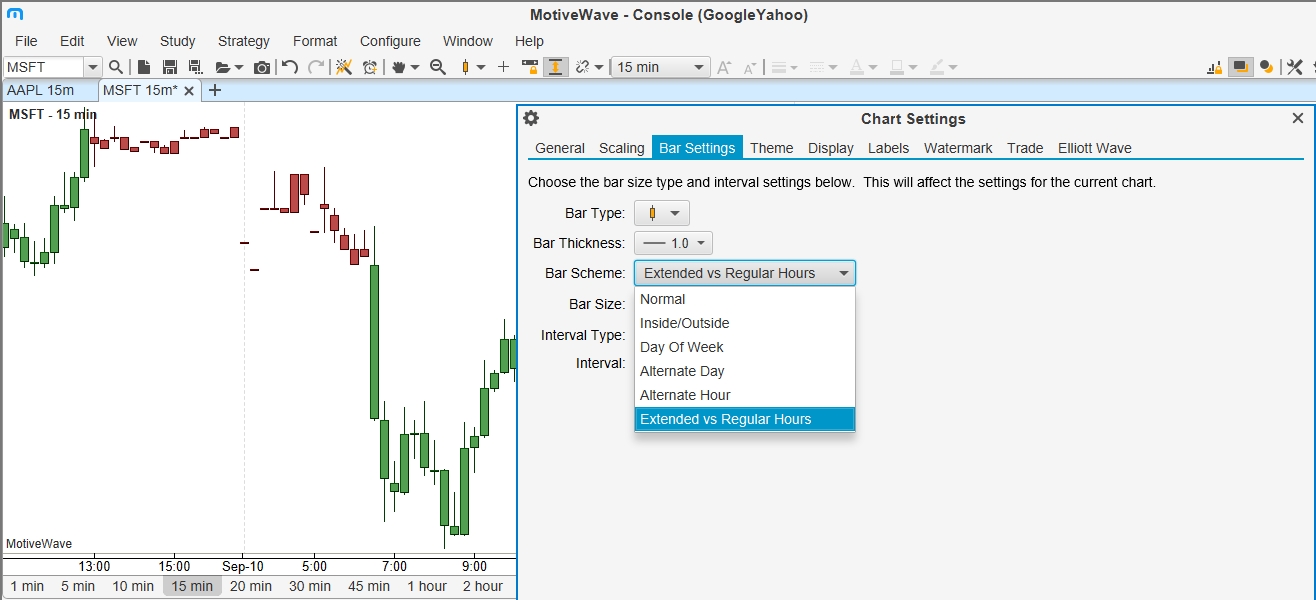
Drag Beyond Available Data
The chart can now be dragged beyond the available data leaving blank space on the left side of the chart.
Alert Close Position
An option has been added to close an open position when an alert is triggered (see Trade tab of the Alert Dialog).
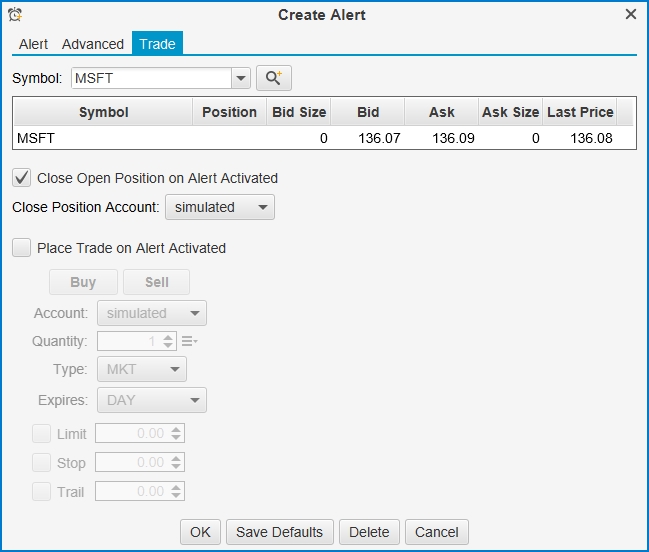
IQFeed Odd Lot Ticks
This option will enable “Odd Lot Ticks” to be visible in MotiveWave for IQFeed symbols (off by default). See General Preferences Dialog (Configure -> Preferences from the Console menu bar) -> “General” tab.
Active Chart Tab Color
The color of the dock bar/tabs for active charts can be customized in the Preferences dialog (see “Theme” -> “Theme”, “Active Chart Tab Color).
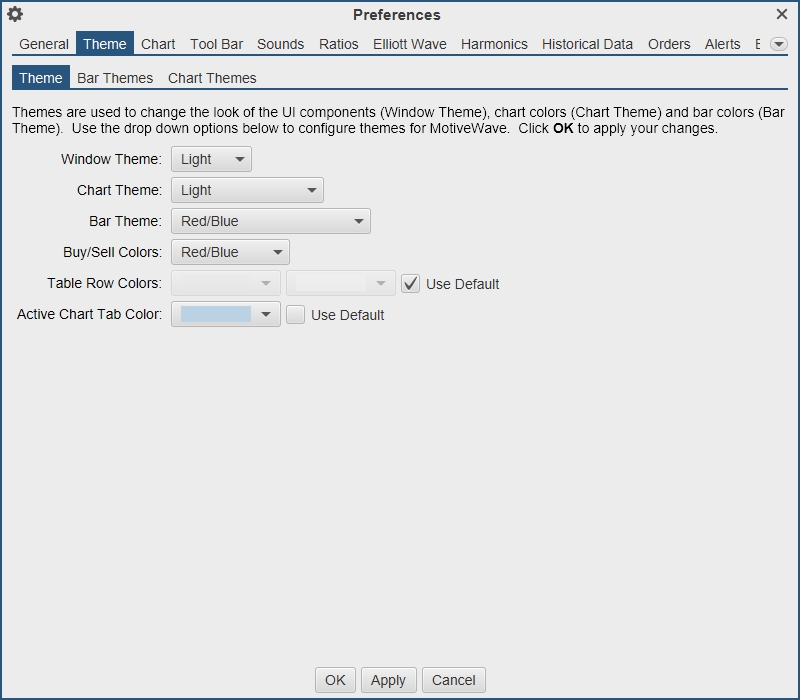
Updated Window Themes
The dark and light themes have been updated to remove station borders and present a flatter look and feel.
StockWatch Connector
This data service connector has been removed in this update since they no longer support third party applications.
Java Update
Updated to the latest version of Java and JavaFX (12.0.2).
Software Development Kit (SDK)
SDK Enhancements
The methods: getBars(…) and forEachBar(…) in the Instrument interface now support non-linear bars.
SDK Market By Order
Market by Order information has been added to the Depth of Market (DOM) classes. For each DOMRow, a list of orders (DOMOrder) is available.
Figure 1 DOMRow Interface
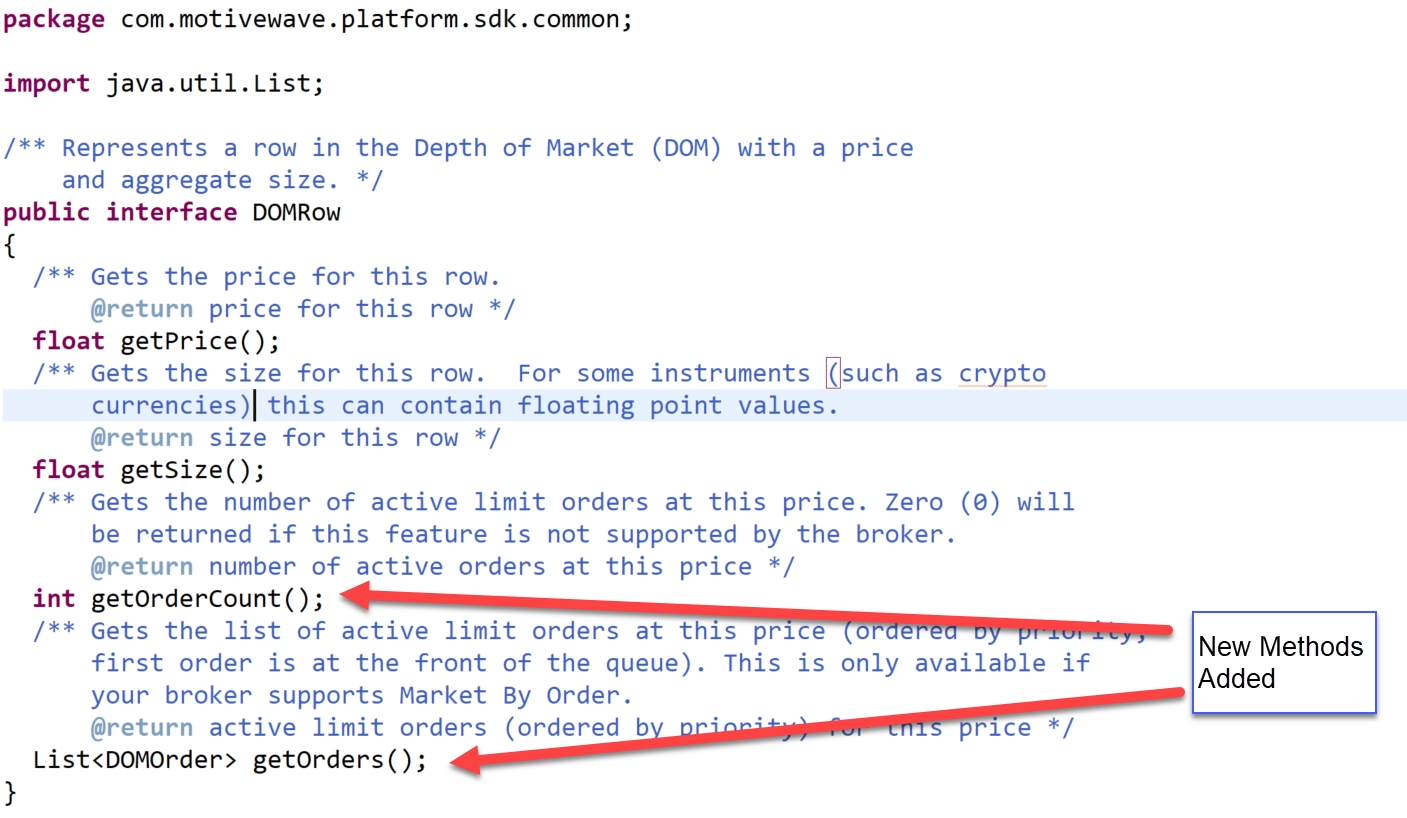
Figure 2 DOMOrder Interface

SDK Historical Data
Historical ticks and bars can be accessed directly from the Instrument interface (com.motivewave.platform.sdk.common.Instrument).
Tick Data: Use Historical Bars
For tick data, a new option has been added to the forEachTick method: useHistoricalBars. This option will generate ticks from historical bars (starting from 1 minute bars) instead of loading historical ticks. This option is useful if tick data is not available or you need to load a large amount of data (and accuracy is not as important).
Historical Bars
Historical bars can now be accessed directly (without the DataSeries interface). This allows you to access bars without declaring them in the SettingsDescriptor. Note: only linear bars >= 1 min are currently supported.
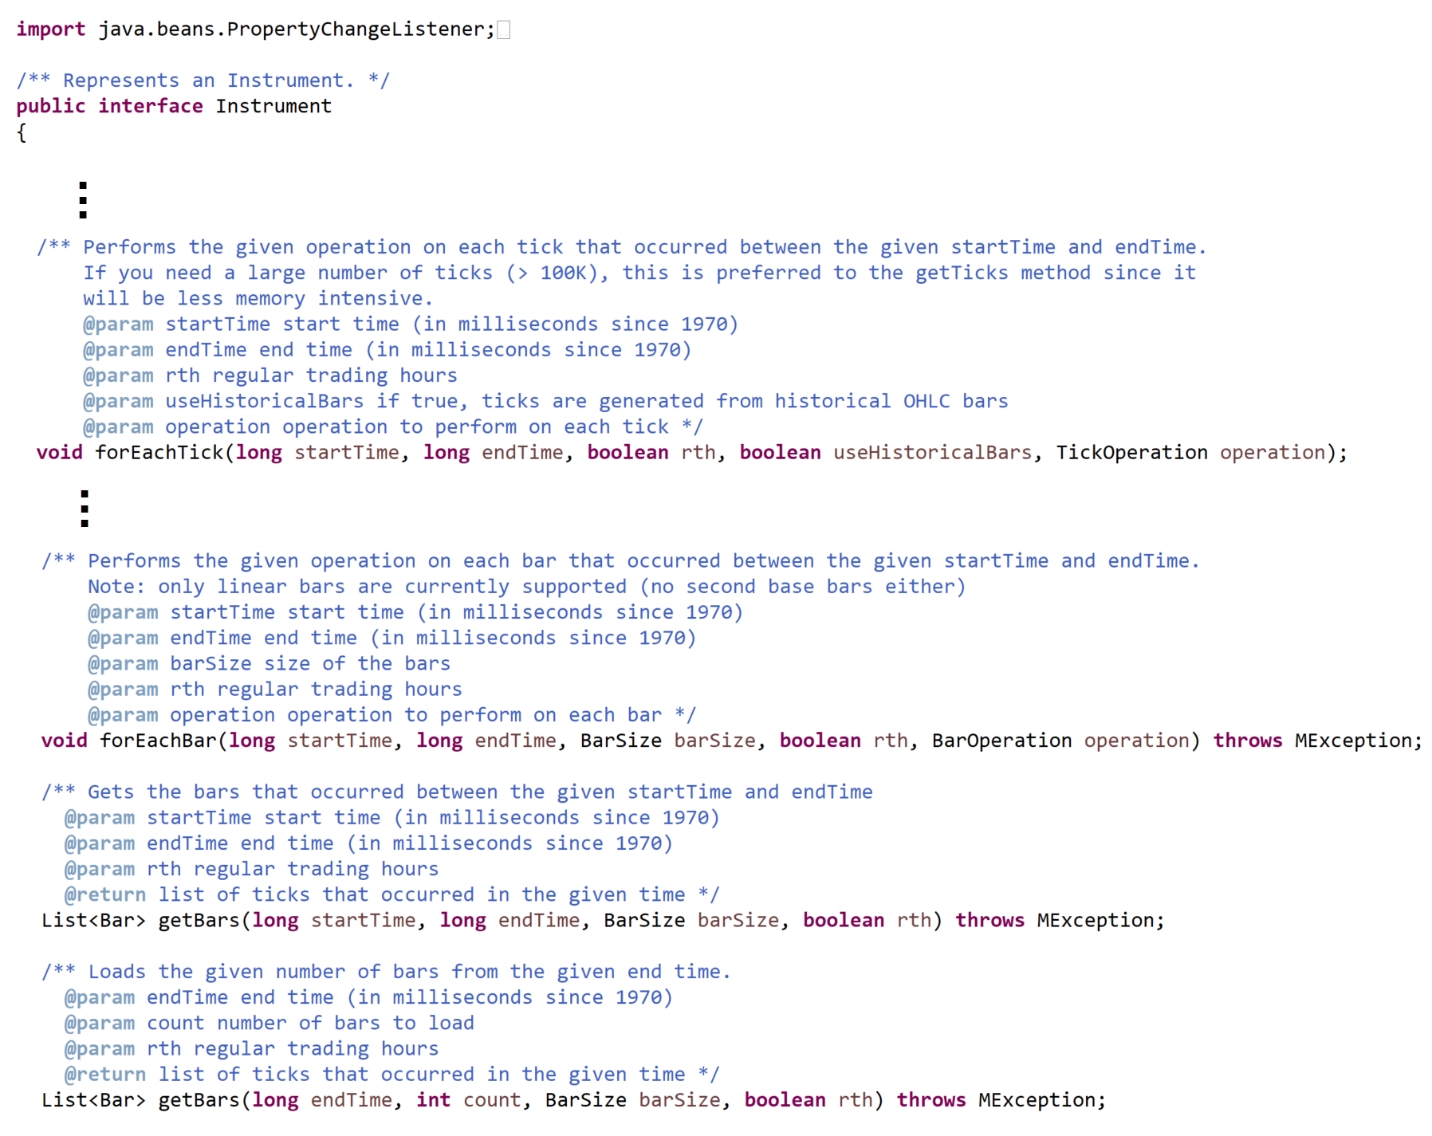
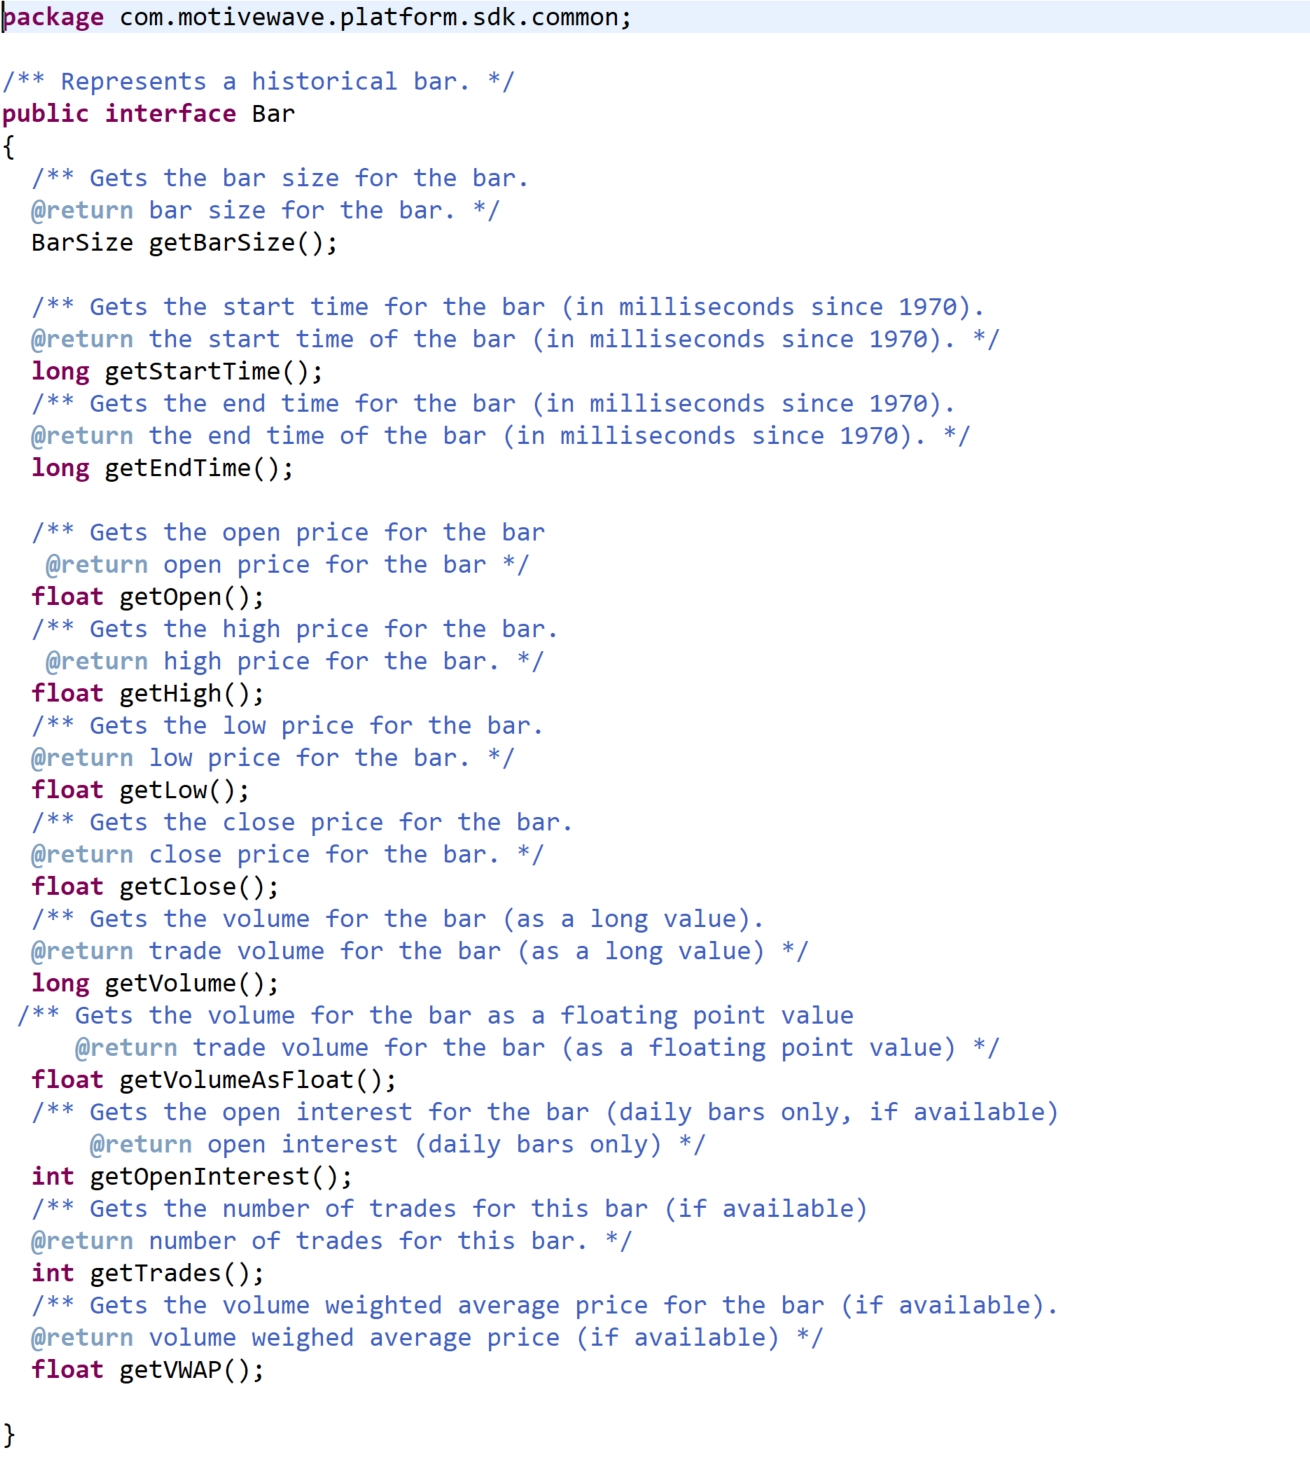
SDK Aggregate and Filter Ticks
Two new options have been added to the Study Header (false by default). If these options are enabled, the user will be able to configure the settings in the “Options” tab of the study dialog.
allowTickAggregate – If true, the user will be given the option aggregate tick data using the given aggregate period in milliseconds
allowTickFilter – If true, the user will be given the option to set a min and or max trade size to be filtered before passing the data to the study.
Affected Studies – these options have been turned on for the following studies: Volume Imprint, Delta Volume, Cumulative Delta, Bid/Ask Volume
Last updated