Different Charts for the Same Instrument
Question: If I have one chart with some studies on it, when I open another chart of the same instrument, the same studies and objects are also on this new chart. How do I get two different (independent) charts with same instrument?
MotiveWave works differently compared to many other charting programs. If you open a second chart for the same instrument, you will find that it contains the same set of studies and objects as the original chart. Changes made to either of these open charts are immediately reflected between the two open views. This can be a very useful feature if you want to work with the same set of studies and objects at multiple time frames.
If what you actually want to do is have separate studies or objects (trend lines, commentary etc) on a second chart for that same instrument (so that the changes you make do NOT copy over to the other one), then you want to create what we call an Alternate Analysis.
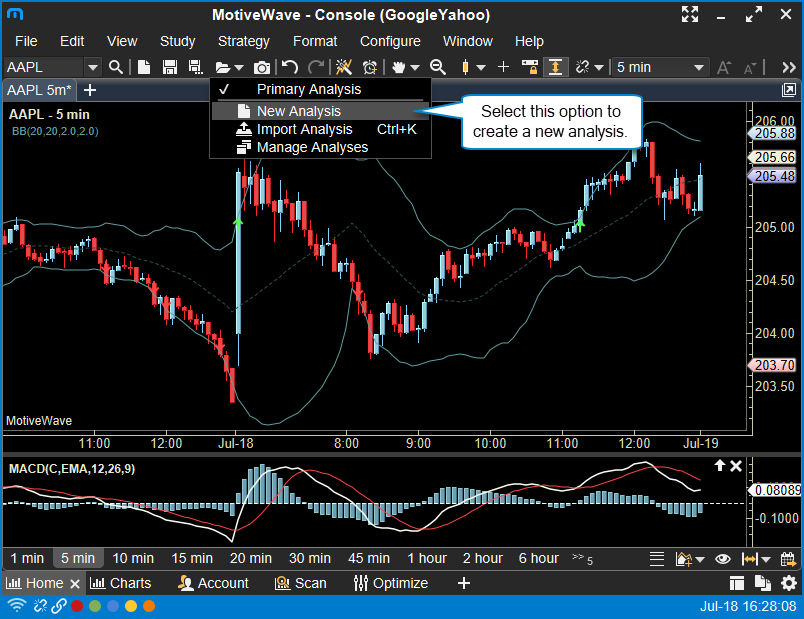
To create an Alternate Analysis, you can go to File > Chart > New Analysis, or click on the open folder icon in the toolbar and choose New Analysis. See screenshot below:

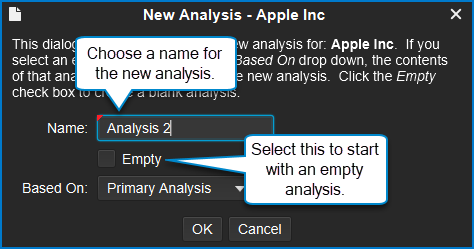
When you open the New Analysis dialog window, you will need to name your Alternate Analysis and you can also choose whether the chart should copy over everything you had on the first chart as a starting point or if it should open a fresh chart with nothing on it. If you want a fresh chart, click the Empty checkbox. See screenshot below:

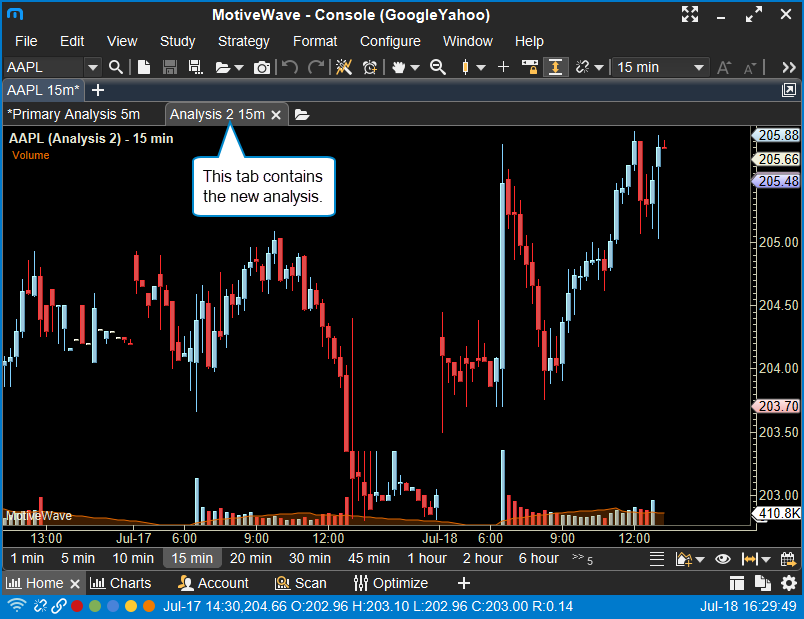
When you click OK, your new alternate analysis will appear as a second tab on the chart and any changes you make to the primary analysis (original chart) and the alternate analysis will be saved separately. See screenshot below:
