MotiveWave Docs
MotiveWave.com
  • User Guide
    • Welcome
    • Quick Start Guide
      • Getting Started
      • Installation
      • Customization Options
      • Advanced Features
      • Troubleshooting and Support
      • Next Steps
    • Console Overview
      • Preferences
      • Changing the Look and Feel
      • Desktops
      • Quote Sheets
      • Backup and Restore
      • Repository
      • Email Configuration
      • Docking Framework Guide
        • Introduction
        • Stations
        • Pages
        • Layouts
        • Customization
    • Accounts Panel
      • Simulated Account
      • Commissions
    • Alerts
    • Charts
      • Settings
      • Chart Spacing
      • Bar Sizes
      • Importing Data
      • Exporting Data
      • Birds Eye View
      • Cursor Data
      • Depth Of Market
      • Chart Labels
      • News
      • Watermark
      • Scaling
      • Analyses
      • Ratios
      • Time and Price Guides
      • Percent Change Charts
      • Software Development Kit
      • Lock Studies
      • Lock Scroll
      • Study Templates
      • Linking Charts
      • Working With Chart Windows
      • Ticker Tape
      • Chart Trading
      • Data Export Groups
      • Analyses Guide
        • Introduction
        • Managing Analyses
        • Sharing Analyses
    • Components
    • Depth Of Market
    • Elliott Wave
    • Hurst Cycles
      • Introduction
      • Study Overview
      • Using the Hurst Cycle Study
    • Instruments
      • Custom Instruments
    • Option Chain
    • Order Flow
      • Introduction
      • Time Price Opportunity (TPO) Study
      • Volume Imprint
      • Depth of Market
      • Time and Sales
      • Delta Volume
      • Cumulative Delta
      • Bid/Ask Volume
      • Speed of Tape
      • DOM Power
      • Order Heatmap
      • Big Trades
      • Speed Gauges
      • Components
    • Pages
    • Preferences
      • General
      • Theme
      • Chart
      • Toolbar
      • Sounds
      • Ratios
      • Elliott Wave
      • Harmonics
      • Historical Data
      • Orders
      • Alerts
      • Email
      • Trade History
      • Buy/Sell
    • Replay Mode
    • Scanner
      • Scanner
      • Creating a Scan
      • Executing a Scan
      • Editing a Scan
      • Elliott Wave Scanner
      • Harmonic Scanner
      • Study Scanner
    • SDK Programming Guide
      • Preface
      • Change History
      • Introduction
      • Fundamental Classes
      • Overlay Example
      • Study Plot Example
      • Drawing Figures
      • Signals
      • Tick Data
      • Strategies
      • Logging
      • Internationalization
      • Deployment
      • Environment Setup
    • Shortcuts
    • Strategies & Backtest
      • Strategy Back Testing
      • Creating a Strategy Analysis
      • Strategy Analysis
      • Strategies
    • Studies
    • Time and Sales
    • Tool Bar
    • Trade Report
    • Watch List
    • Workspaces
  • Release Notes
    • Release Notes
    • What's New In Version 6.5
    • What's New in Version 6.4
    • What's New in Version 6.3
    • What's New in Version 6.1
    • What's New in Version 6.0
  • Knowledge Base
    • Getting Started
      • Add a Symbol to a Watch List
      • Create a New Page
      • Create a New Workspace
      • Free Data Sources
      • Linux Installation
      • Resize Console Panels
      • Set Up a Simulated Account
      • Does MotiveWave Come With Data?
      • Can MotiveWave Be Used on Multiple Computers?
      • Futures Symbol Table
    • Connection
      • Connection Details
      • Add a Connection to a Workspace
      • Rithmic - Connection Issues and Troubleshooting
      • Connect MotiveWave to R|Trader Pro Gateway
      • GAIN Connection
      • Indian Market Connections
      • Interactive Brokers Connection
        • Troubleshooting Interactive Brokers Connection
        • Historical Data is Slow with Interactive Brokers
      • CQG Symbology
      • TD Ameritrade Search
      • Rithmic Eurex Symbology
      • Computer Sleep Mode
      • IQFeed Data
      • Another Instance of MotiveWave Is Using License Key
    • Workspace
      • Add a Connection to a Workspace
      • Create a New Workspace
      • Create a Workspace Backup
      • Restore a Workspace Backup
      • Switch Connections in a Workspace
      • Workspaces Not Showing Up
    • Charts
      • Adjust for a Stock Split
      • Assign Trading Hours to an Instrument
      • Component and Study Visibility
      • Different Charts for the Same Instrument
      • Make Studies Stick to a Chart
      • Trend Lines Don't Line up on Different Bar Sizes
      • Use a Display Mask
      • Create Tick, Range, PnF, or Renko Chart
      • Clicking on the Tab of One Chart Changes Tab of Other Charts
      • Charts Stopped Streaming Data
      • Charts Show Incorrect Historical Data
      • Time Range Measurements Are Incorrect
      • Limited Tick Data on Charts
      • Set Start Time for Chart Bars
      • View List of Studies and Components on Chart
      • Show ETH or Extended Data
    • Trading
      • Position Average Is Changing Overnight
      • Execute Trades on Another Account
    • General
      • Change Themes
      • Define Trading Hours
      • Futures Contract Backfill
      • Reset the Console Layout
      • Set a Default Account
      • Set Up a Repository
      • Set Up Gmail for Email Alerts
      • Set Up iCloud Mail for Email Alerts
      • MotiveWave Covers Windows Taskbar
      • Limit Instruments in Quick Search
      • Can’t See My Menu Anymore
      • Trade Report Is Incorrect
    • Study
      • Component and Study Visibility
      • Order Heatmap Study Not Showing
      • Forex With Volume Related Studies
      • Add a Custom Study
      • Volume Imprint or TPO Overlap
      • Use Real Values
    • Elliott Wave
      • Elliott Wave Data Window vs Start Date
      • Elliott Wave Functionality
      • Show Multiple Elliott Wave Ratios
      • Stacked Wave Labels
    • Scan
      • What Do the Scanner Results Fair, Good, Etc. Mean?
    • SDK
      • Create a Custom Study or Strategy
    • Optimize - Backtest
      • Backtesting Limitations
    • Support
      • Access Log Files
      • Active Session Exists
      • Create a Workspace Backup
      • Find My License Key and Edition
      • Minimum System Requirements
      • MotiveWave Extensions Directory
      • Uninstall MotiveWave
      • Data Loss
      • Trendlines Shift on Nonlinear Charts
      • Slow Application Performance
    • Error Messages
      • Forex.com - Error Placing Order: 75
      • Binance - Connection Failed: Invalid API Key
      • Binance Futures - Unable to load listen keys
      • IQFeed - Error: Index 1 out of bounds for length 1
      • IQFeed - Connection Failed
      • State Error
      • Error Placing Order(s)
    • Purchase
      • Upgrade from a Lease to a Purchased License
      • Upgrade from a Lower Edition Purchased License to a Higher Edition Purchased License
      • Recently Purchased Where Is My License Key?
      • PayPal Payments
      • How Do I Cancel My Lease?
      • Are Updates to the Software Free?
    • FAQ
      • Can I Add Commentary
      • Can I Have a Simulated and a Live Trading Account
      • Can I Have More Than One Broker Account
      • Can I Save My Analysis
      • Can I Trade from the Chart
      • Can I Use MotiveWave on Multiple Computers
      • Does MotiveWave Support macOS
      • Does MotiveWave Support Multiple Computer Screens
      • How Do I Log in to MotiveWave
      • How Do I Make Point & Figure and Hybrid Renko Charts
      • How Do I Position and Size the Chart Windows on a Specific Screen
      • How Do I Save My Charts
      • How Do I Sync MotiveWave Between Two Computers
      • What Instruments Does MotiveWave Support
      • What Is Compact Mode for Chart Windows
      • Where Are the Chart Tools
  • Video Tutorials
    • Product Demos
    • Startup and Installation
    • Workspaces
    • Broker and Data Feed Connections
    • Overviews
    • General Configuration
    • Configuring Preferences
    • Charts
    • Analyses vs Alternate Analyses
    • Studies and Strategies
    • Trading
    • Alerts
    • Replay Mode
    • Scanners
    • Fibonacci
    • Harmonics
    • Elliott Wave
    • Webinars
    • Third Party Webinars
  • Studies
    • A - B
    • C - D
    • E - F
    • G - H
    • I - J
    • K - L
    • M - N
    • O - P
    • Q - R
    • S - T
    • U - V
    • W - X
    • Y - Z
Powered by GitBook
On this page
  • Settings
  • Cycle Type
  • Data Range
  • Tolerance
  • Cycle Model
  • Other Options
  • User Interaction
  • Context Menu
  • Resize Points
  1. User Guide
  2. Hurst Cycles

Study Overview

PreviousIntroductionNextUsing the Hurst Cycle Study

Last updated 12 months ago

In this section we explore the elements of the Hurst Cycle study in MotiveWave™. The screen shot below contains a sample Hurst Cycle study overlaid on an S&P 500 daily chart:
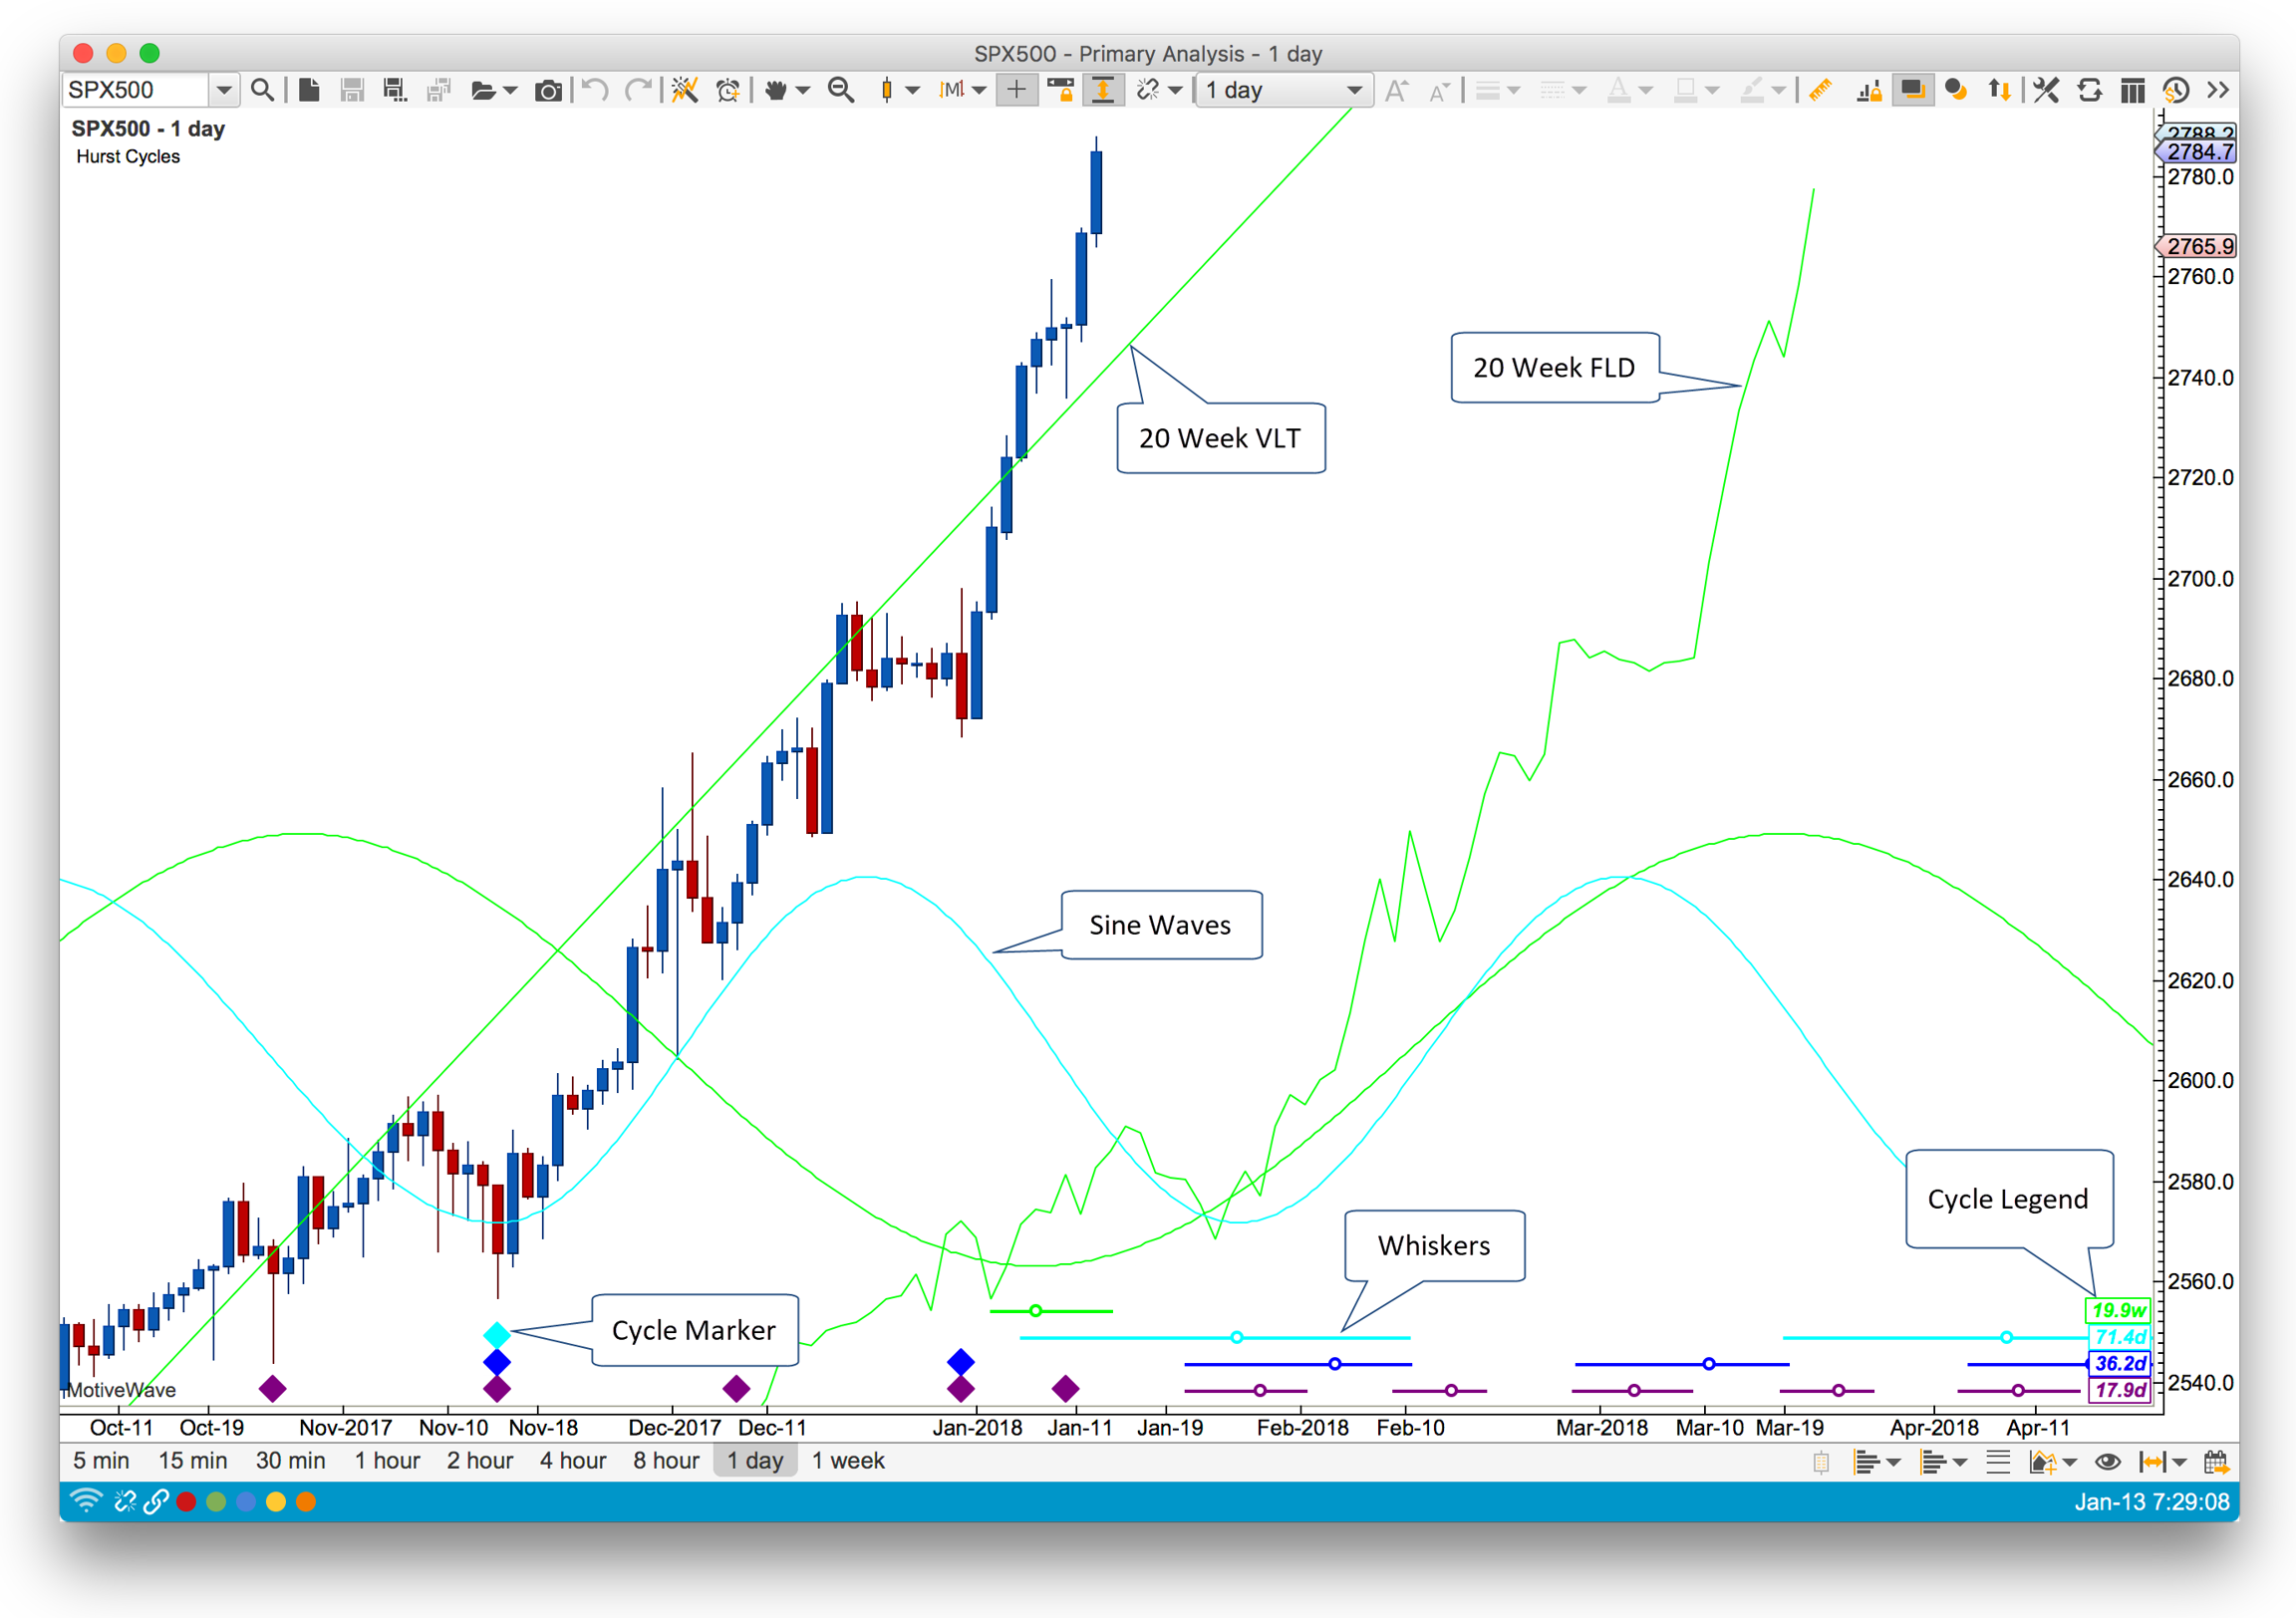
Study Components:

  • Cycle Marker – These markers indicate where they cycles begin and end for each cycle that is plotted in the study. The color of the marker indicates the cycle degree to which the marker belongs.

  • Whiskers and Circles – Each whisker (a colored horizontal line with a small circle) delineates the possible range for the completion of the next cycle. The circle on the line is the location of the average cycle length (computed from the plotted cycle markers)

  • Cycle Legend – Identifies each cycle degree (by color) and gives the average computed cycle length.

  • Sine Waves – Sine waves may be plotted for each cycle. These can be useful to visually identify where the cycle troughs line up for multiple cycles.

  • Semi Circles – (not shown) optionally semi circles may be use identify there the cycles begin and end.

  • VLT – Valid Trend Line. A VLT may be drawn by connecting the two most recent price troughs for a cycle. VLTs are often used to validate (or invalidate) the location of the cycle markers.

  • FLD – Future Line of Demarcation. This line plots the midpoint of each candle and transposes it by half the cycle period into the future.

Settings

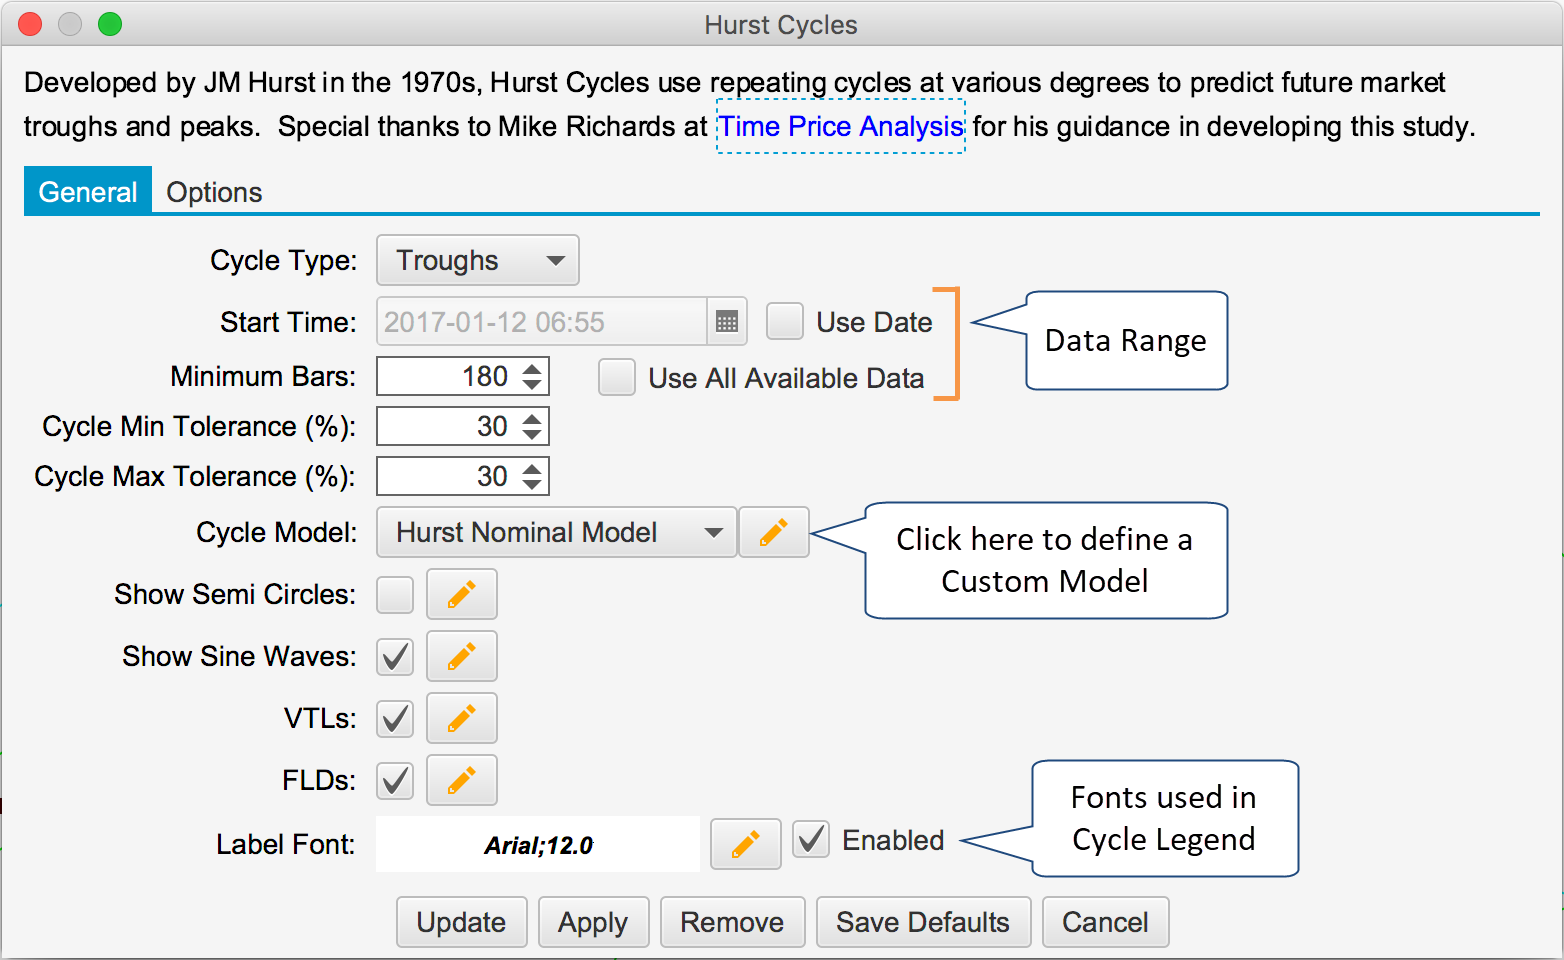
The following screen shot shows the available settings for the Hurst Cycles Study.
Cycle Type

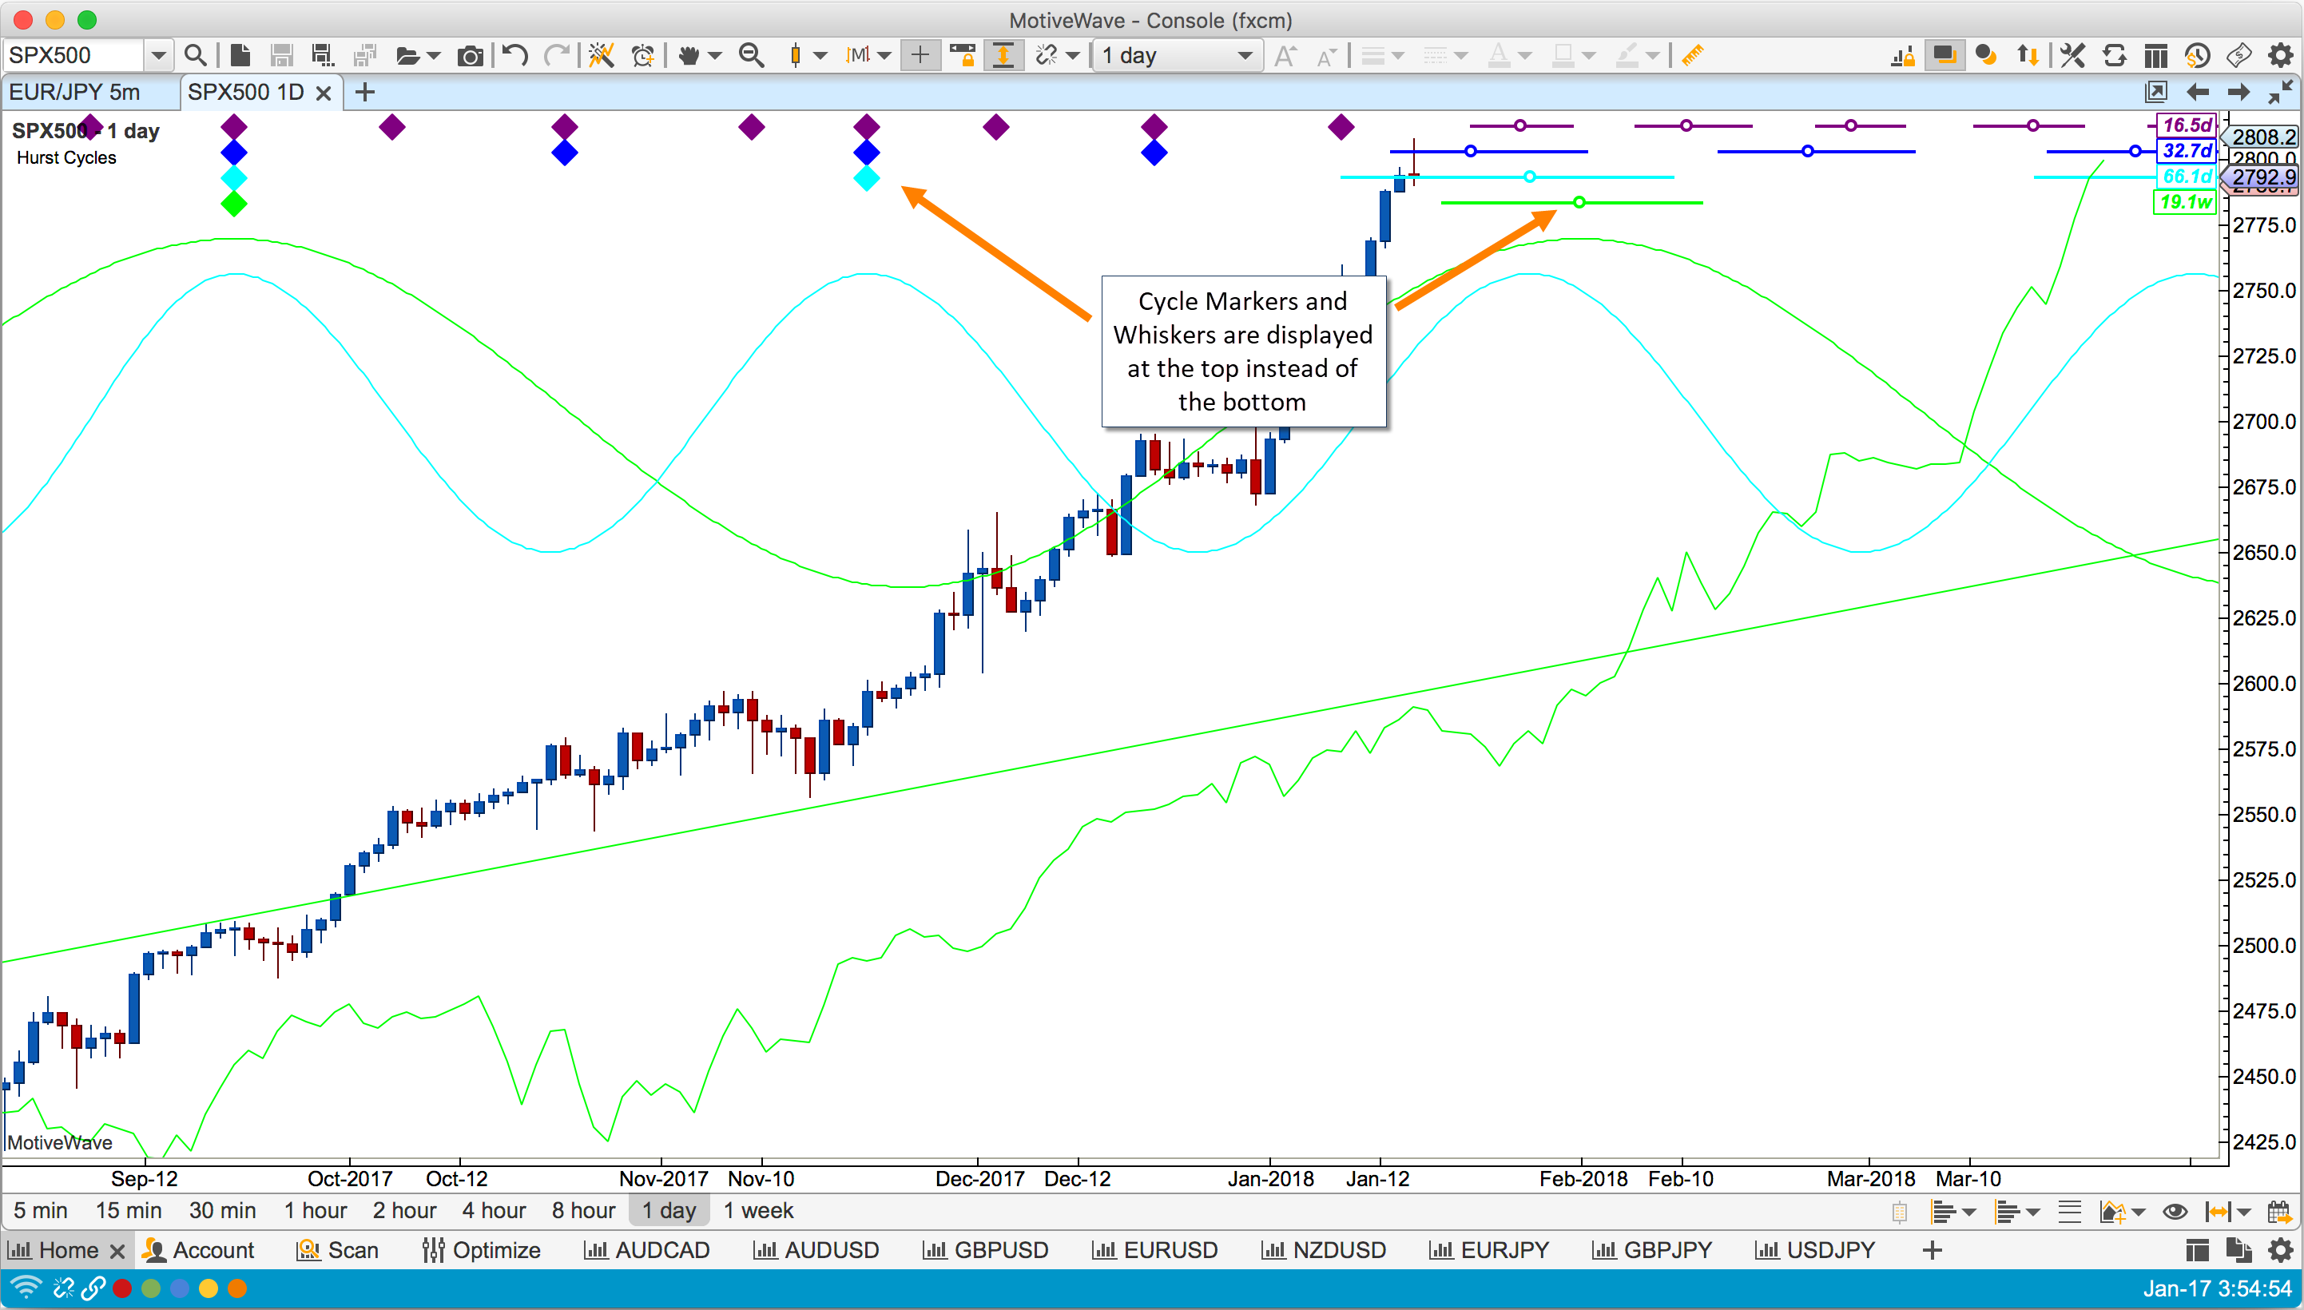
JM Hurst’s original cyclic theory only applied to price troughs. You can however switch this mode to analyze the price peaks instead. In “Peaks” mode the study is displayed at the top of the chart (instead of the bottom). This enables you to display both a Peaks and a Troughs study on the same chart. The screen shot below shows the Hurst Cycles study with the Cycle Type parameter set to “Peaks”:
Data Range

The data range settings are very important for the pattern matching algorithm inside the Hurst Cycles study. The available range of data directly determines the top level cycle degree (since this is time based). Once the top level markers are determined, MotiveWave will recursively “decompose” each cycle degree using the harmonic relationships and tolerance to find the best matching peaks/troughs. The following options may be used to determine the range of data available to the study:

  • Start Time – Use this option to specify a specific start date/time. MotiveWave will place the first (top degree) cycle marker at this point (or closest significant price trough/peak).

  • Minimum Bars – This option will ensure that MotiveWave loads the specified minimum number of bars (provided the historical data is available from your broker/data service). However, more data may be loaded if the user scrolls back in time or another study requires more data.

  • All Available Data – Use this option to load all data from the local cache of historical data. Note: this option will not enforce minimum number of bars to be loaded.

Tolerance

Hurst’s principle of variation states that the wave length of each cycle will vary. The Cycle Min/Max Tolerance settings enable to you set boundaries on how much the wave length will vary.

Consider for example the 10 Day cycle (which actually has a wave length of 8.5 days). If the minimum tolerance is set to 20% and the maximum tolerance is set to 30%, then the range for this cycle is:

  • Minimum Length: 6.8 Days (8.5 – 8.5*0.20)

  • Maximum Length: 11.05 (8.5 + 8.5*0.30)

It is very important to ensure that the tolerance settings do not cause the wave lengths of the cycle degrees to overlap. For example a min/max tolerance of 100% would cause most cycles to overlap with their parent cycles in the Hurst Nominal Model.

Cycle Model

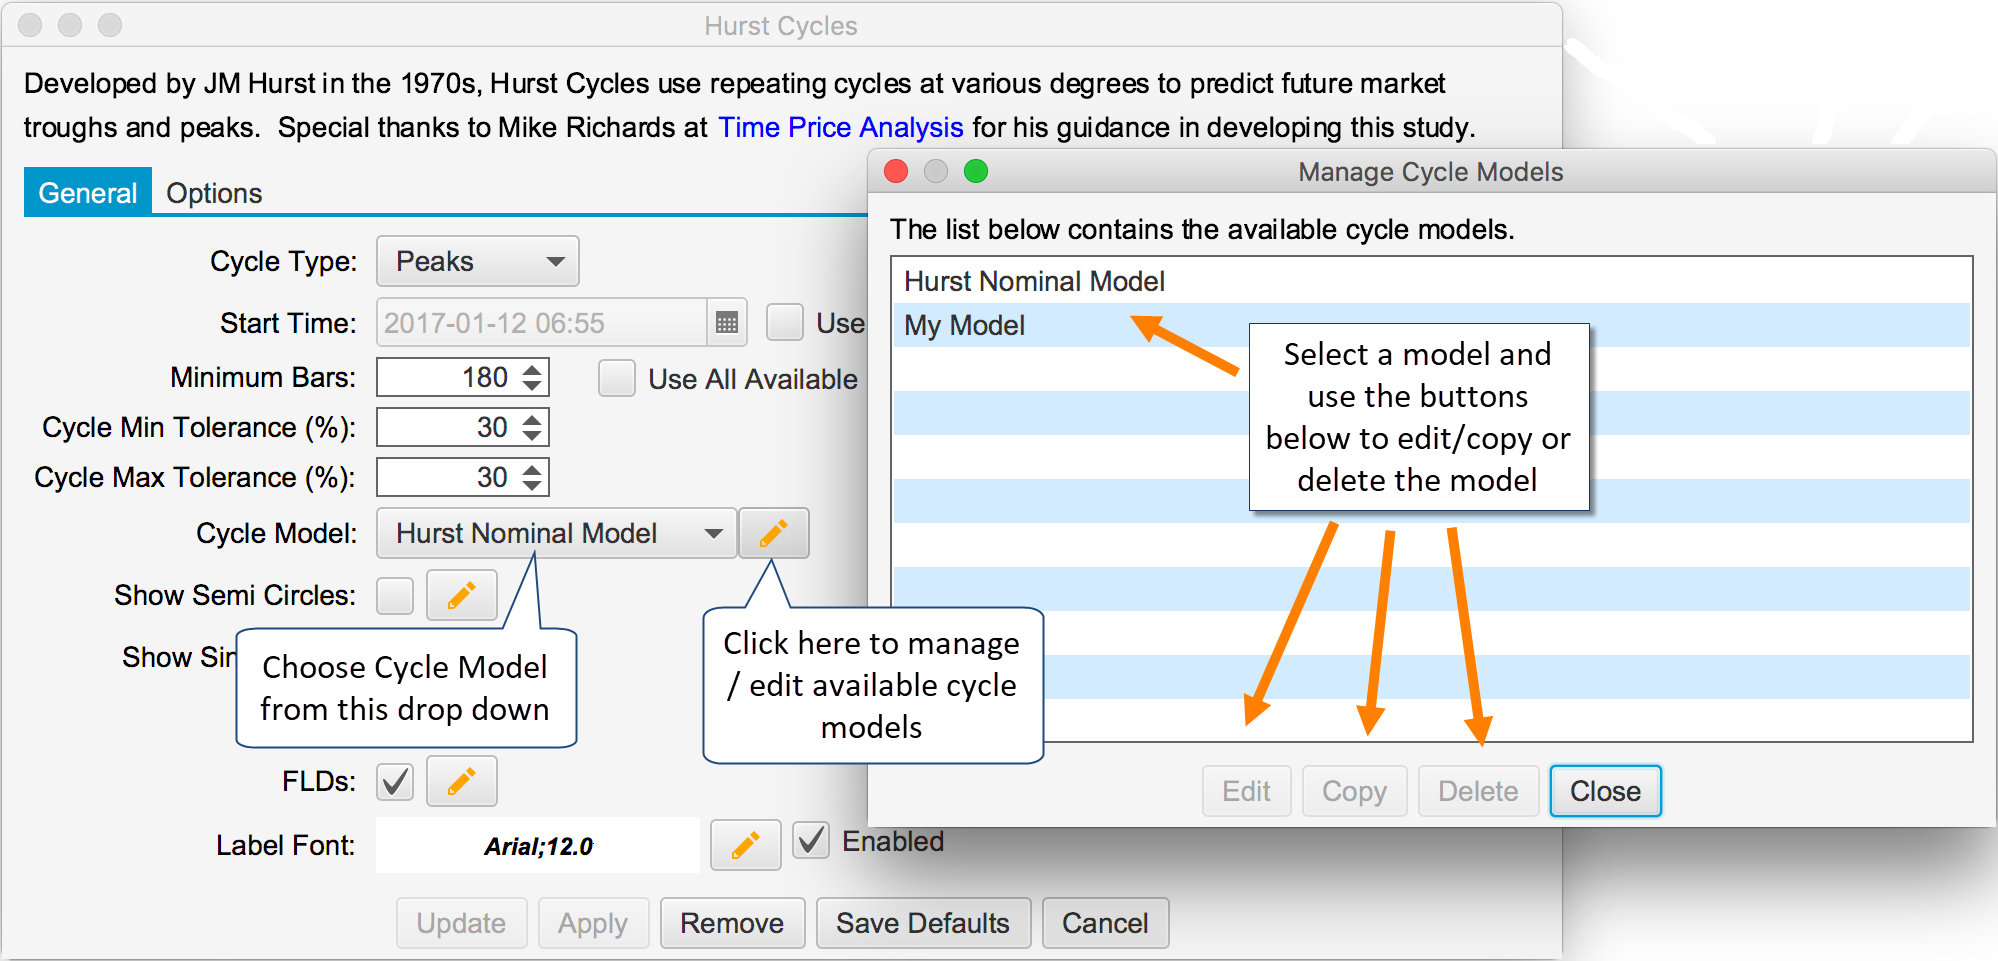
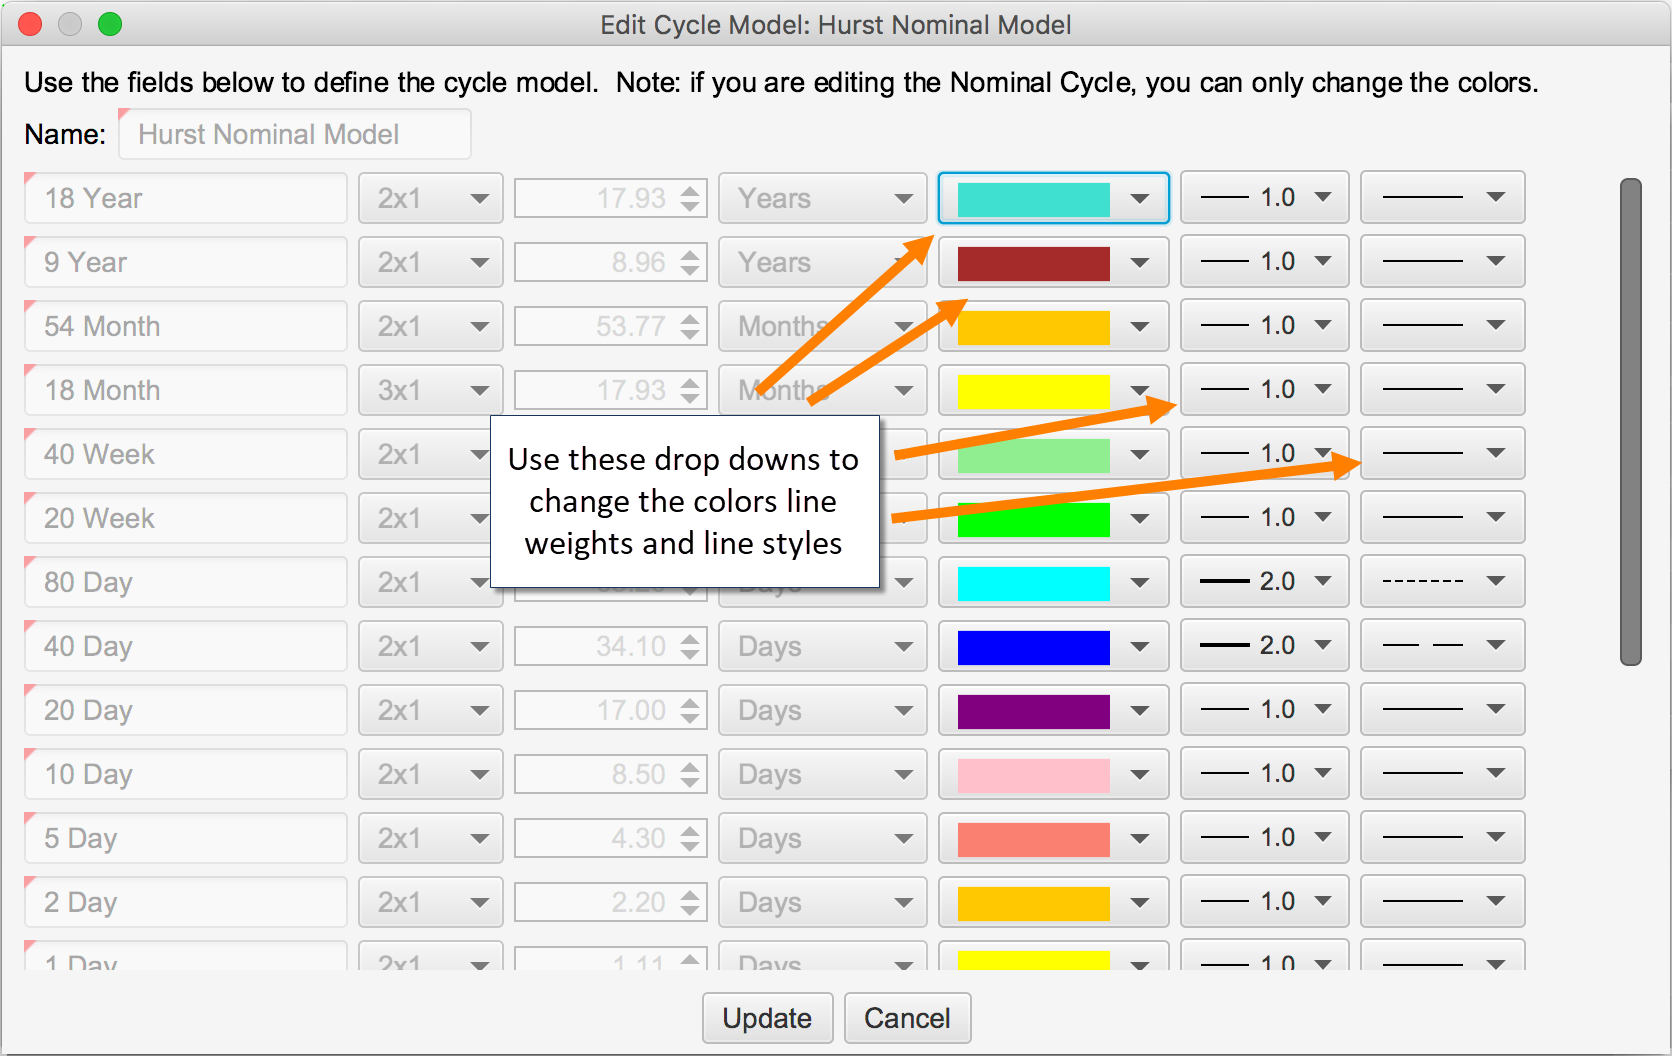
By default, MotiveWave™ will use the Hurst Nominal Cycle Model for its cyclic analysis (which has been expanded with the intraday cycles developed by David Hickson). You can modify the colors and line weights/styles for this model, but the cycle lengths and harmonic ratios cannot be changed.

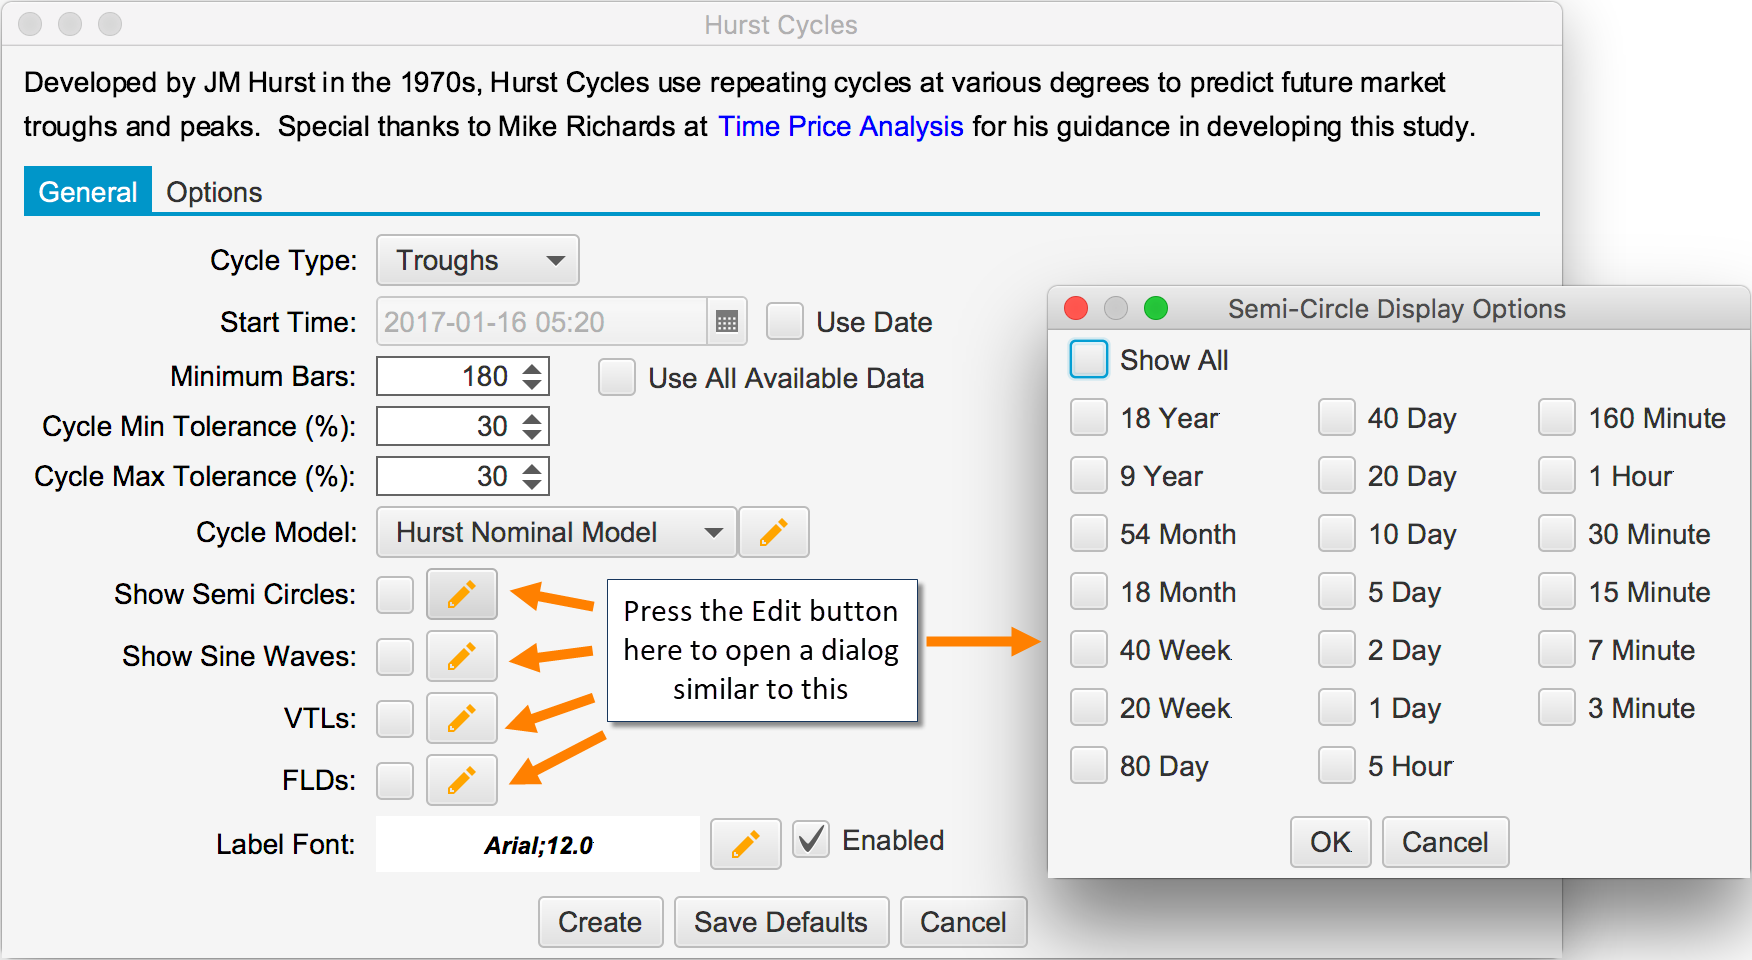
Additional cycle models may be defined and used instead of the Hurst Nominal Cycle Model. Click on the edit button (pencil icon) next to the Cycle Model drop down. From the Manage Cycle Models dialog, a new cycle model can be created by selecting an existing model and pressing the “Copy” button.
Editing the Hurst Nominal Model

You can adjust the colors of the cycle markers and the line weights/styles for the built-in Hurst Nominal model. Select the model in the Manage Cycle Models dialog (see previous section) and click on the “Edit” button. You can choose the color and line weight/style for each cycle degree from the active drop down buttons.
Creating Custom Models

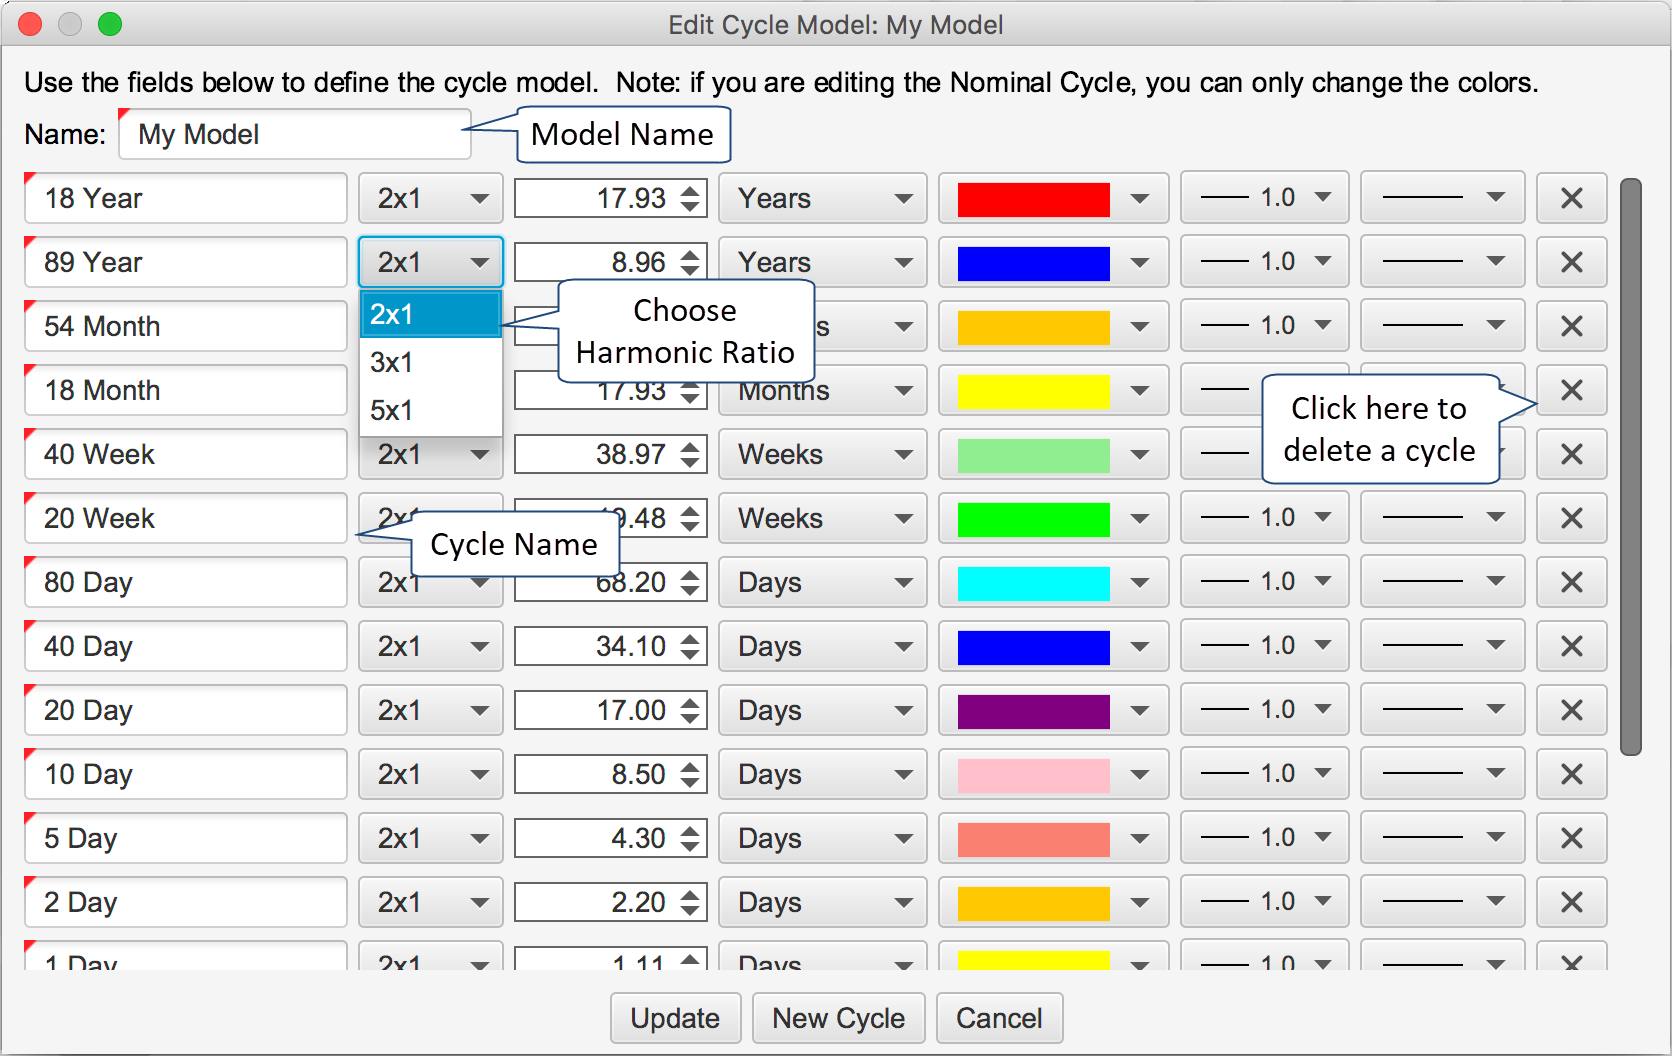
Custom models can be created by copying an existing model and modifying its properties (see Manage Cycle Models dialog above). Once you have copied an existing model, press the Edit button from the Manage Cycle Models dialog to open the cycle editor dialog (see below). You can add or remove existing cycles and change the cycle names, wave lengths, colors and harmonic ratios.
Other Options

The following options can be configured to be displayed for all or specific cycles on the chart. The available cycles will depend on the Cycle Model that was chosen for the study.

  • Semi Circles

  • Sine Waves

  • VTLs

  • FLDs

User Interaction

After the Hurst Cycles study is added to a chart, you can interact with it directly through the following:

  • Context Menu – Right click on the study to display a custom context menu for configuring some of the study options

  • Resize Points – Resize points are displayed for the top level cycle markers. You can adjust the location of some or all of the cycle markers to override the automatic placement of cycle markers using the built-in pattern recognition algorithm.

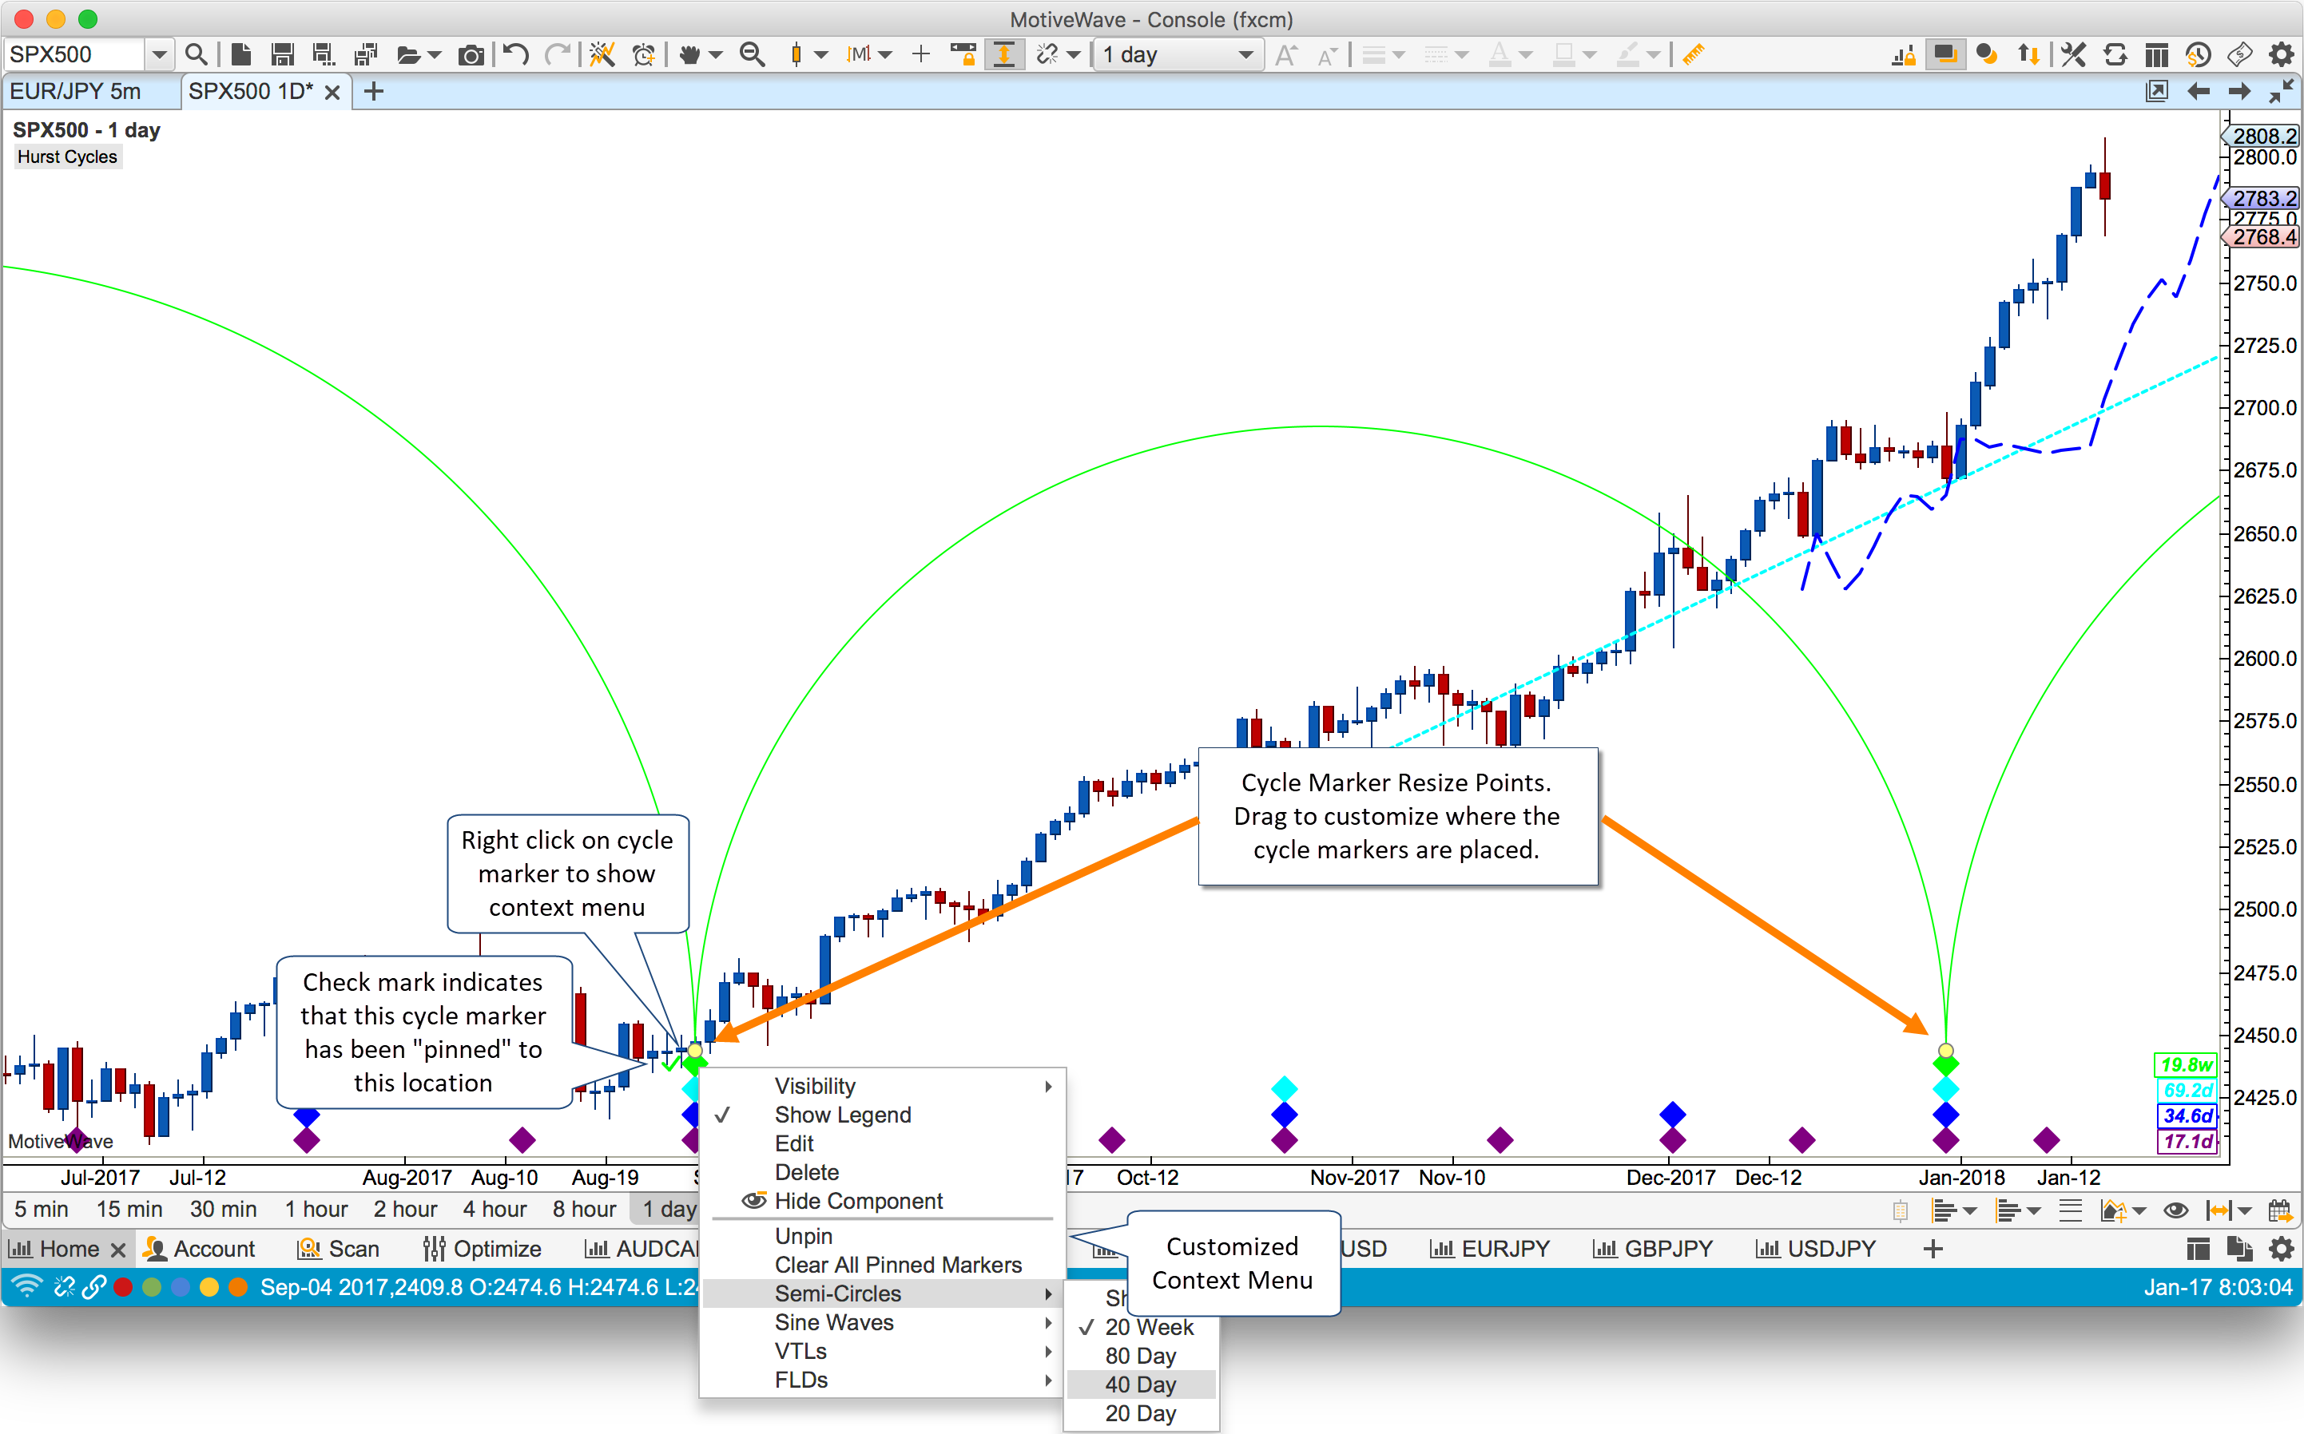
The screen shot below illustrates user interaction points with the Hurst Cycles study (without opening the study properties dialog):
Context Menu

From the context menu, you can quickly show or hide Semi-Circles, Sine Waves, VTLs or FLDs or specific cycle degrees. In addition, the context menu also has the following options:

  • Unpin – If the cycle marker at the right click location has been pinned (dragged to a specific location) this option will allow the study to automatically adjust the marker location using its pattern matching algorithm. This option will not be available it the selected cycle marker has not been pinned.

  • Clear All Pinned Markers – removes all the user defined positions for the cycle markers. This tells the study to automatically choose the highest scoring peaks/troughs for all cycle markers.

Resize Points

The resize points (yellow dots on the top level cycle markers) allow you to specify where some of the markers should be placed. The study will place the remaining markers around these points using the constraints from the cycle model.

Once a cycle marker has been moved, it is considered to be “pinned” and the study will not move its location. Pinned cycle markers will have a check mark displayed on the left hand side to visually indicate that it has been chosen by the user.

Cycle markers can be moved at any time by dragging the yellow dots. The dots will snap to the closest bar. You can “unpin” (tell the study to automatically position it) via the right click context menu (choose the “Unpin” option).