What's New in Version 6.1
Introduction
Welcome to MotiveWave™ version 6.1! This document will outline the features that have been added between version 6.0 and version 6.1.
A new layout has been added to the docking framework to manage floating stations (instead of using the split layout).
For more details please see the Docking Framework guide:
https://www.motivewave.com/guides/MotiveWave_Docking_Framework.pdf
Floating Stations
Floating stations provide an alternative to split layouts. In contrast, the stations have fixed locations and sizes. The stations may also overlap other stations similar to application windows.
Unlike split layouts, resizing the window (or maximizing it) does not affect the sizes or positions of the stations. Resizing may also cause a station to no longer be visible if its original position lies outside of the new bounds of the visible area.
A floating station layout can be chosen when creating a new page or editing an existing page (see below).
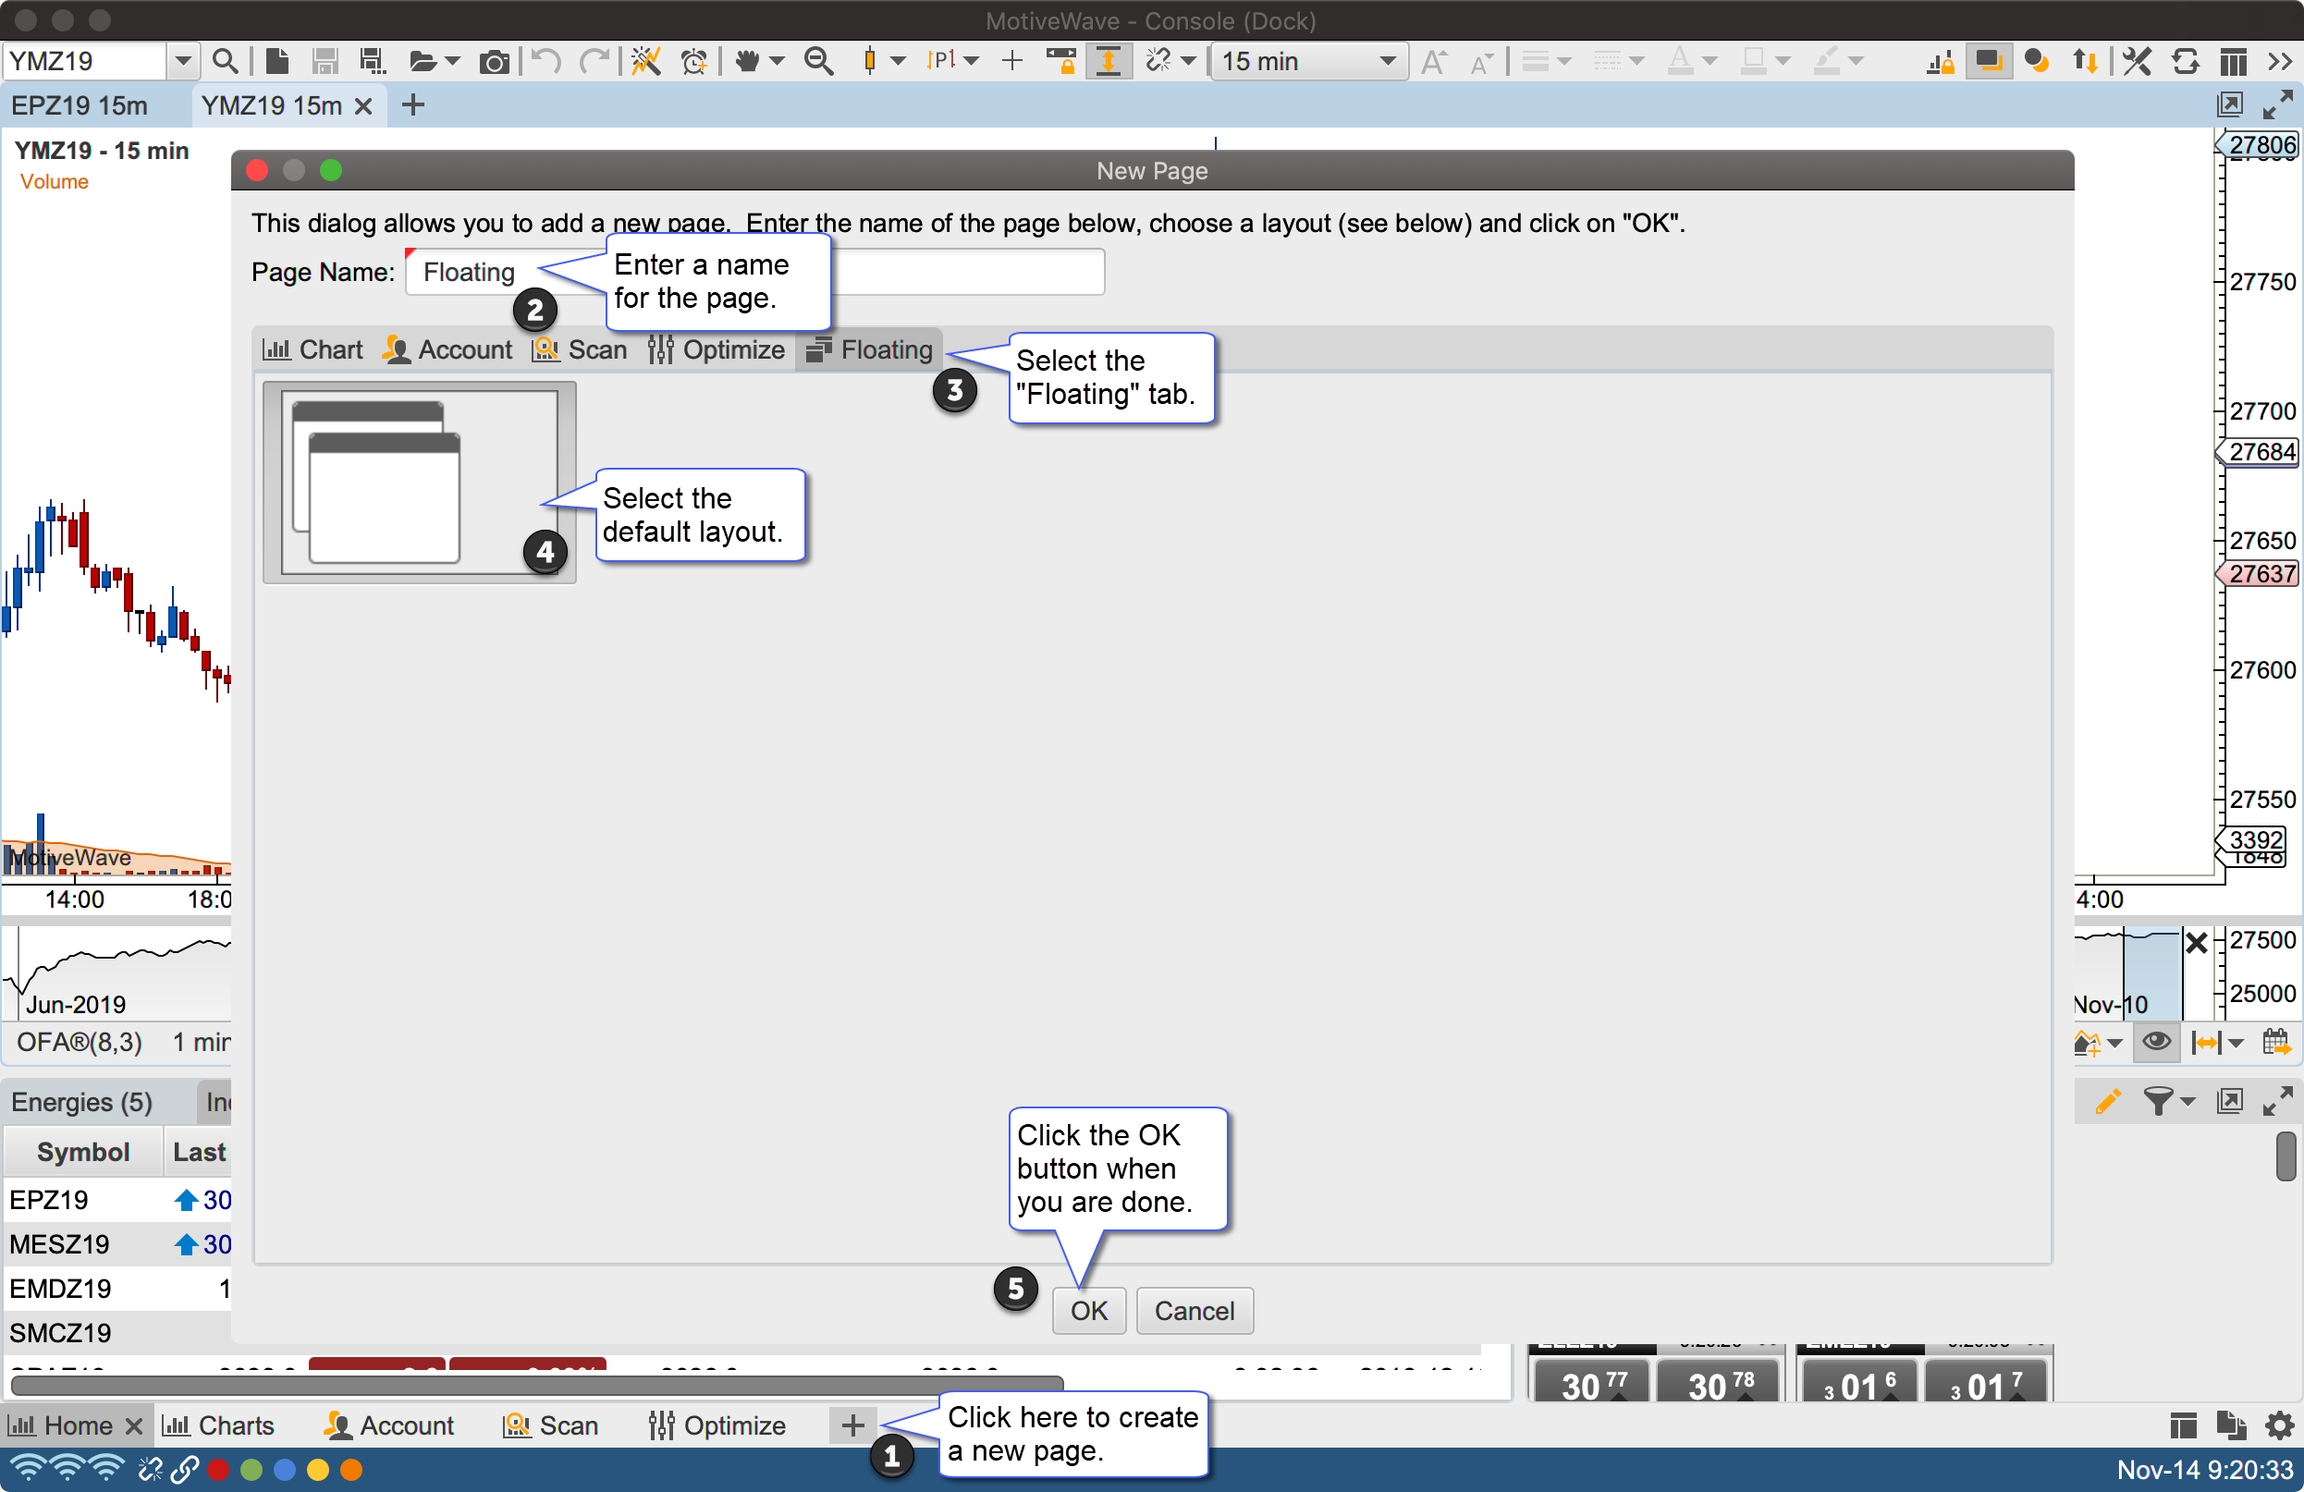
The default layout for floating stations includes two overlapping stations in the top left section of the content area:
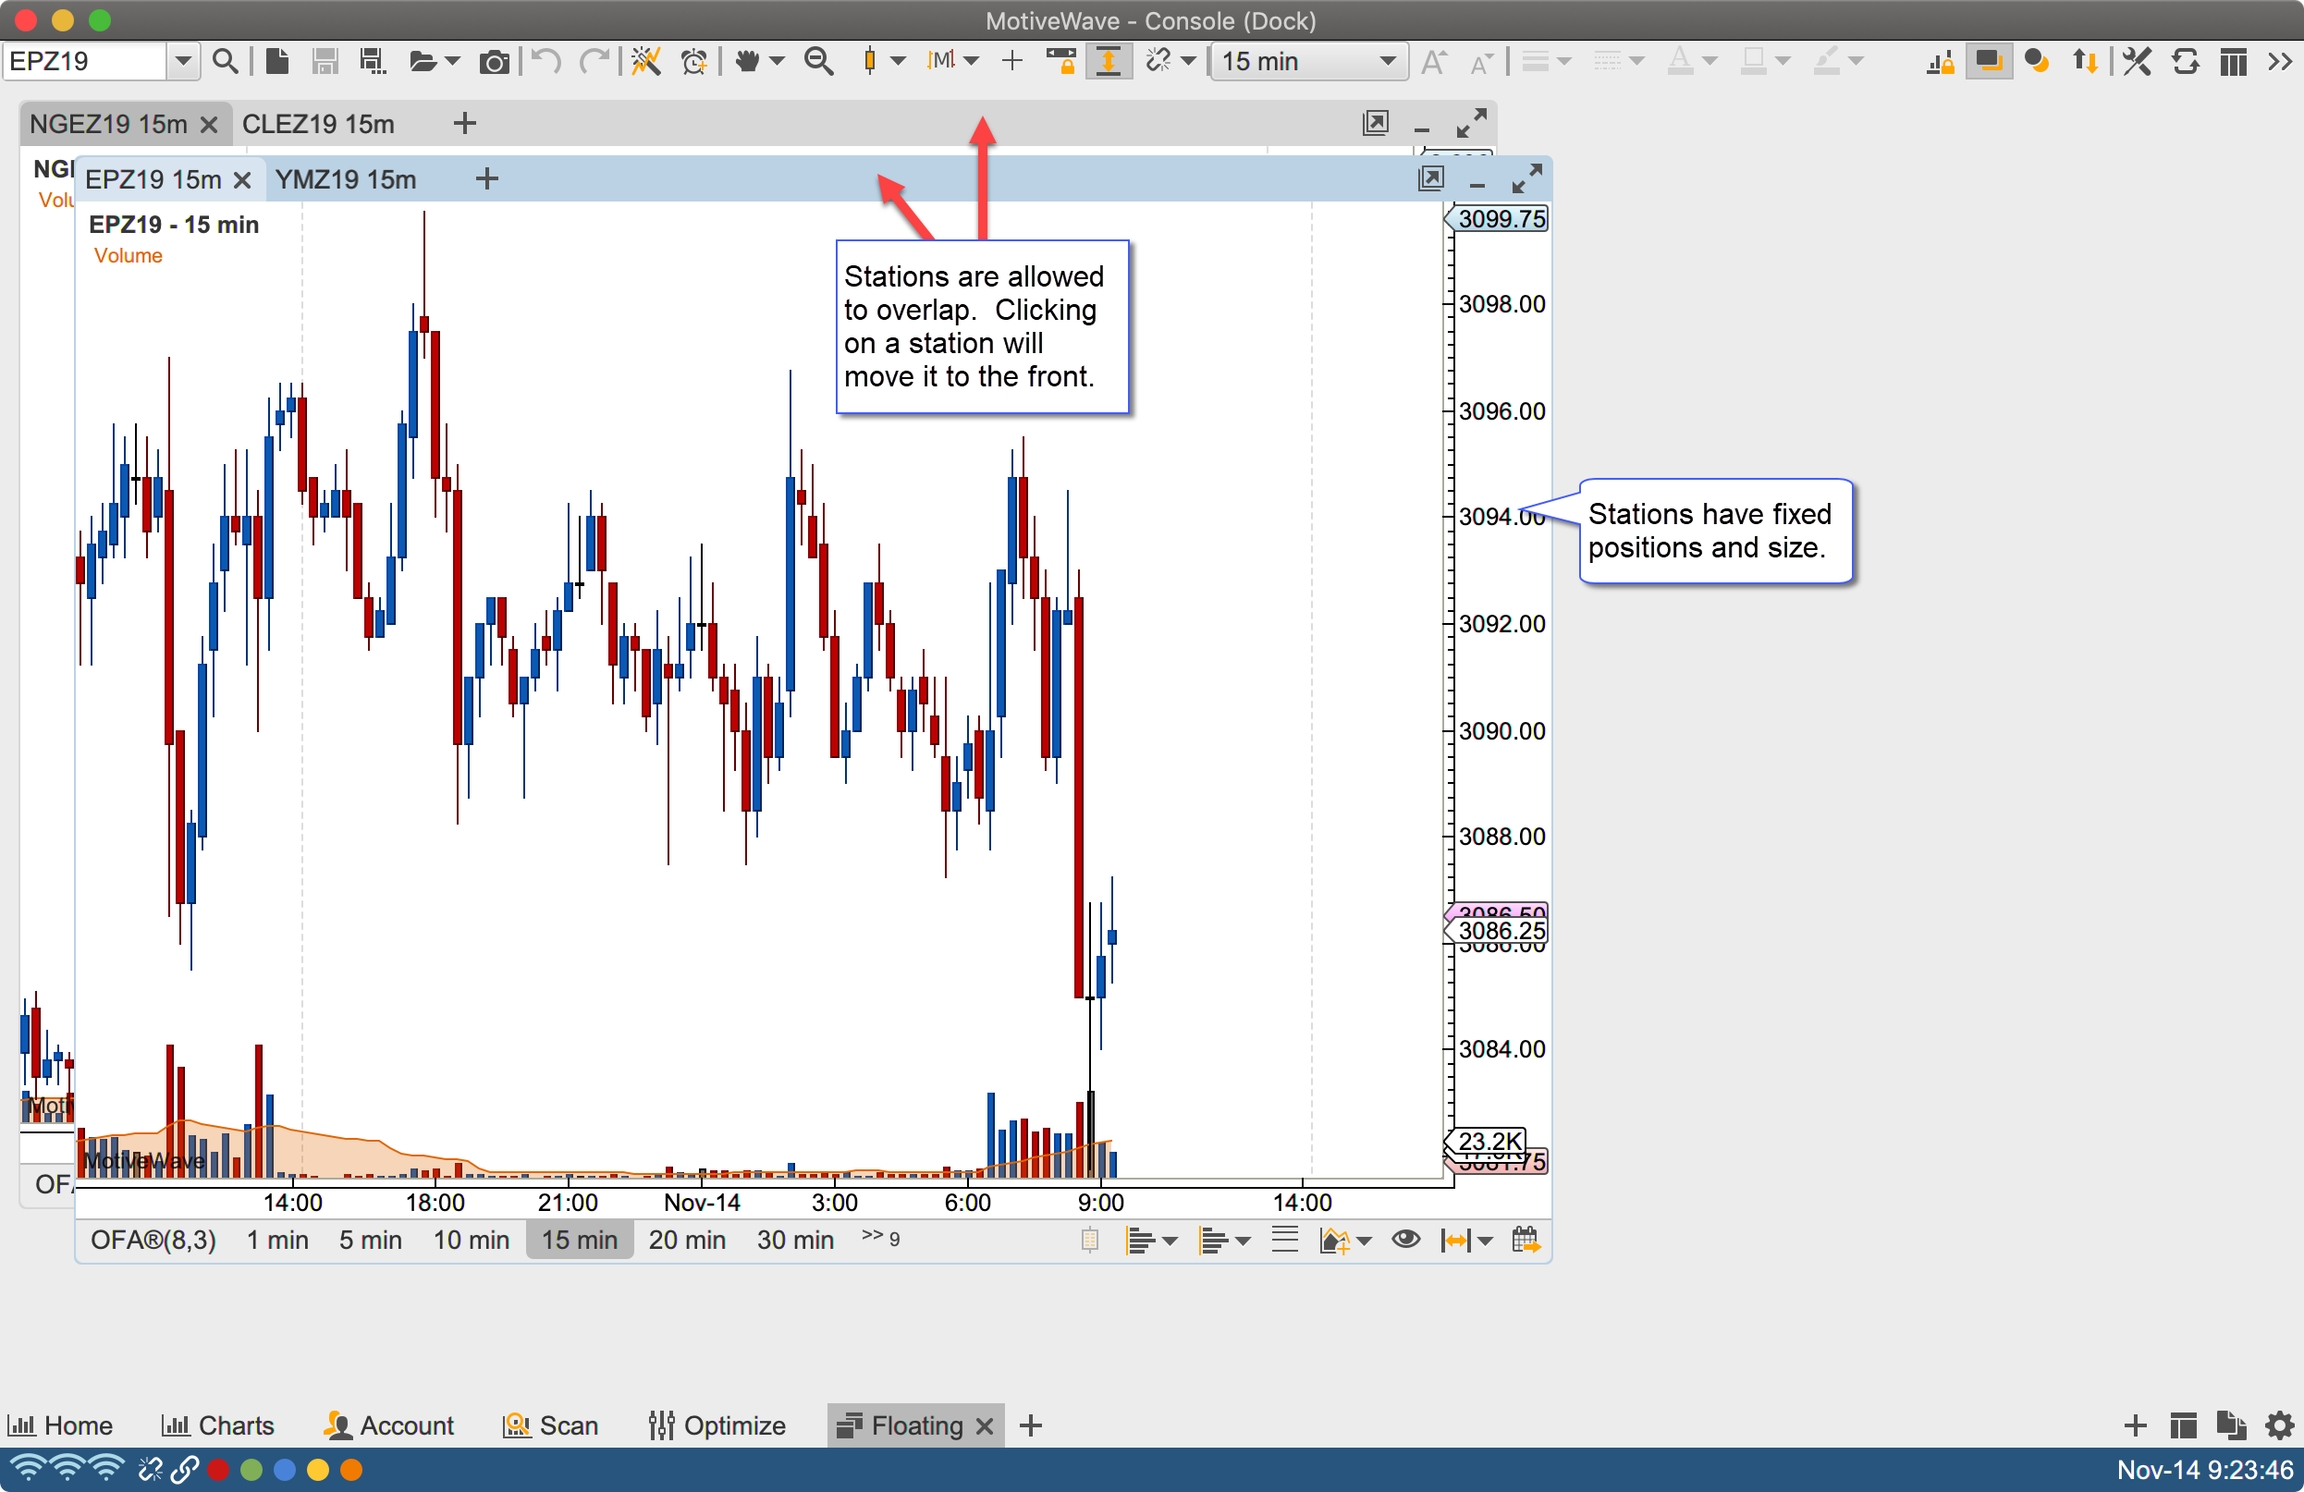
Moving Stations
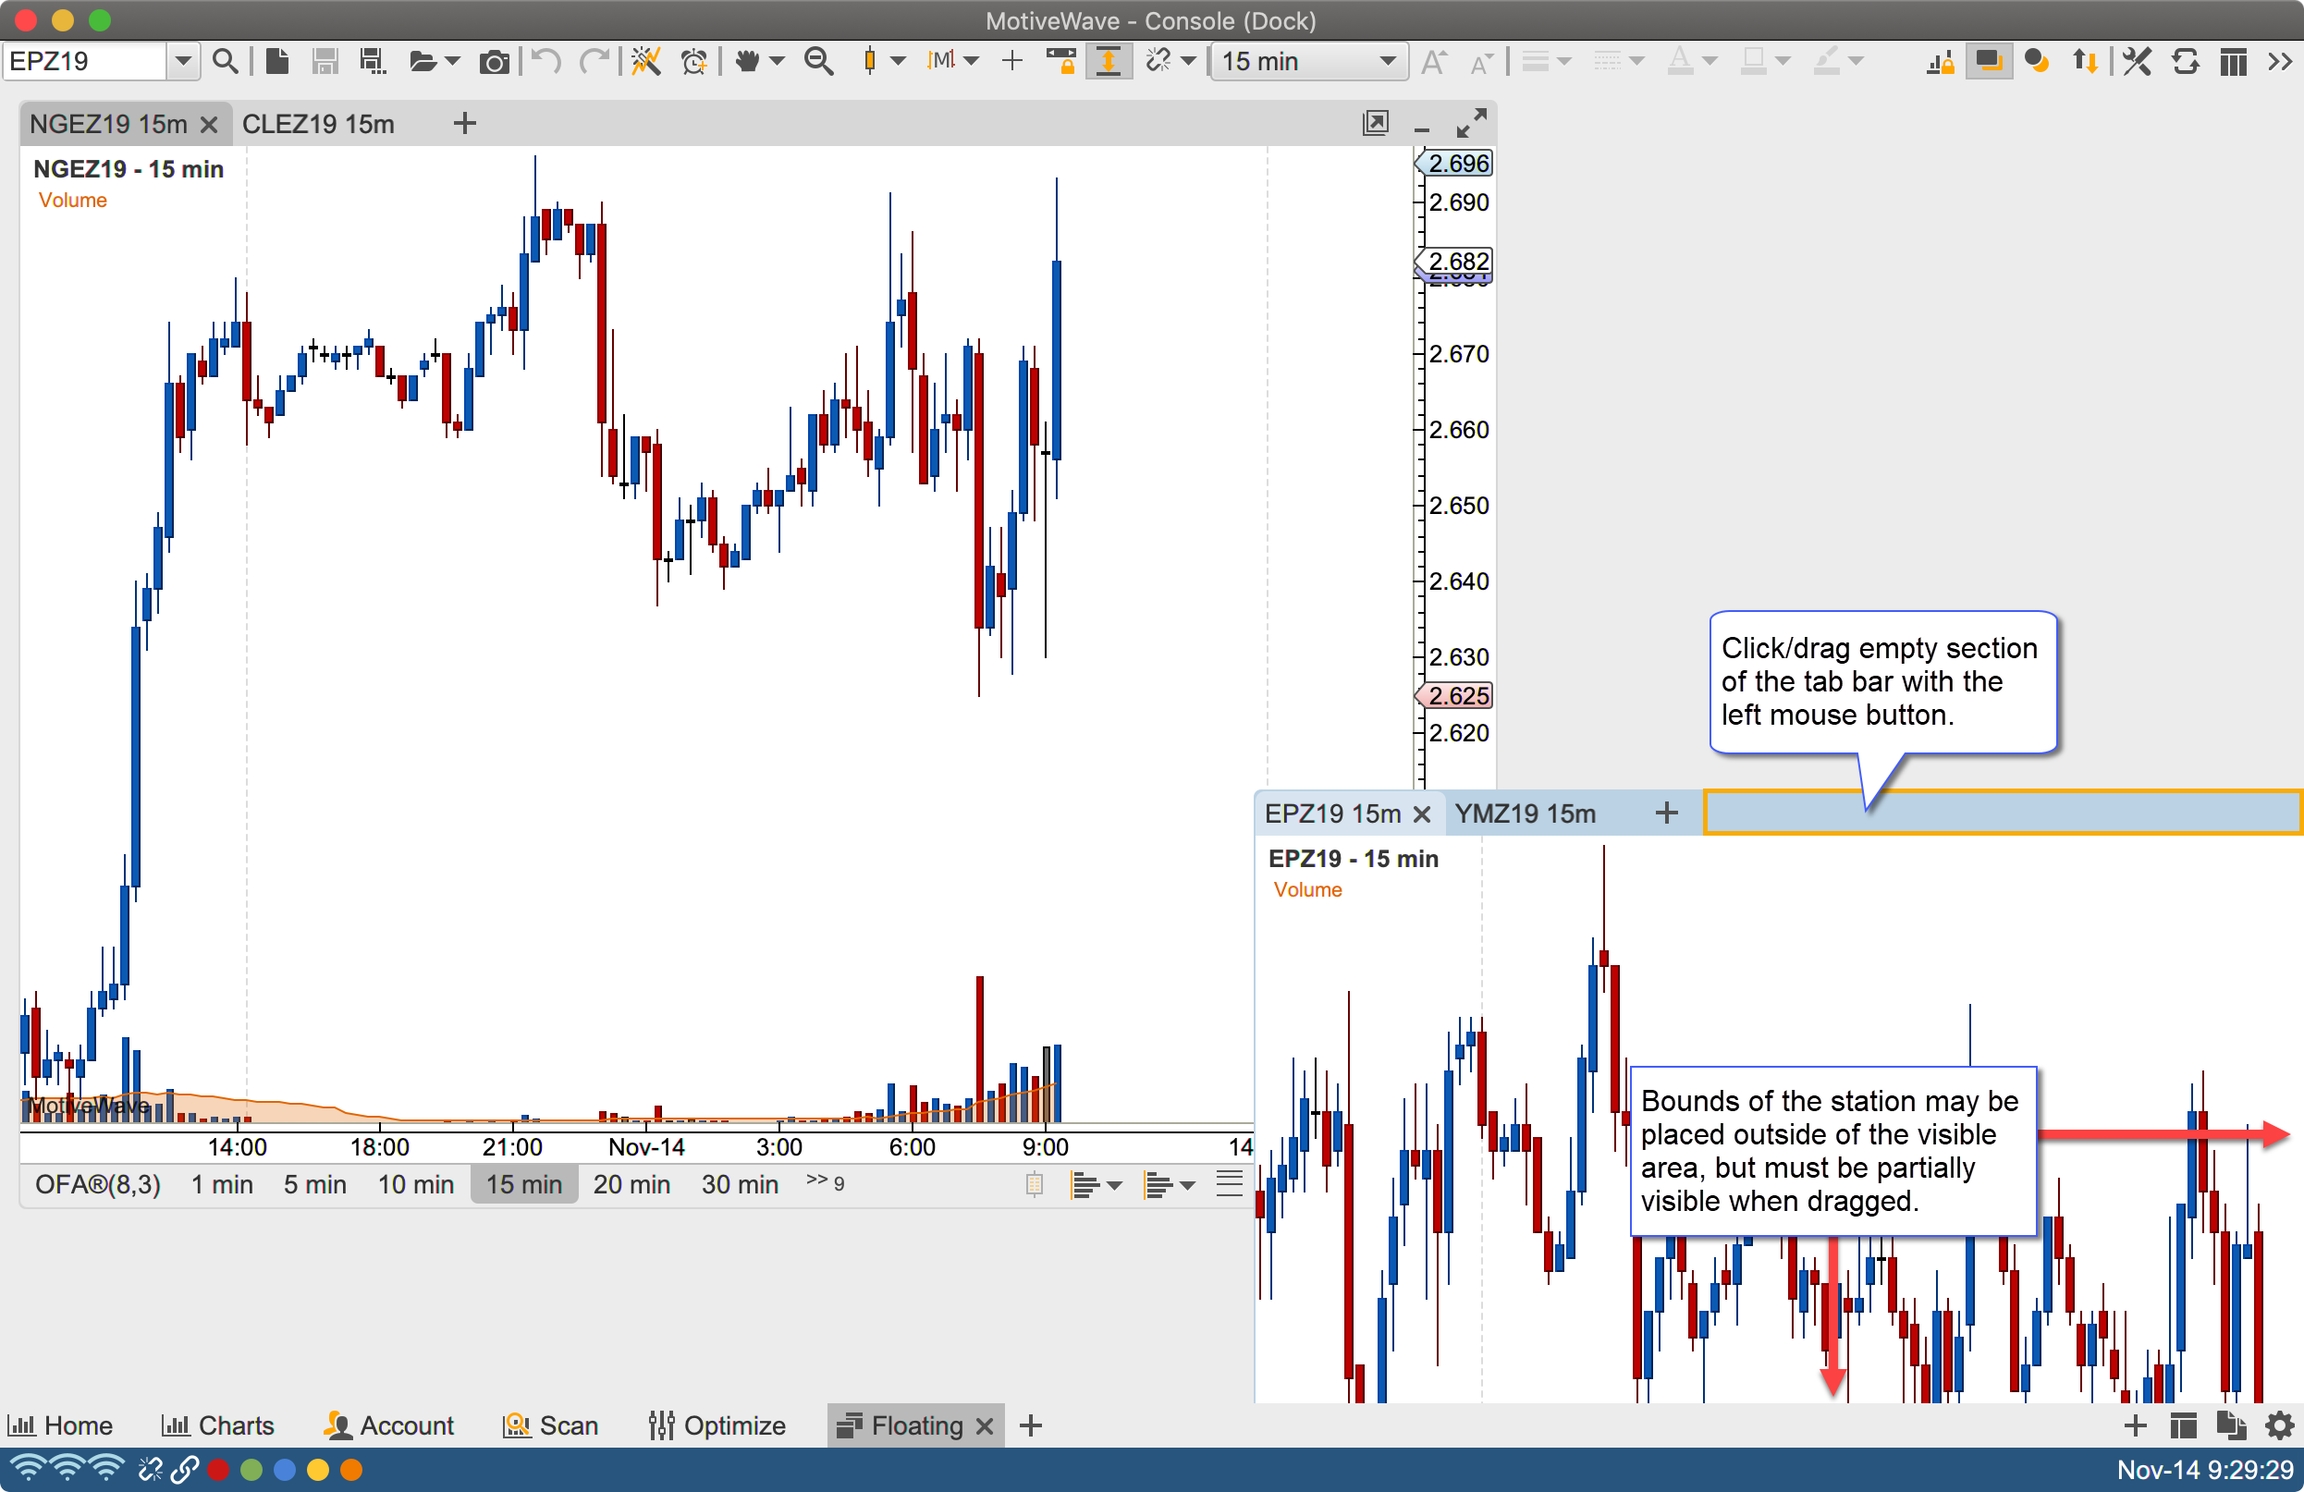
Stations can be moved (positioned) by clicking/dragging the empty section of the tab bar. The stations can be placed anywhere, but must be at least partially visible in the content area.
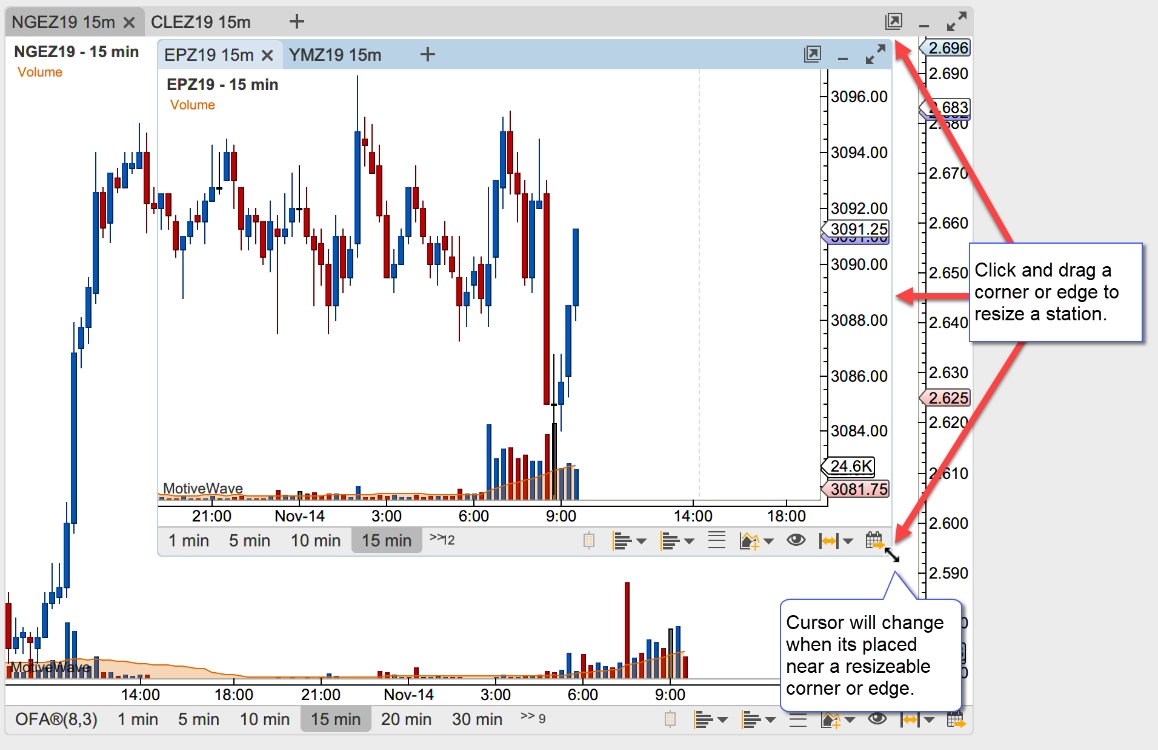
Resizing Stations
Similar to application windows, stations may be resized by dragging the corners or edges of the stations.
Sticky Edges
For convenience, the edges of the stations and the visible bounds of the content area are “sticky”. This effect will cause the station to “snap” to the edge of another station or to the edges/corners of the visible bounds when the station is dragged or resized. The feature makes it easier to layout the stations.
The sticky option can be disabled by holding down on the Alt key when dragging or resizing a station.
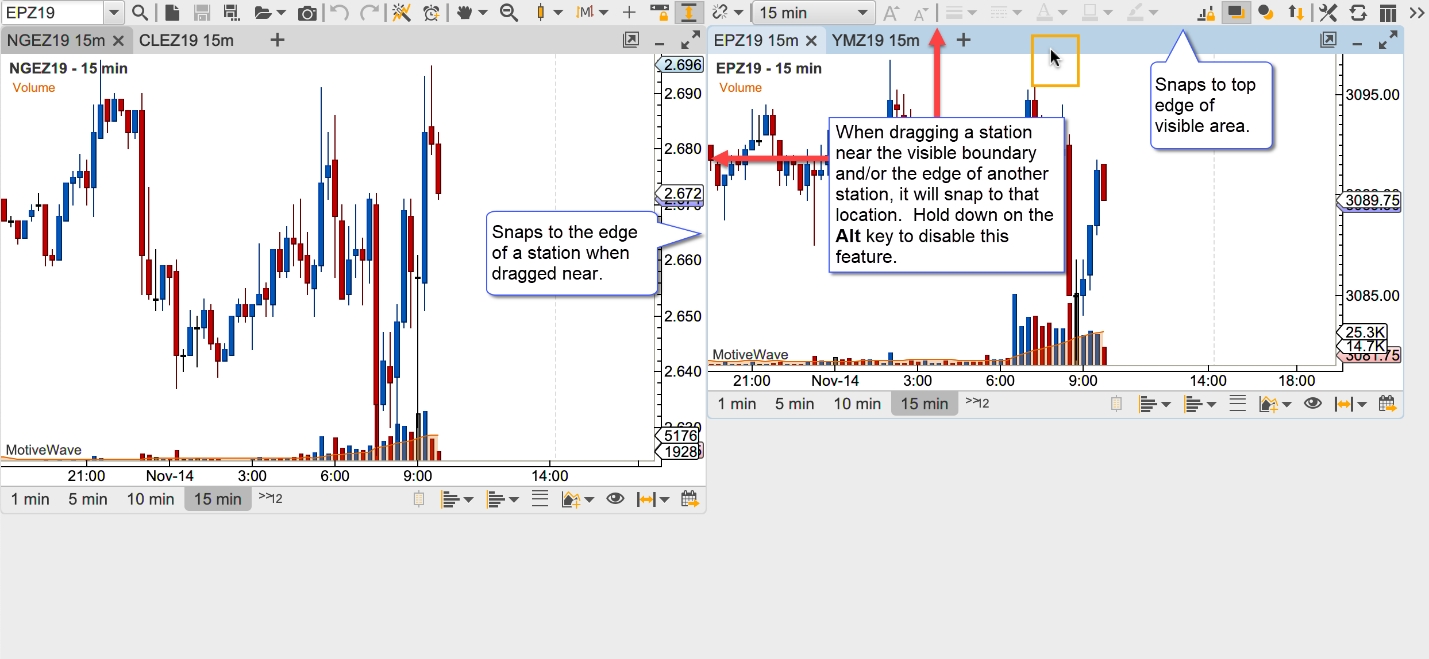
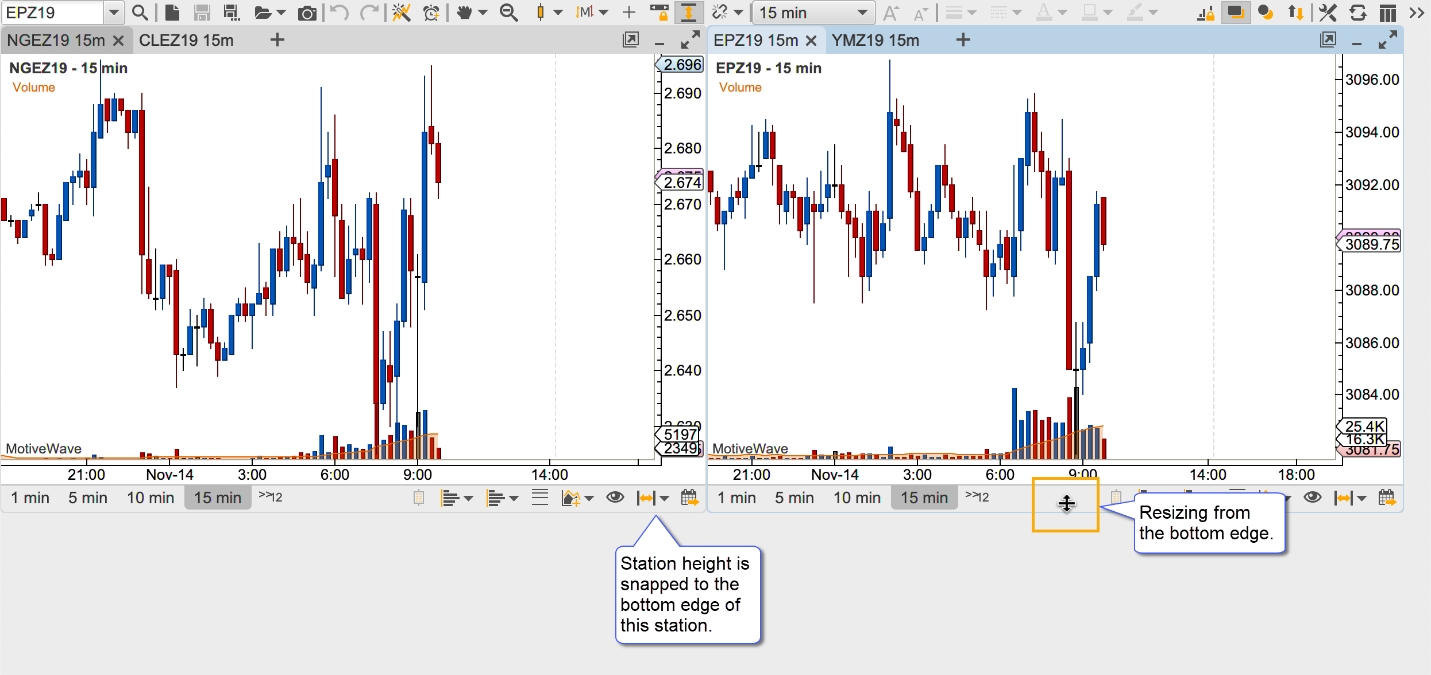
When resizing an edge of station, it will snap to the edge of a nearby station as well. This can be especially convenient when attempt to make the dimension of the stations the same. In the screen shot below the height of the station is made to match the height of the adjacent station when resizing from the bottom edge.
Resizing Snapped Stations
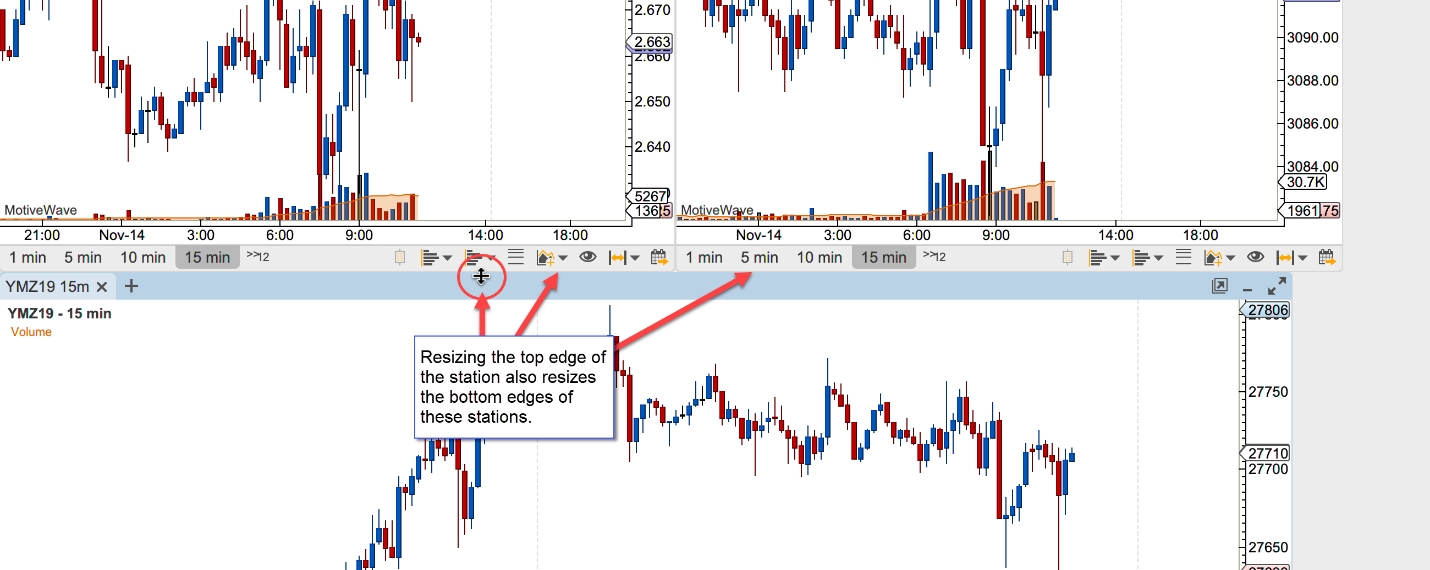
For convenience resizing the top, bottom or sizes of a station that has been snapped to another station will resize those station(s) as well. This behavior can be turned off by holding down on the Alt key.
Minimizing Stations
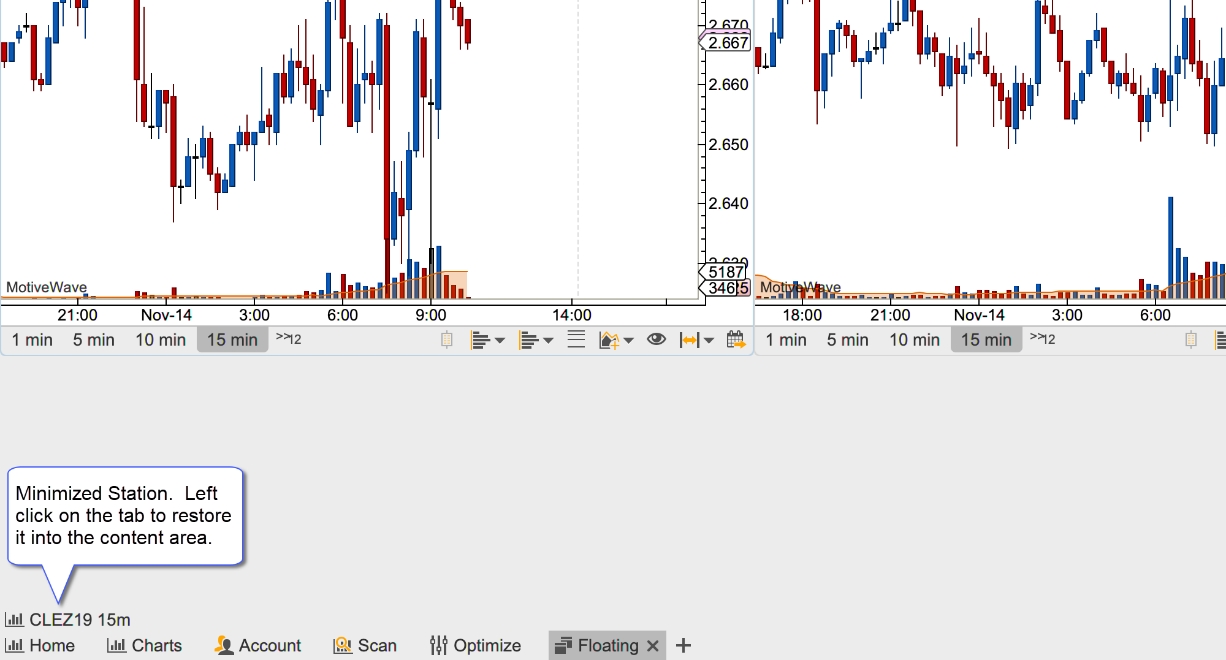
Stations can be minimized to clear clutter from the content area. Click on the minimize button in the top right corner of the station to minimize it.
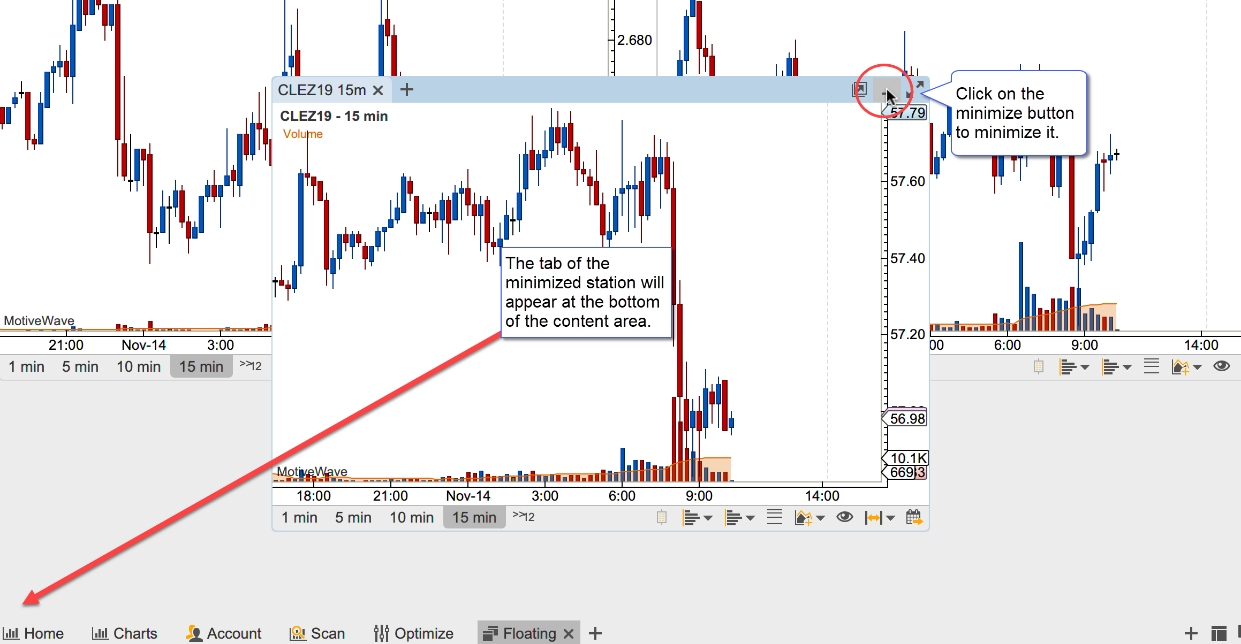
The active tab of the minimized station will appear in the bottom left section of the content area appearing in the order in which they were minimized. Click on a minimized station to restore it to the content area.
Maxmizing Stations
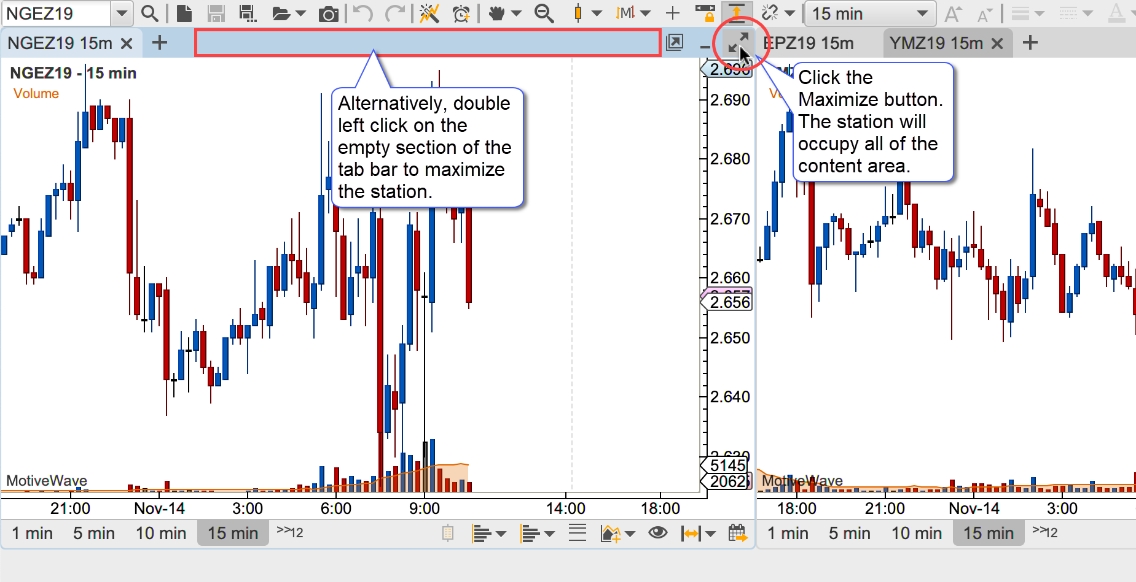
A station may be maximized to occupy the entire viewing area. When a station is maximized its size will change when the window is resized. When the station is restored, its original location and size will be preserved.
The left and right arrow buttons in the top right corner of the maximized station may be used to cycle through the stations in the viewing area.
Creating New Stations
There are several ways to create new stations:
New Station (+) Button – Click on the ‘+’ button on the right side of the page bar
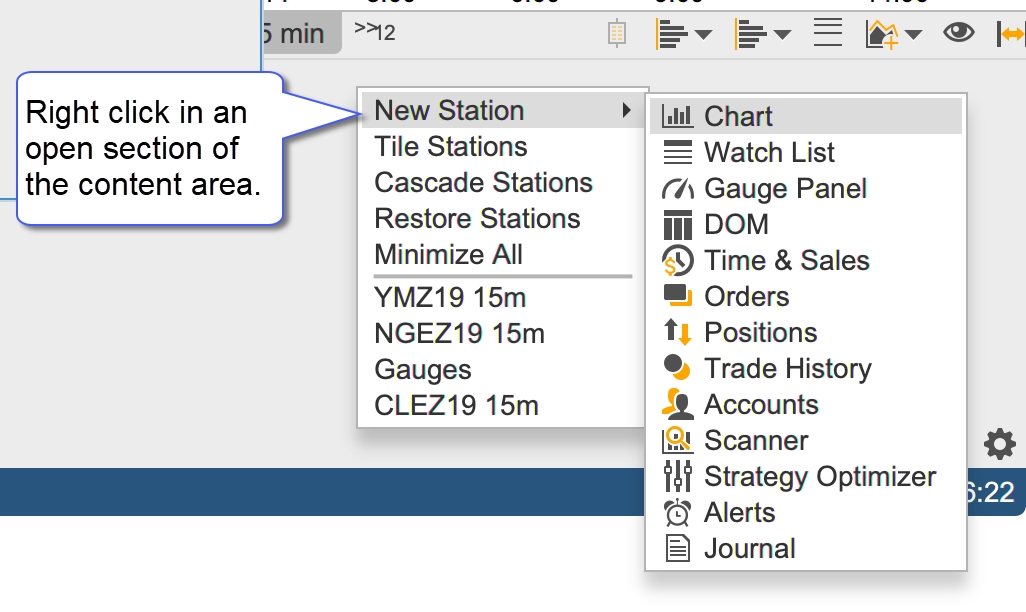
Context Menu – Right click in an open section of the content area
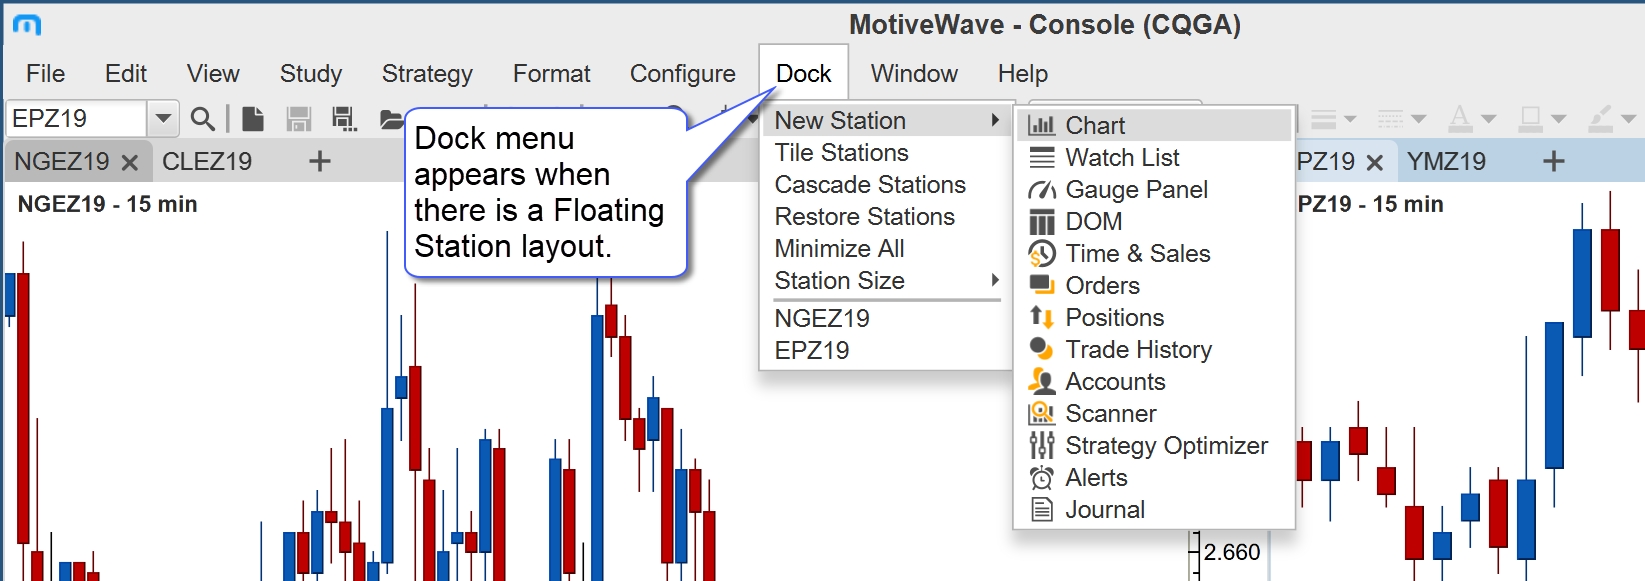
Top Menu Bar – See New Station menu in the Dock section of the top menu bar.
Dragging Station Tabs – Station tabs can be dragged into an open section of the content area.
The following screen shots illustrate the first 3 options for accessing the New Station menu. This menu contains the available panel types similar to the new panel button in the tab bar of a station. Select the desire panel type to create a new station.
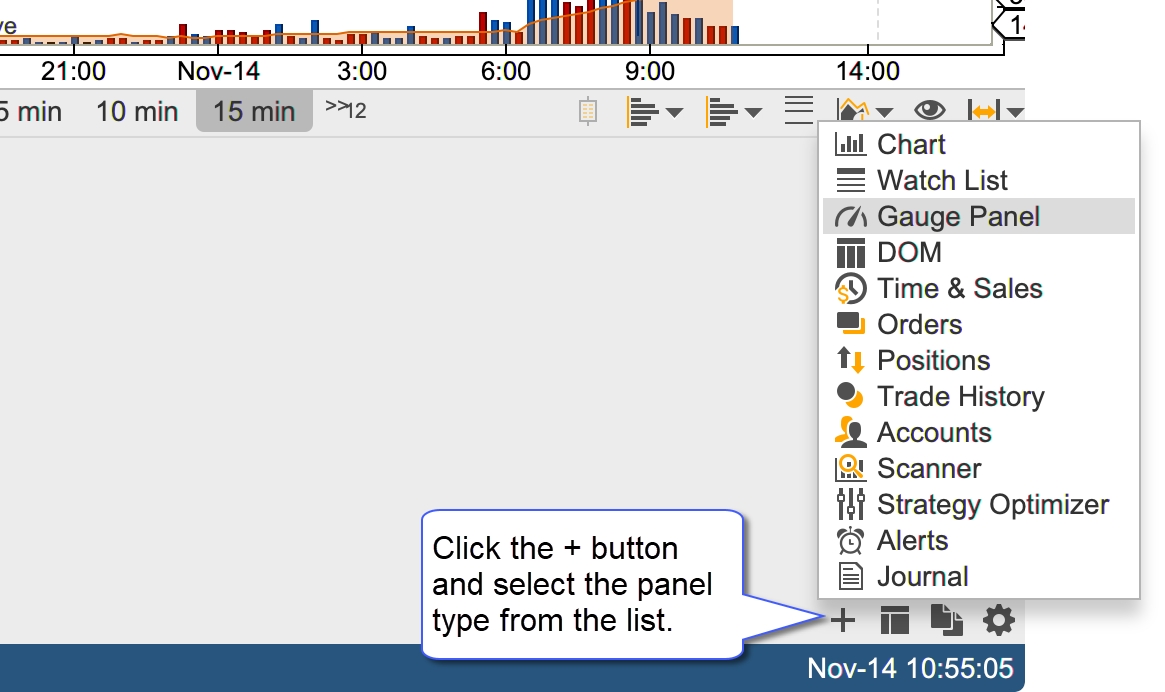
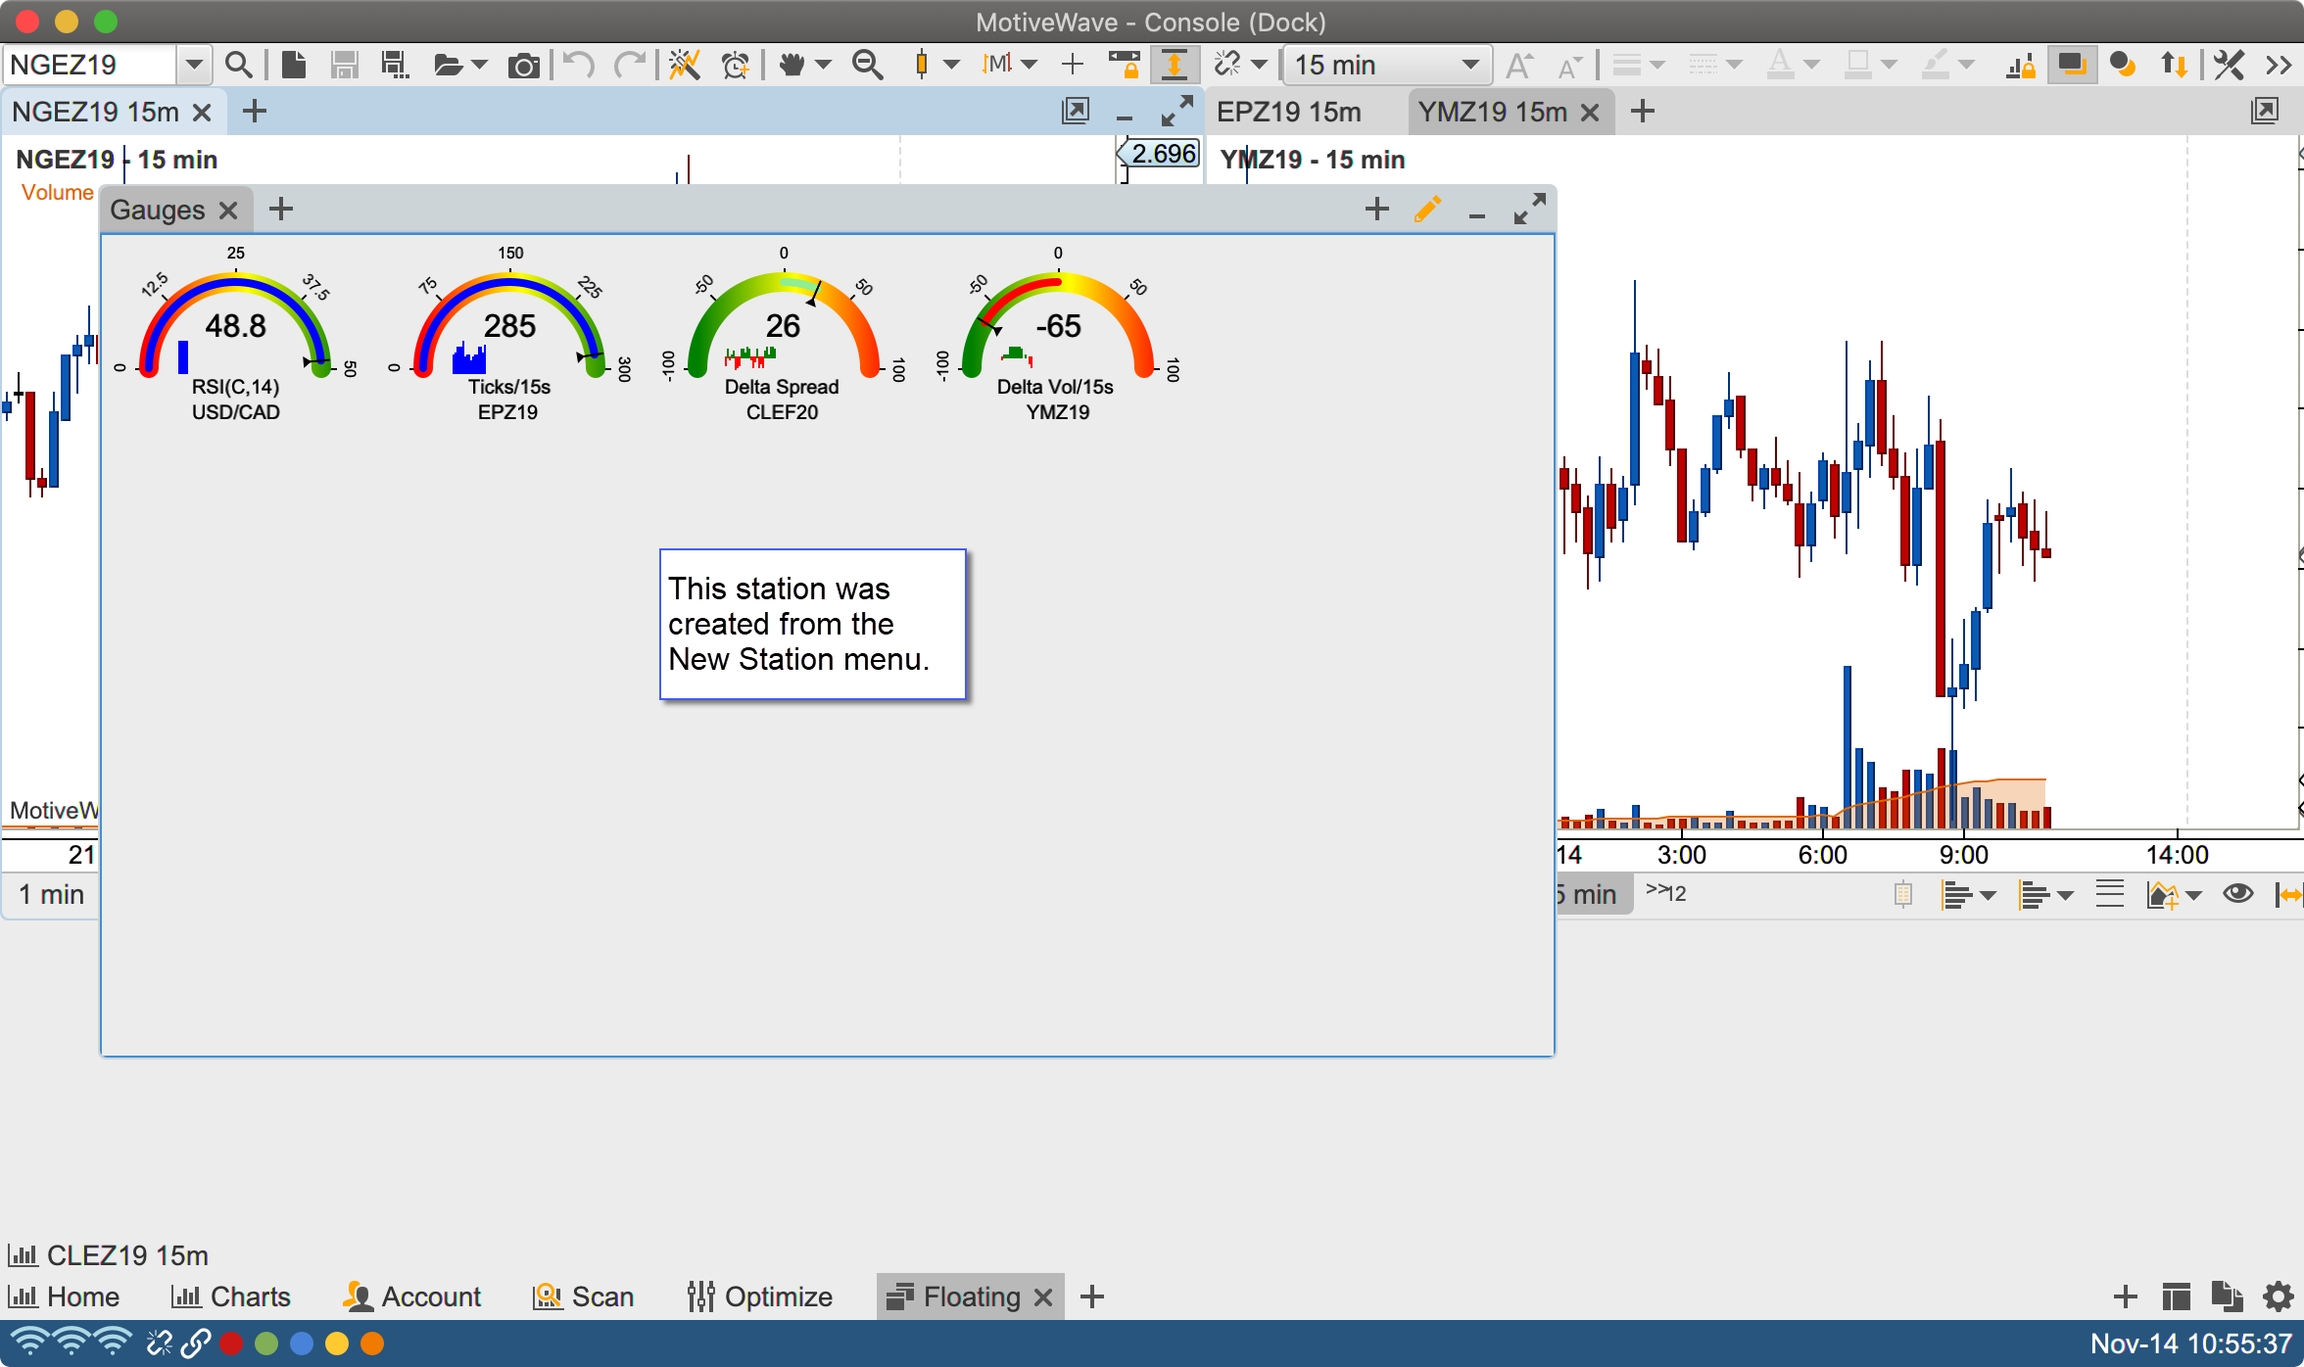
In the screen shot below a new Gauge panel was created resulting in a new station being added to the layout.
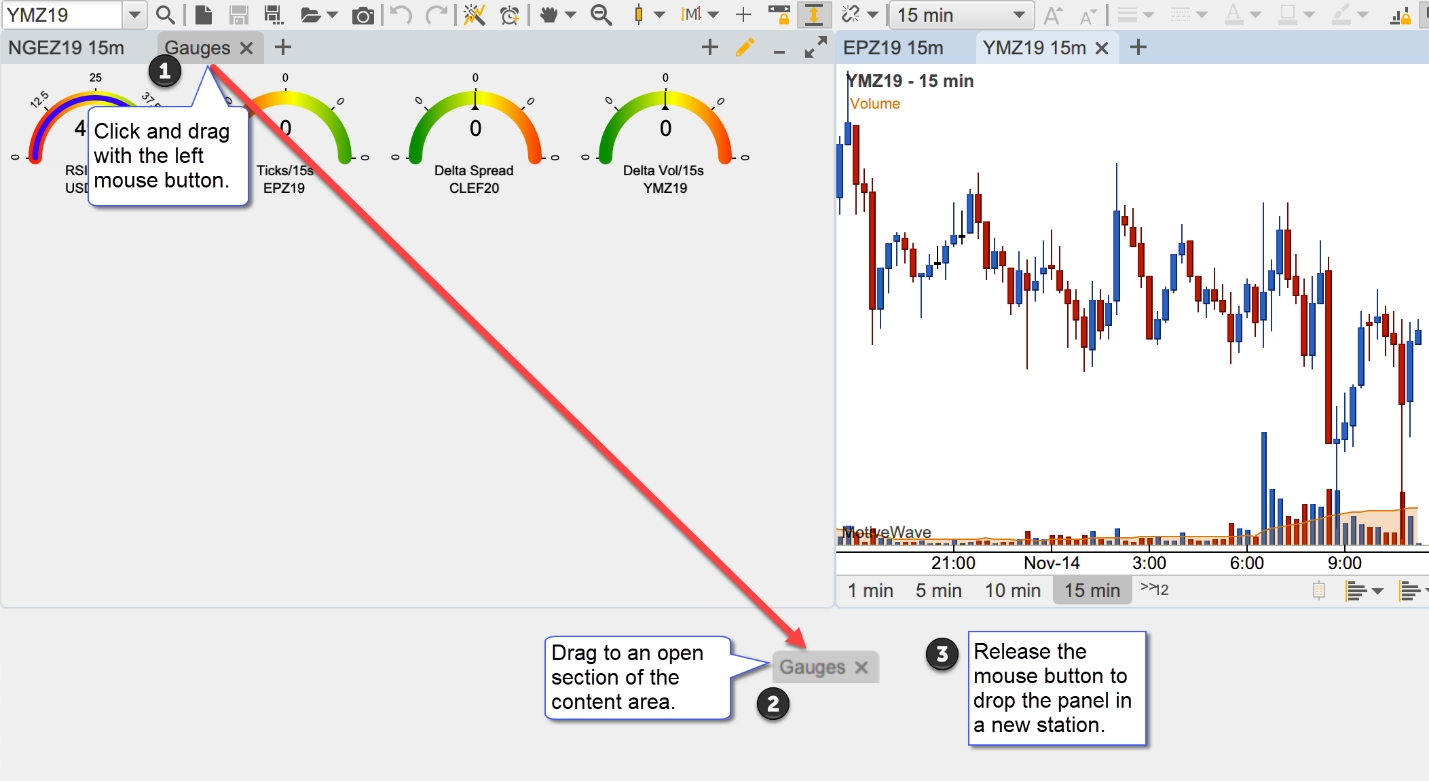
Alternatively, a new station may be created by dragging the tab of an existing panel from its station into an empty section of the content area.
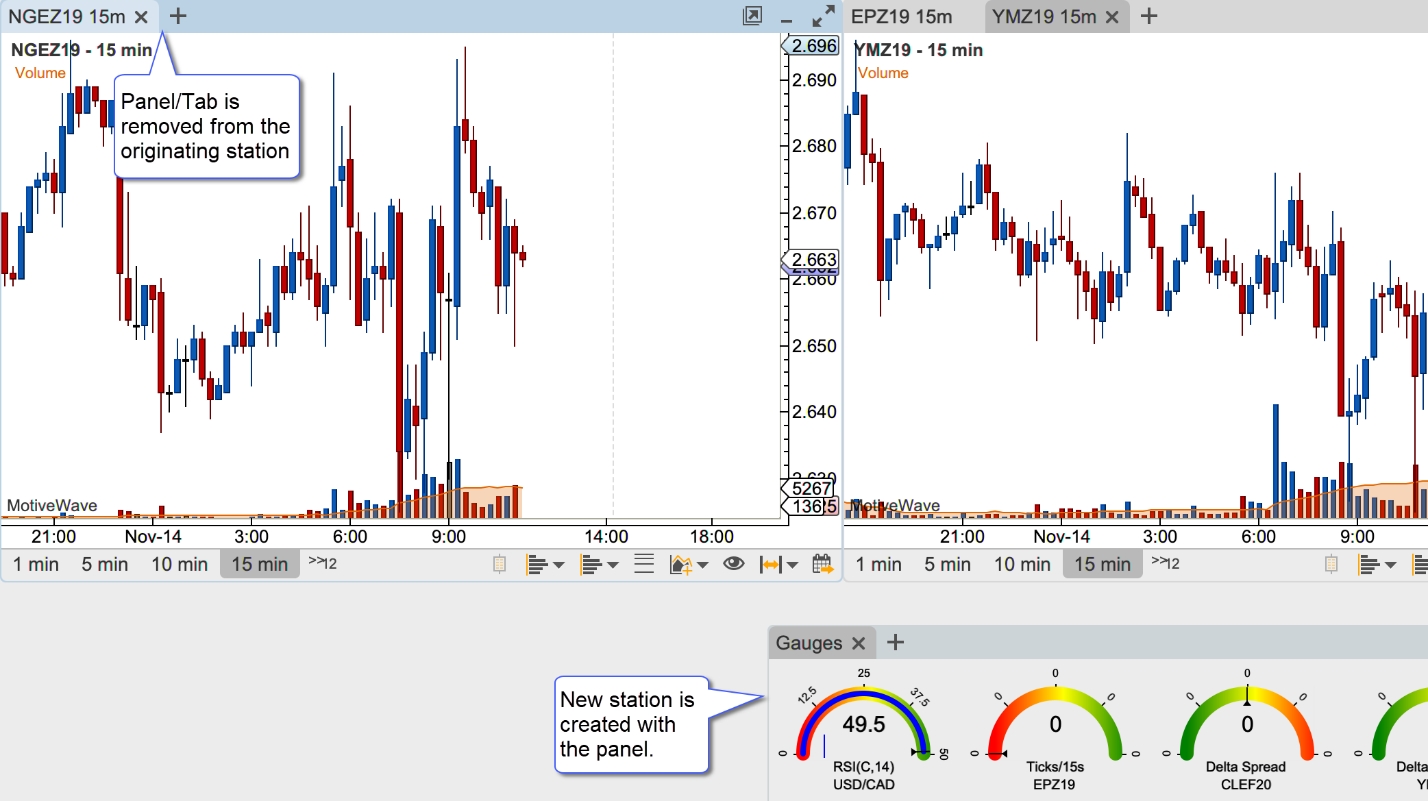
When the mouse button is released in an empty section of the content area, a new station is created and the panel from the originating station is remove and added to the new station.
Moving Panels Between Stations
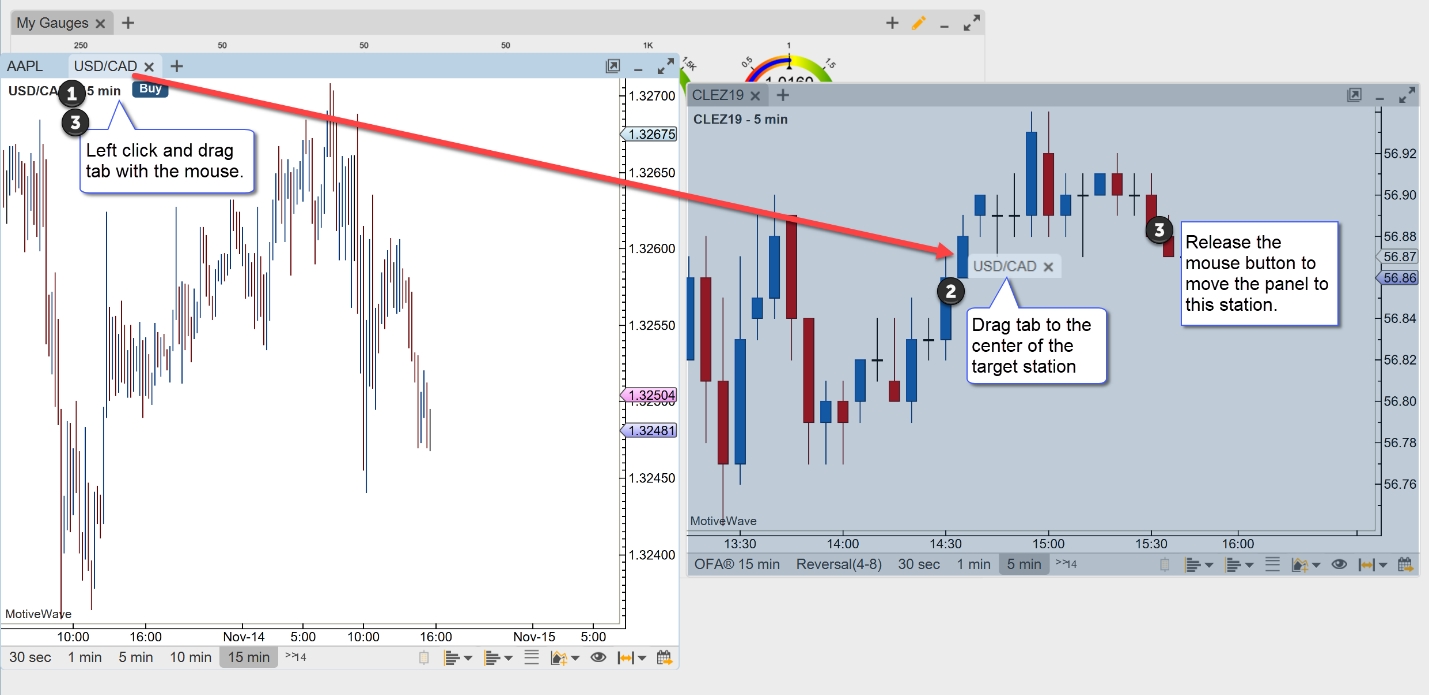
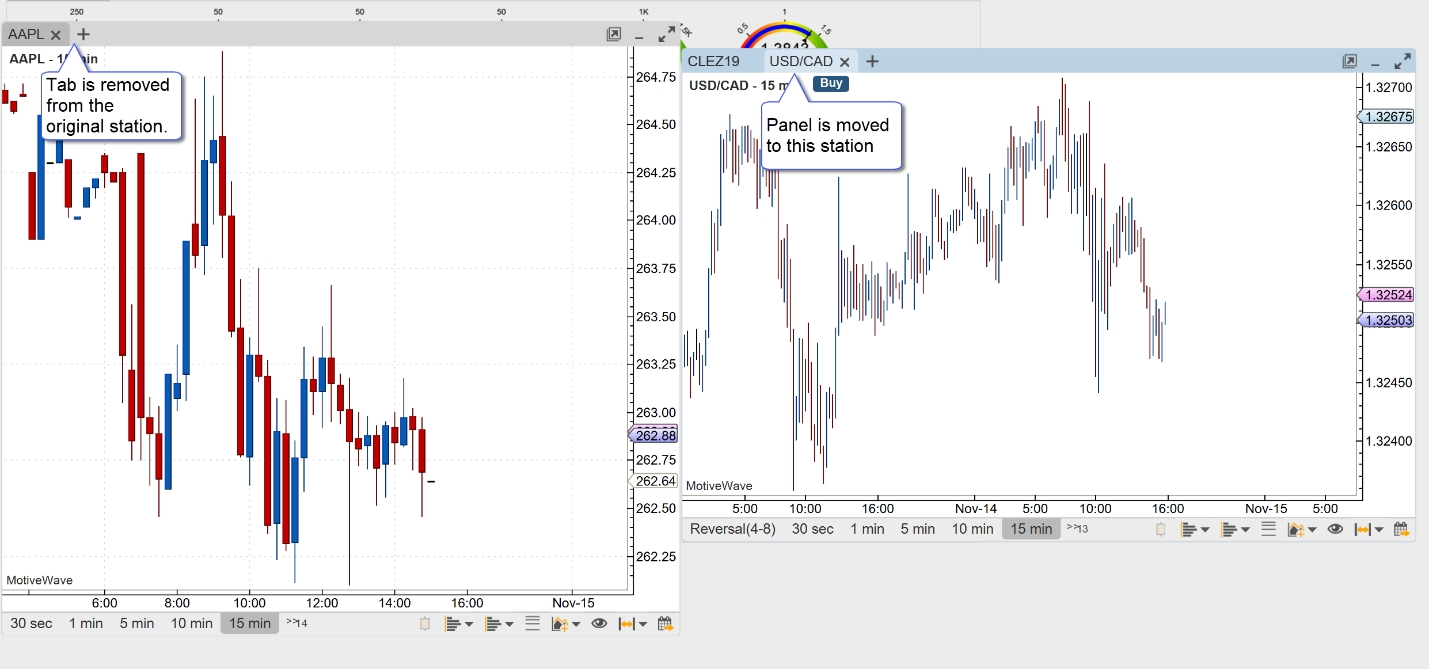
Panels can be moved from one station to another by dragging the tab (left click and drag with the mouse) into the content area of another station.
Closing/Removing Stations
A station is removed when the last panel is removed from the station. This will occur when the last station is either closed or moved into another station.
Managing Floating Stations
The Dock (top menu bar, only visible from a Floating Station layout) and Context Menus (right click) have several options for managing stations in the floating layout:
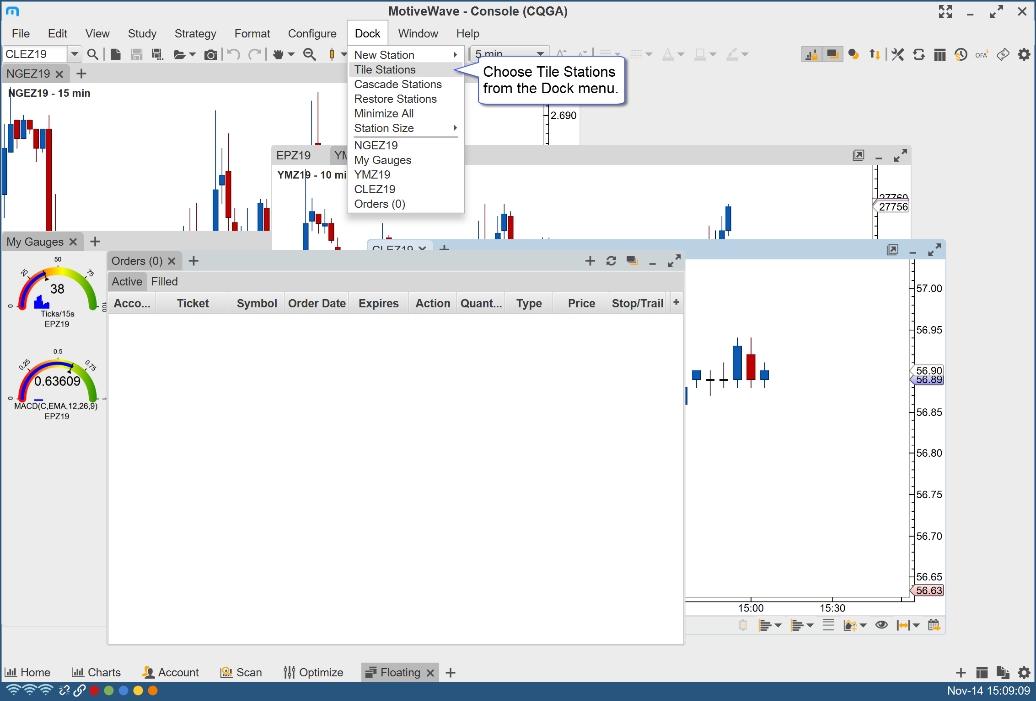
Tile Stations – Positions and resizes visible stations into a grid layout
Cascade Stations – Arranges and resizes stations from the top left corner of the visible area
Restore Stations – Restores all stations from the minimized state
Minimize All – Minimizes all visible stations
Station Size – The menu provides preset size (dimension) options
Station Access - All visible and minimized stations may be accessed directly from this menu
Tile Stations
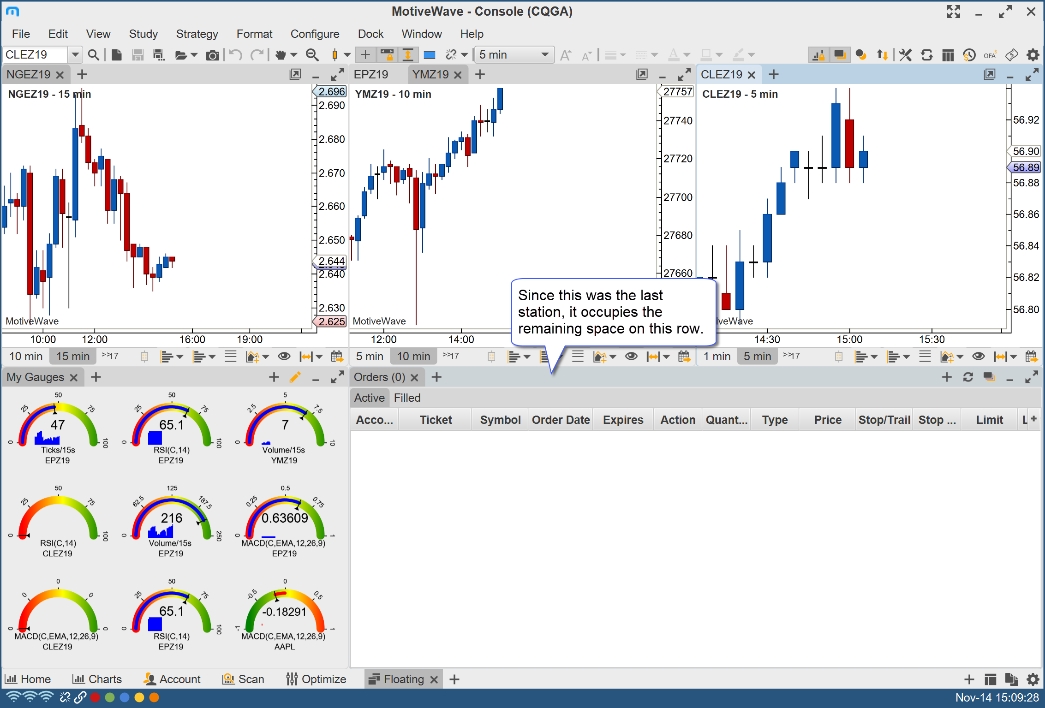
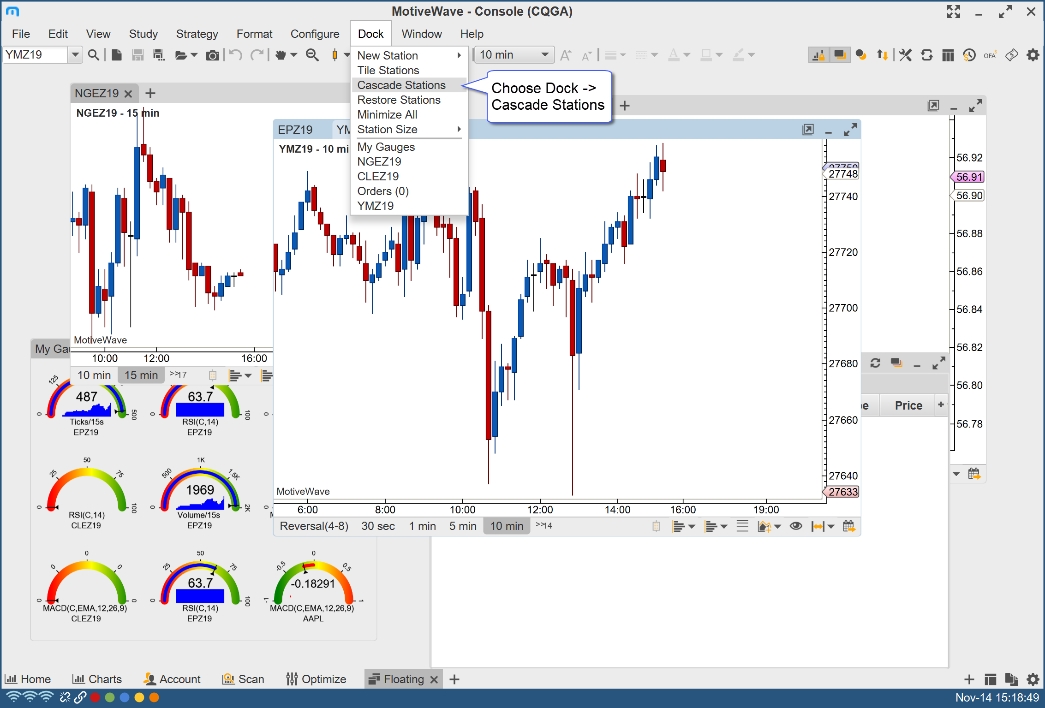
This option will position and size all of the non-minimized stations into a grid format with the last station occupying the remaining space on the bottom row. Choose Dock -> Tile Stations from the top menu bar.
Cascade Stations
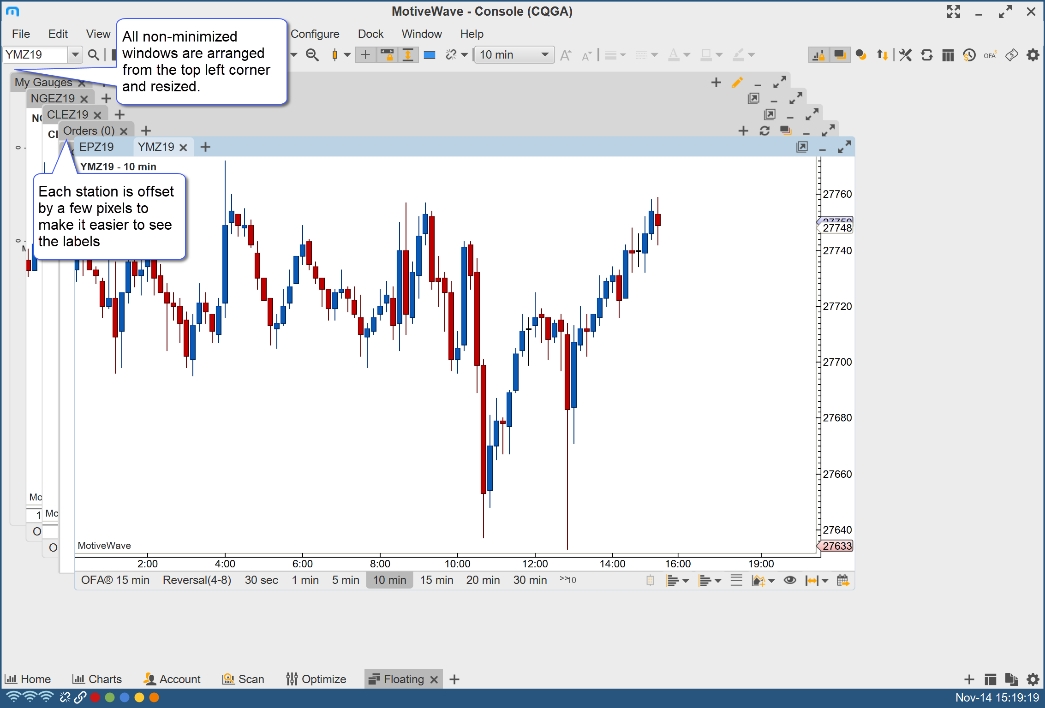
Arranges the non-minimized stations from the top left corner of the content area and offsets them by a few pixels so the tab labels are visible.
Station Sizes
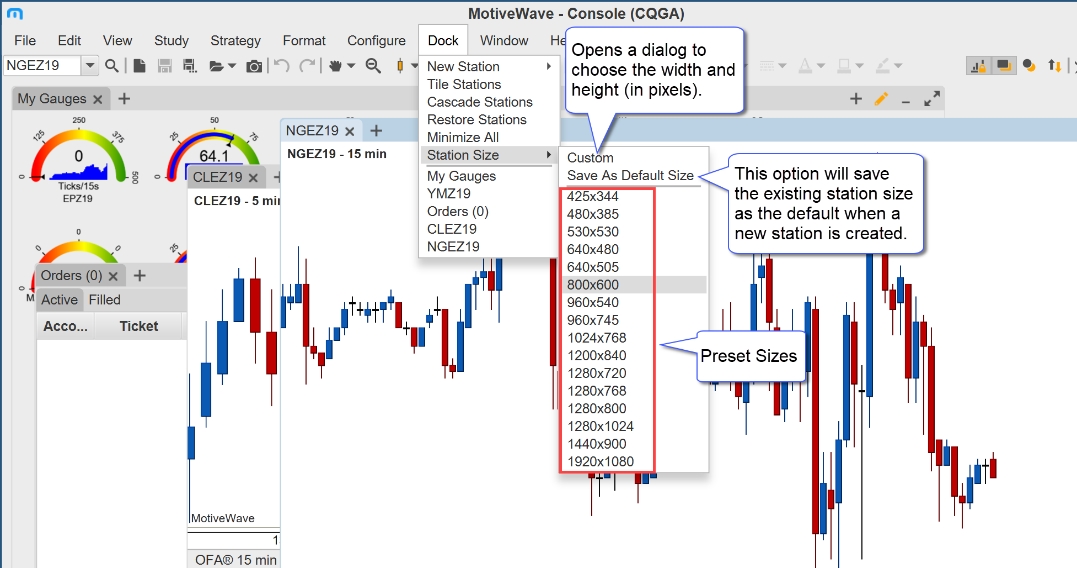
Several preset stations sizes are available under the Station Size sub menu. A custom size can be chosen from a dialog (see Custom Size option). For convenience the active station size can be saved as the default size when new stations are created.
Station Access
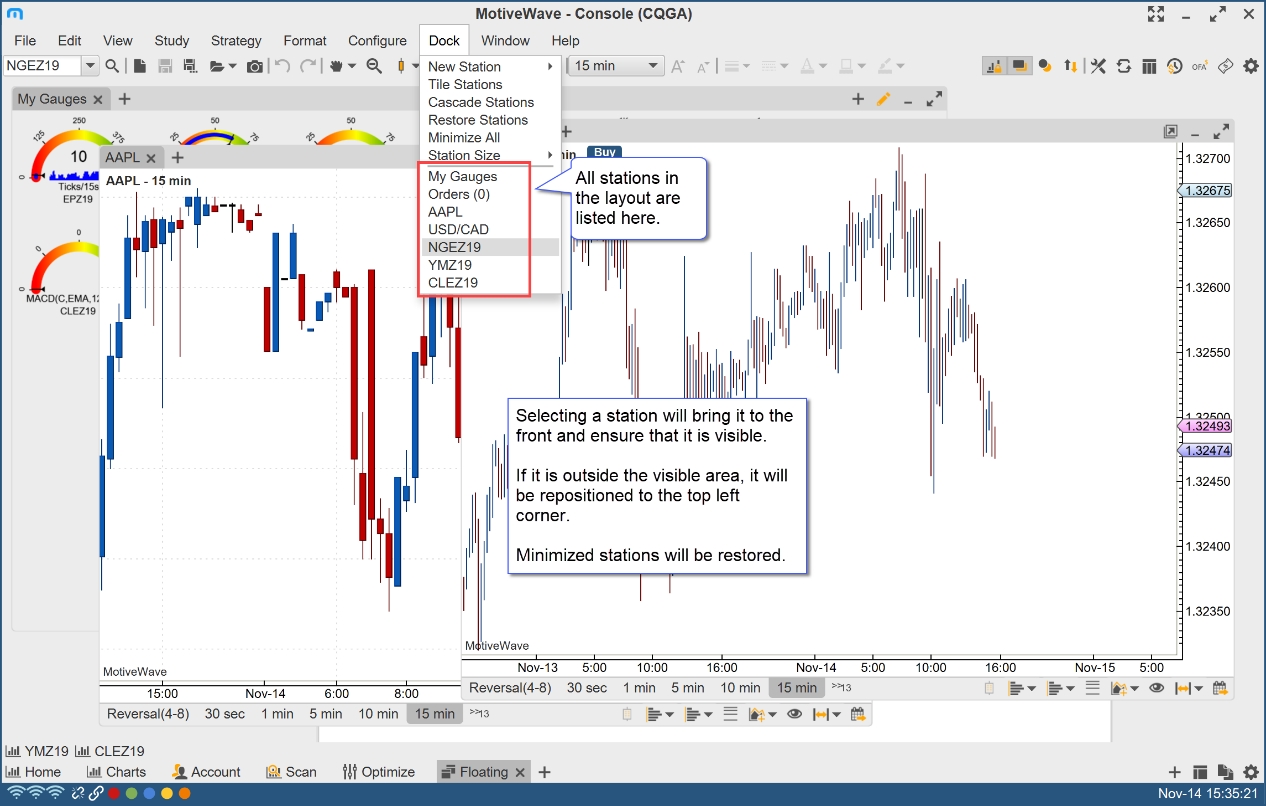
All stations in the layout are listed at the bottom of the Dock menu. This provides a convenient way to location a station that is minimized, hidden behind a set of station or is outside of the visible area.
Grid Background
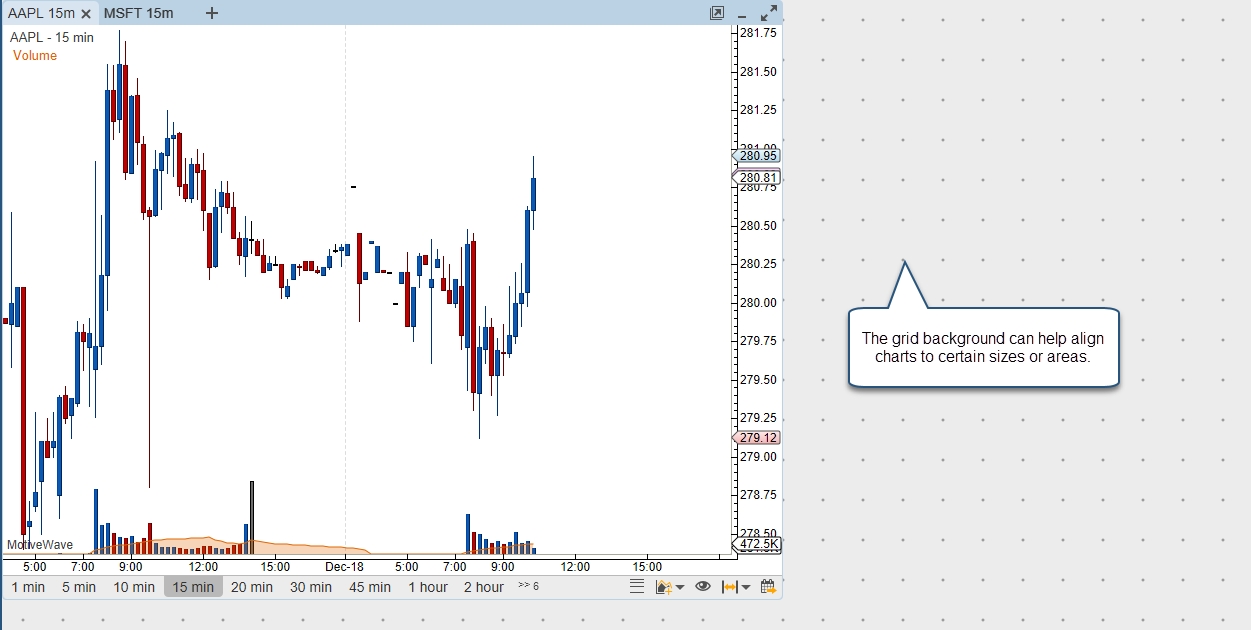
This option (on by default) shows a grid background on the floating layouts. This grid can help align charts to certain areas or sizes. Configuration options can be found in the Preferences dialog (Configure -> Preferences -> General -> Dock).
By default MotiveWave will now open a new Untitled Analysis when a chart is opened.
For more details please see the Analyses guide:
https://www.motivewave.com/guides/MotiveWave_Analyses.pdf
Untitled Analyses
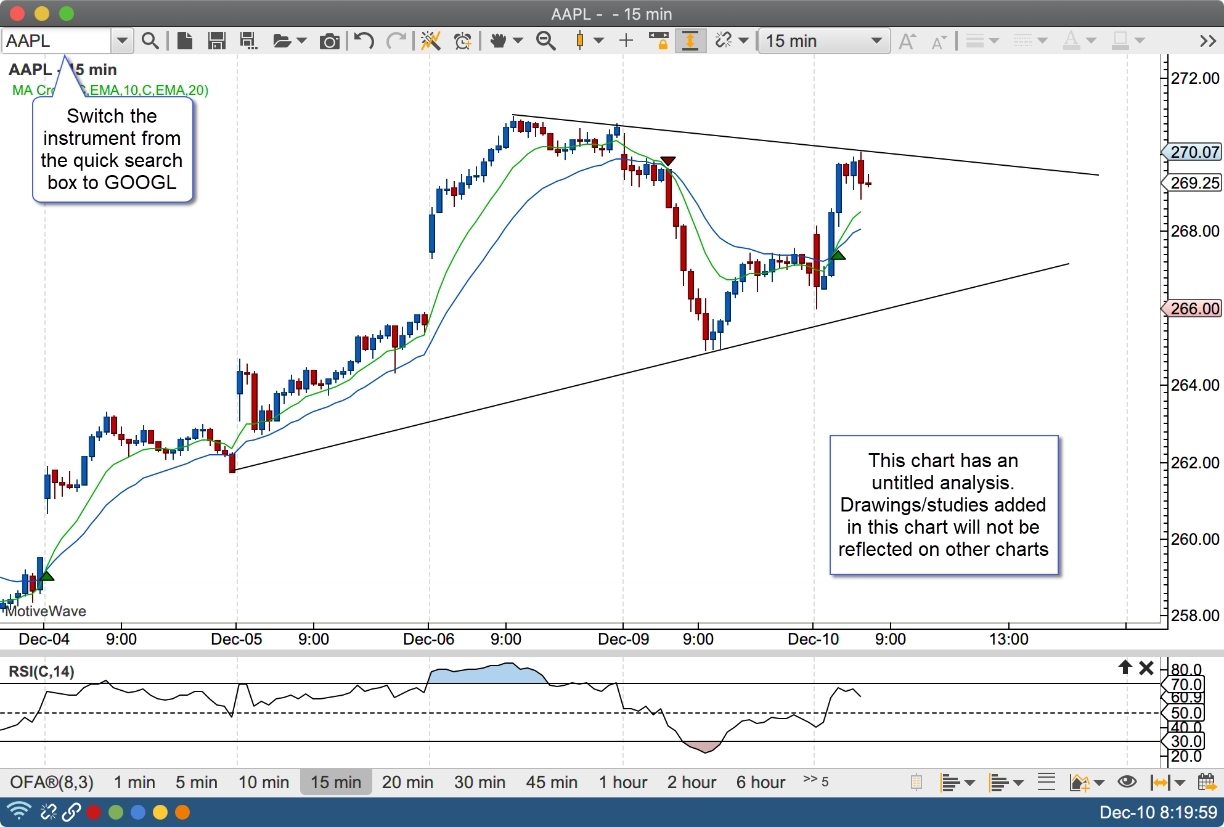
Version 6.1 of MotiveWave™ introduced the concept of untitled analyses. Untitled analyses are scoped to a chart (i.e. the contents of the chart are not shared between other charts of the same instrument). This is the behavior that you would typically see in other charting software. If your analysis is very simple or mostly based on studies, this is likely the desired behavior. These analyses are persisted with the chart when the workspace is shut down and re-opened, but unless explicitly saved the contents of the chart will be lost if the chart is closed.
Switching Chart Instrument
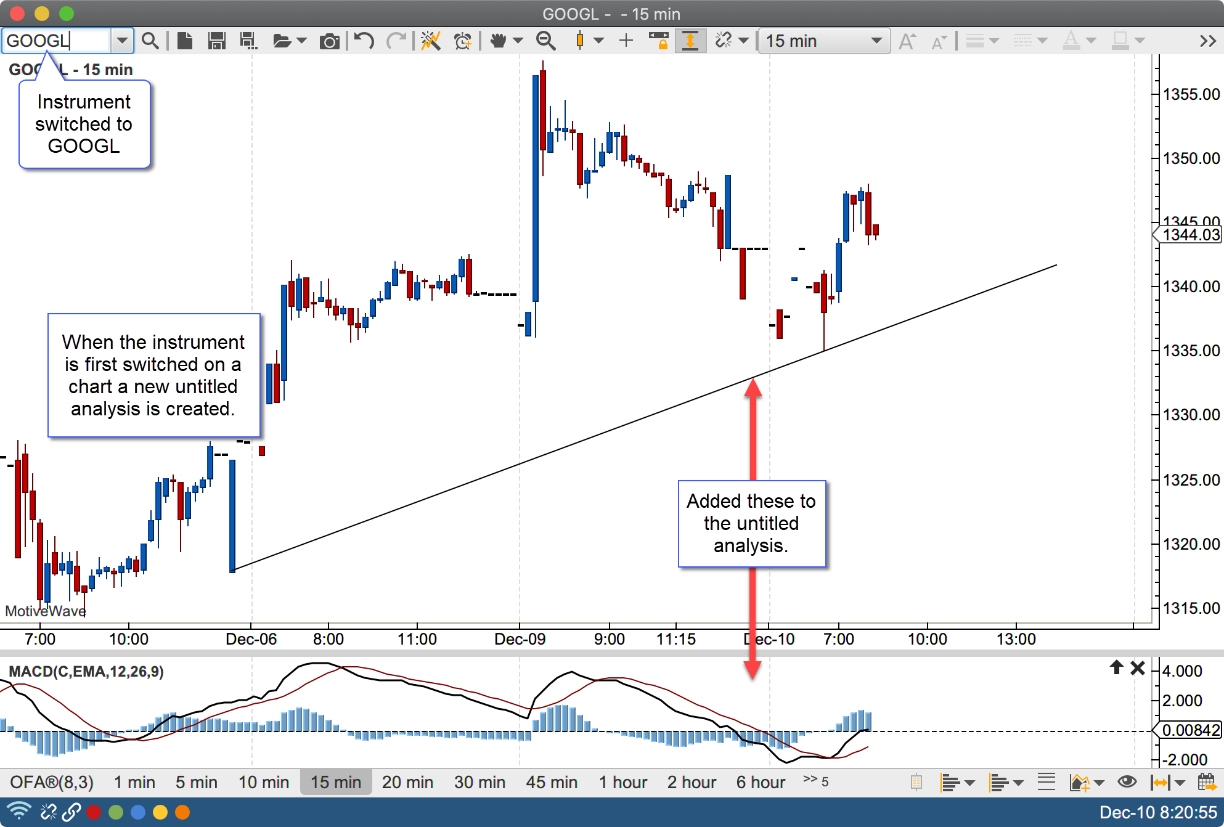
When a chart is displaying an untitled analysis, it will maintain a separate untitled analysis for every instrument that is displayed in that chart. Each of these analyses are persisted with the chart when the workspace is shutdown.
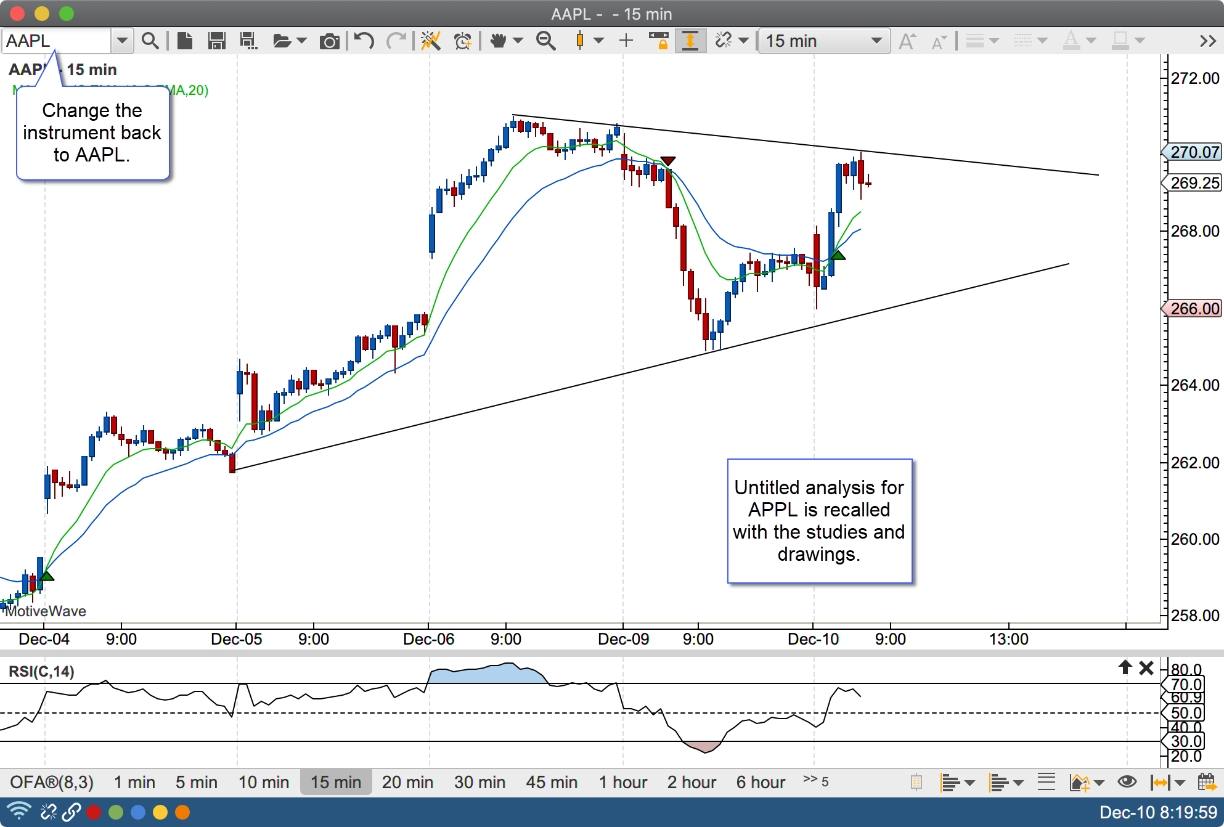
For example, open a chart for AAPL and add some drawings and/or studies to the chart. Change the instrument to GOOGL and add some drawings to that graph. If you switch back to AAPL the, drawings/studies that you added will still be there.
In the screen shot below, the instrument for the chart has been changed to GOOGL. Since this is the first time GOOGL has been displayed in the chart, a new untitled (blank) analysis will be created and displayed.
When the instrument for the chart is switched back to APPL, the retained untitled analysis for AAPL will be displayed:
Saving Untitled Analyses
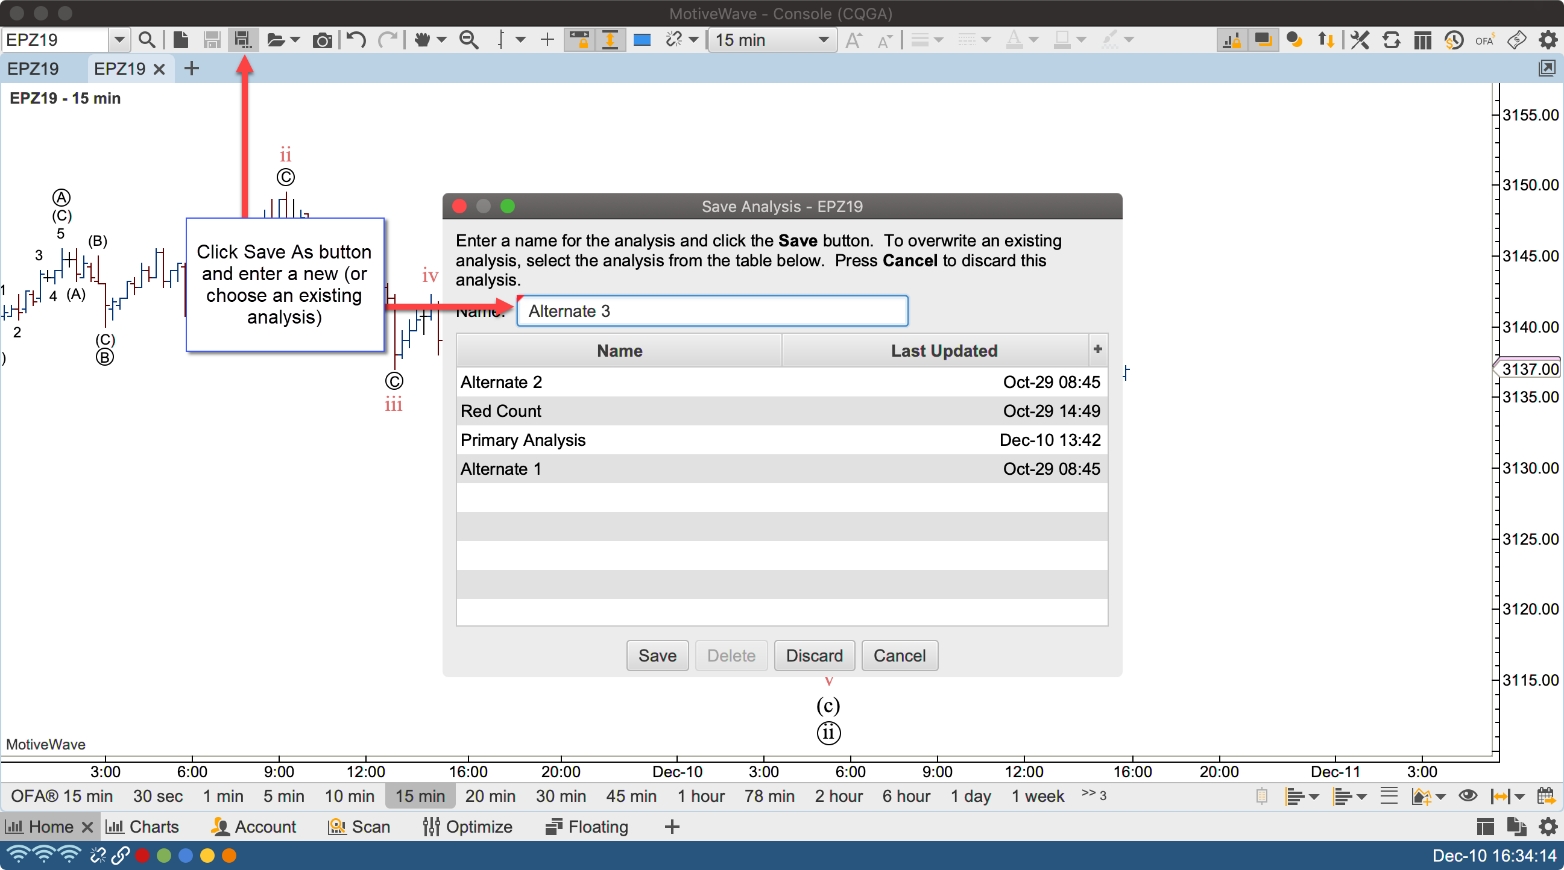
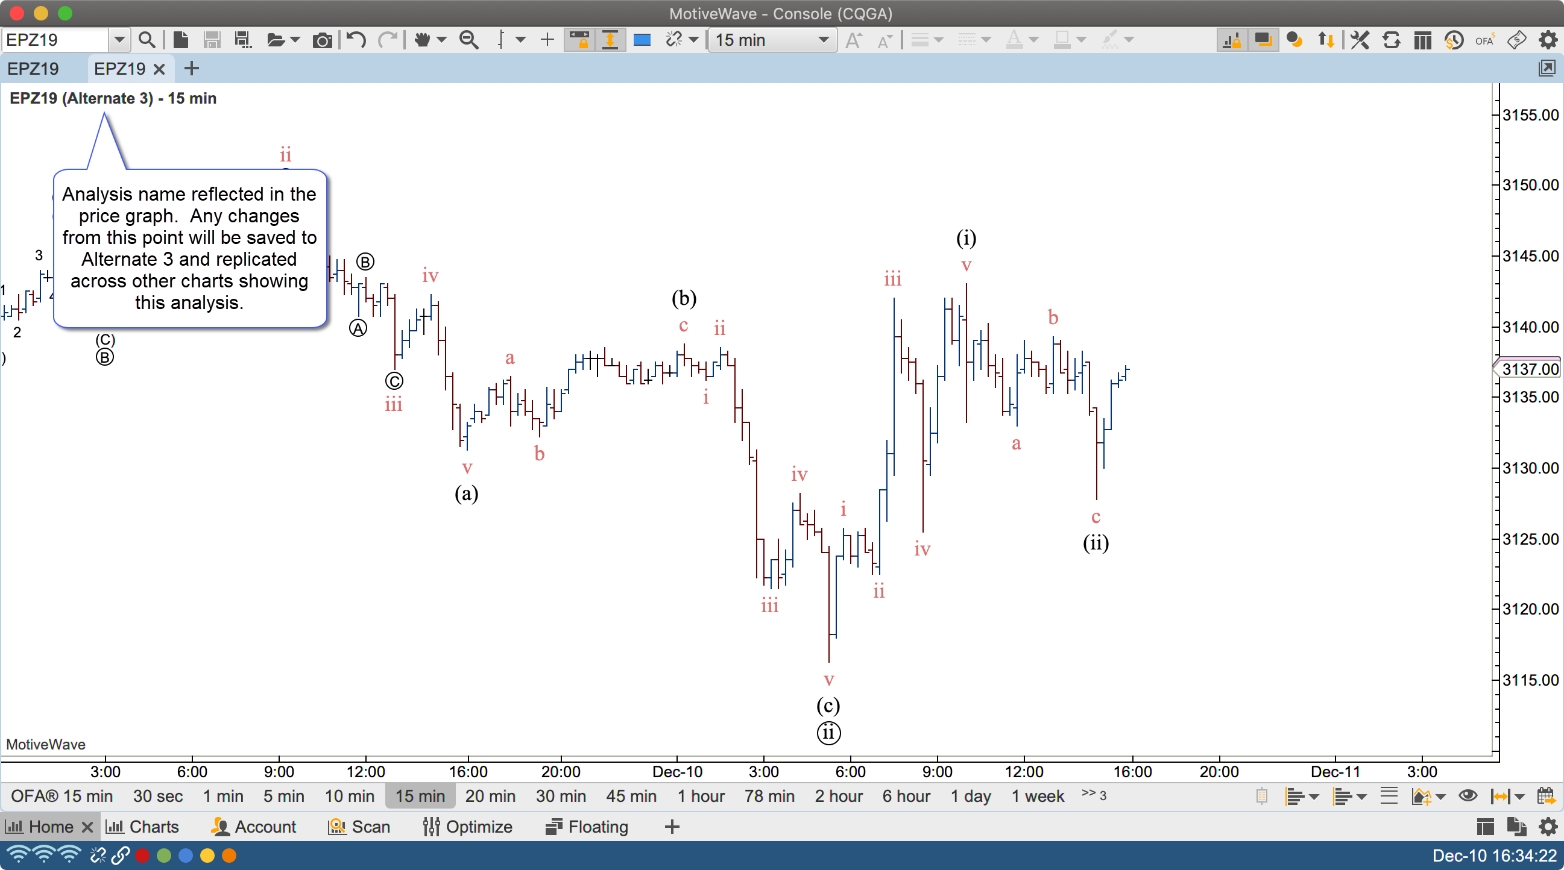
An untitled analysis can be converted into a titled analysis by clicking on the “Save As” button and assigning it a name.
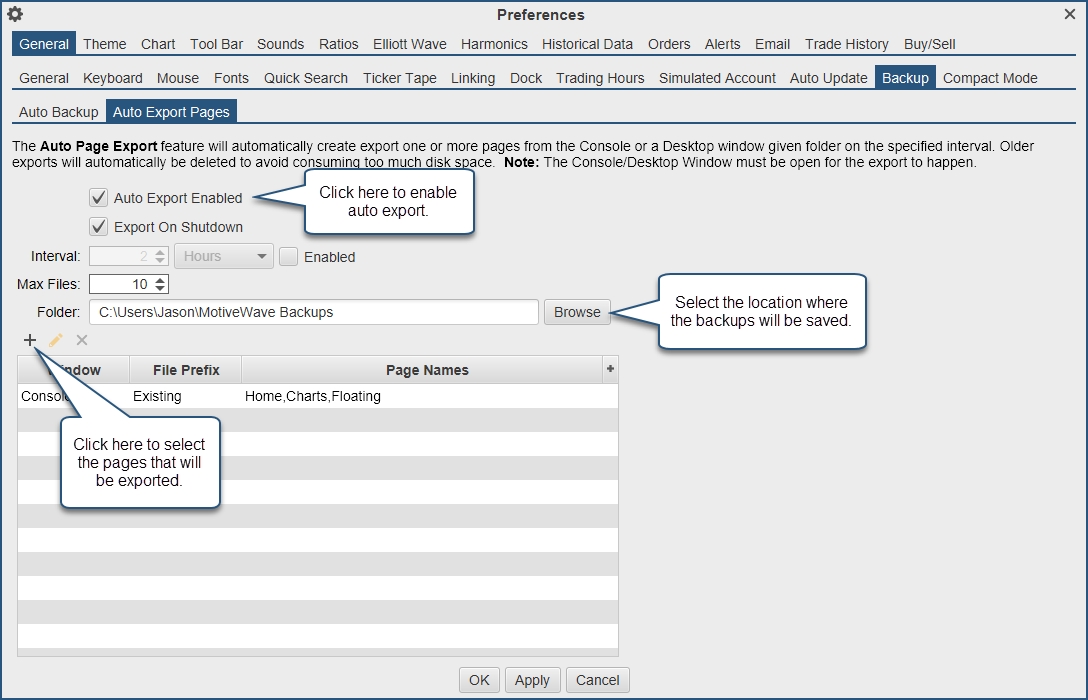
This feature allows you to export specific pages from the Console or Desktops. These pages can be imported to another instance of MotiveWave using the Import Page option (See File -> Import/Export Pages from the top menu bar). Pages can also be setup to export on a schedule. See Preferences dialog (Configure -> Preferences -> General -> Backup -> Auto Export Pages).
Export & Import Pages
Export
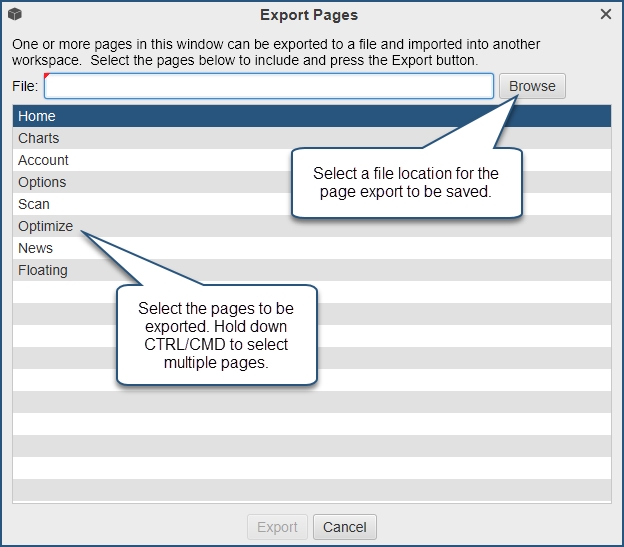
To export workspace pages go to File -> Export Pages. From here you can select multiple pages and the file save location.
Import
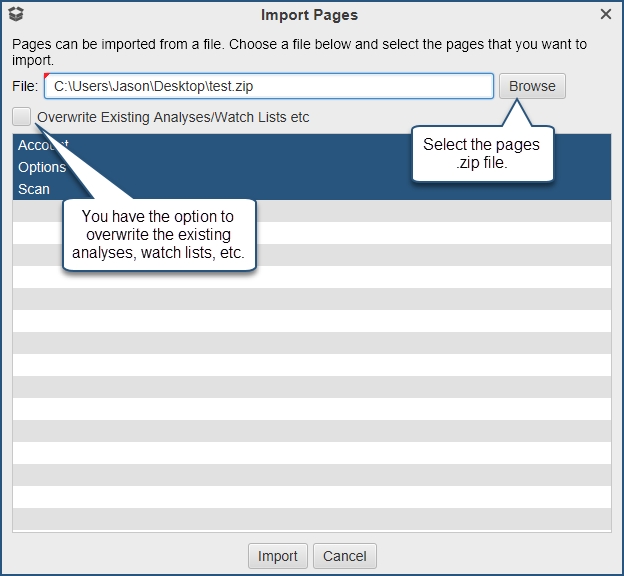
To import pages into another workspace simply select File -> Import Pages and select the .zip file.
Auto Export Pages
Pages can be automatically exported for your convenience, this can be done via the Preferences dialog. Configure -> Preferences -> General -> Backup -> Auto Export Pages.
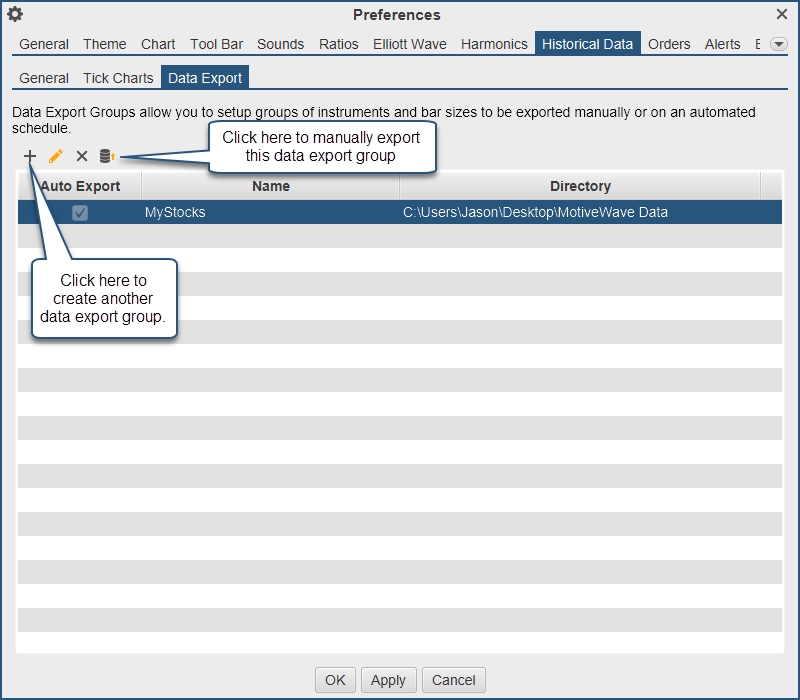
Data Export Groups
Historical data can now be exported automatically and be arranged in groups. For details see the Preferences dialog (Configure -> Preferences -> Historical Data -> Data Export).
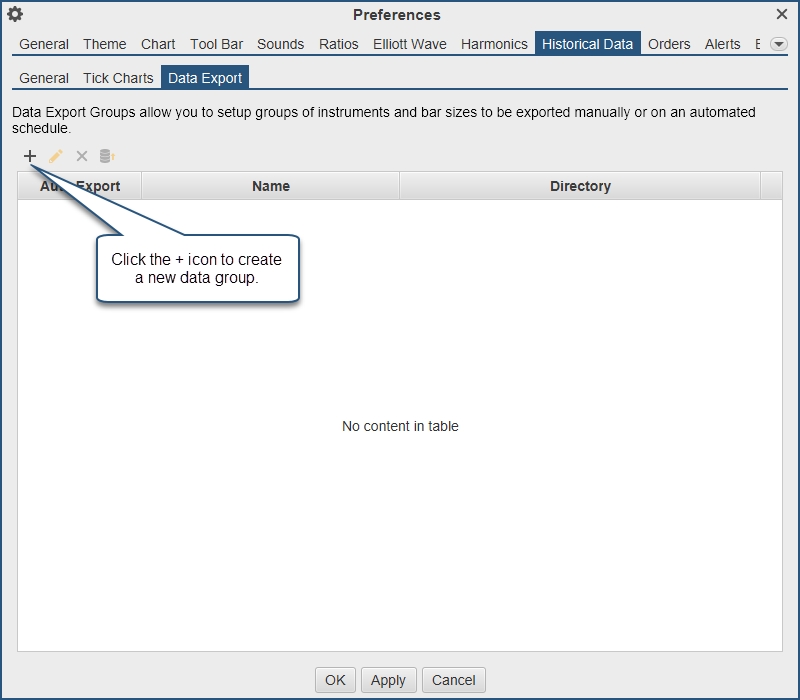
Click the + icon to create an export group.
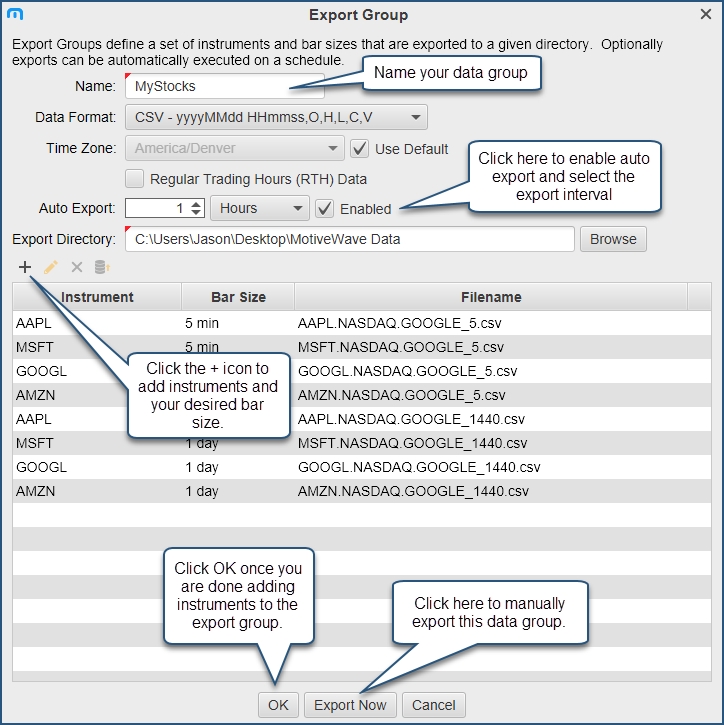
Name – Name this data export group.
Data Format – Select the desired data format for export.
Time Zone – Select the time zone you would like the time stamps to be in (used for intraday data).
Regular Trading Hours Data – Select this to export RTH data only.
Auto Export – Enable this to automatically export this group at your selected time interval. Note, you will need to restart MotiveWave for the Auto Export function to begin.
Export Directory – Click Browse to select the folder/directory you would like this data stored.
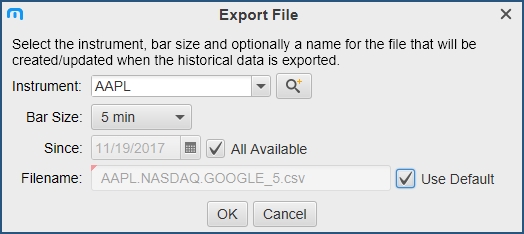
Click the + icon to add an instrument, from this dialog you can search for an instrument, select the bar size, the amount of data and the filename of the CSV file. You are also able to export multiple bar sizes for each instrument.
Click Export Now to manually export the data group. Click OK once you are finished adding instruments to this export group. Please note that any subsequent manual or automatic exported data group will be appended to the original CSV file.
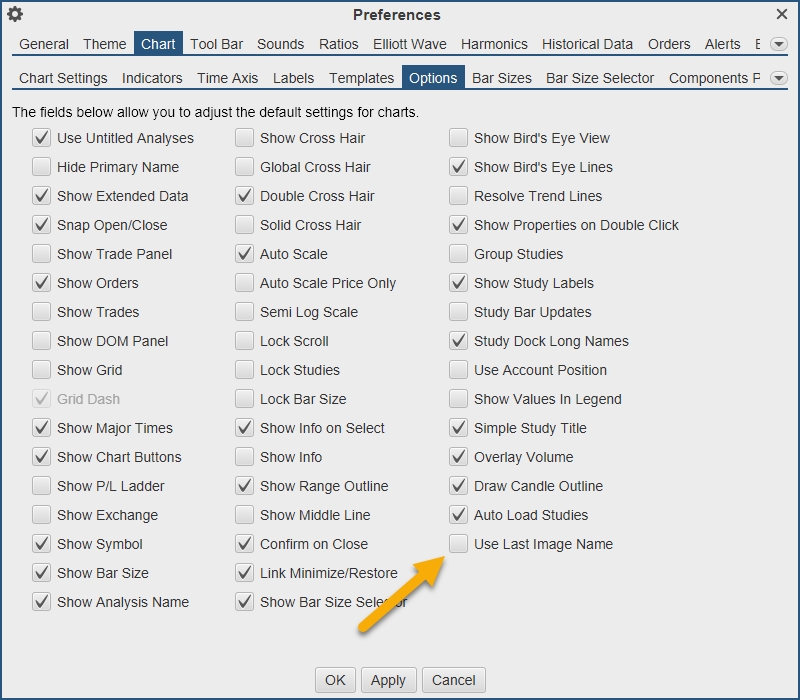
Save As Image Name
A new chart option “Use Last Image Name” (default off) has been added to the Chart Options panel (Configure -> Preferences -> Chart -> Options). If this option is enabled the last Save As Image file name will be used the next time you save the chart as an image (instead of generating the file name with the latest timestamp).
Studies
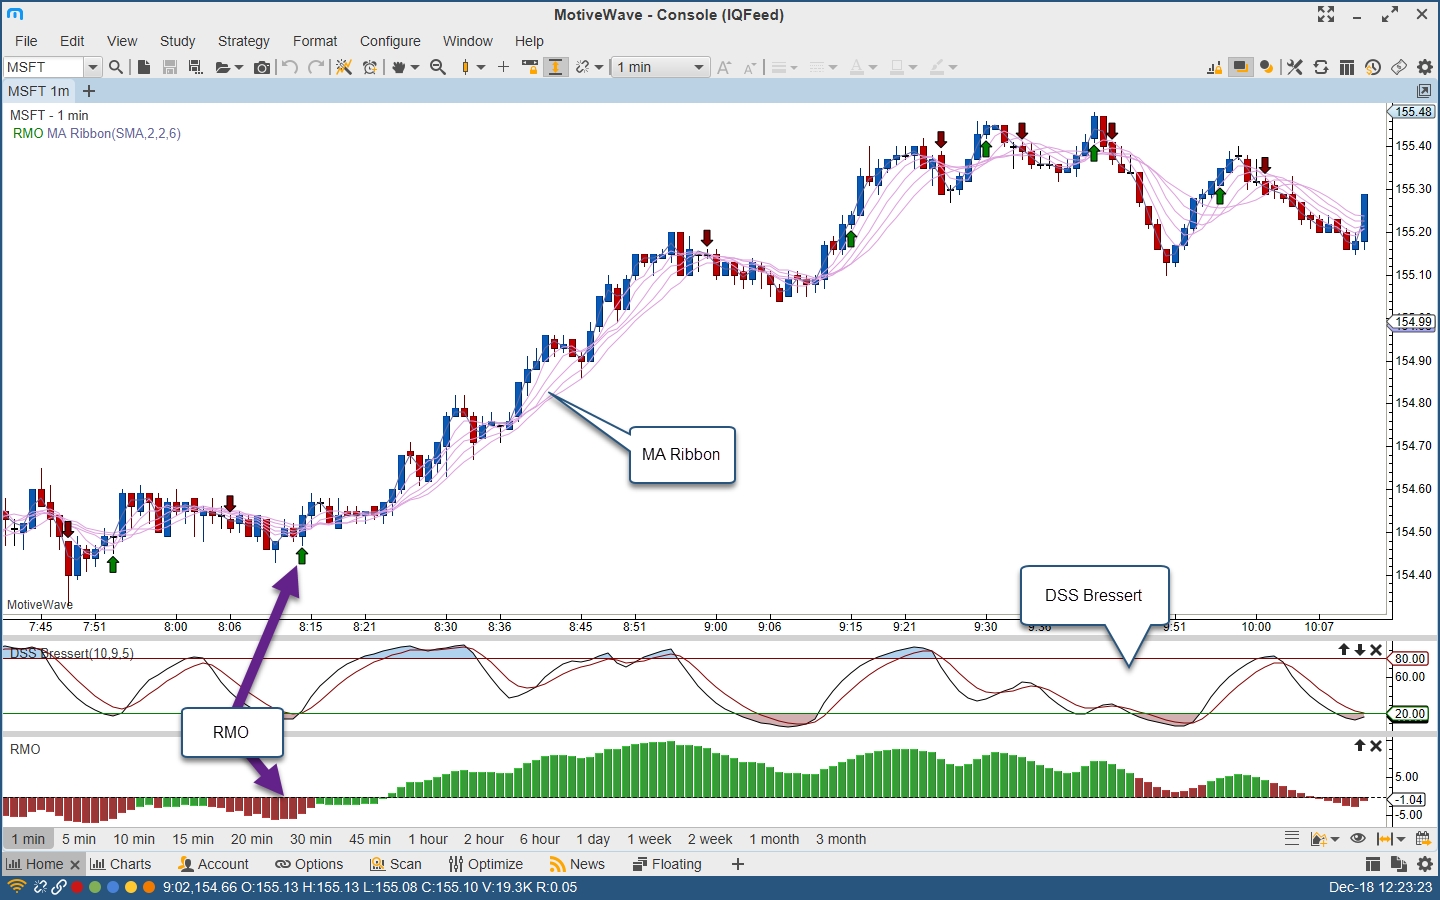
DSS Bressert
Created by Walter Bressert. This oscillator is based on the Double Smooth Stochastic (by William Blau). It combines moving average methods with oscillator principles.
Rahul Mohinder Oscillator (RMO)
Created by Rahul Mohinder. This oscillator provides a gauge to market direction. Movement above the zero line indicates a buy sign and a sell sign below the zero line.
Moving Average Ribbon (MA Ribbon)
Creates a series of moving averages (MA) using the given method and period. Each moving average in the series will increment the period using the step.
Depth of Market
A few enhancements have been made to the Depth of market (DOM).
Bid/Ask Scaling
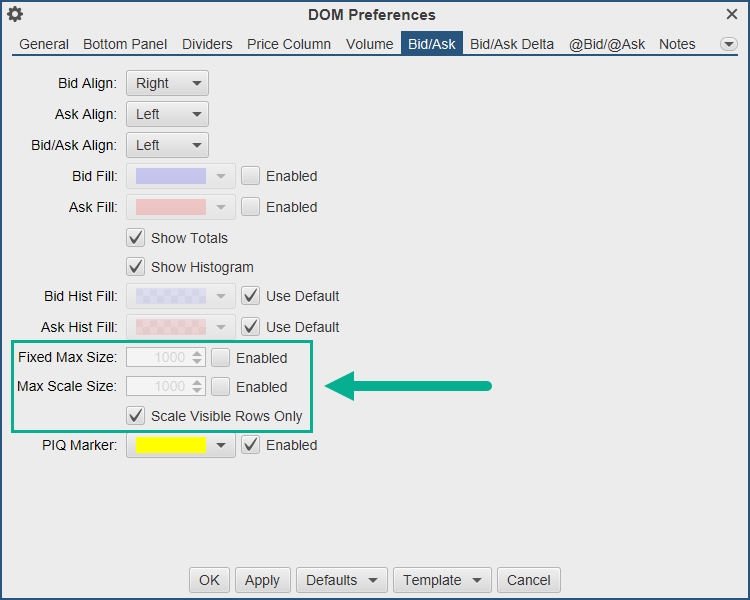
Three additional options have been added for scaling the histogram for the bid/ask columns:
Fixed Max Size – Sets the maximum size for the bid/ask columns to a fixed value.
Max Scale Size – Sets an upper limit on the max bid/ask sizes. Use this to lessen the effects of unusually large bid/ask values.
Scale Visible Rows Only – If enabled the scaling will be based on the max values for the visible rows only (instead of all DOM rows).
Bid/Ask Column
Added an additional column that combines the bid/ask sizes into a single column.
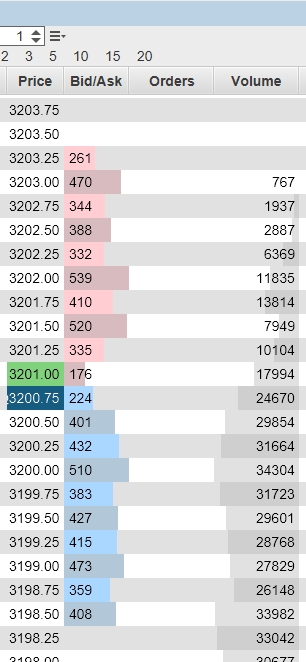
Orders Column
Added the following enhancements to the DOM Order Column:
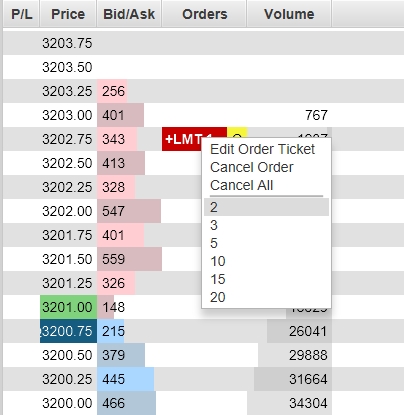
Auto Hide Cancel – The cancel button is only shown when the cursor hovers above the order.
Context Menu – The context menu (right click) shows pre-set quantities for quickly modifying the order quantity.
NT Renko Bars
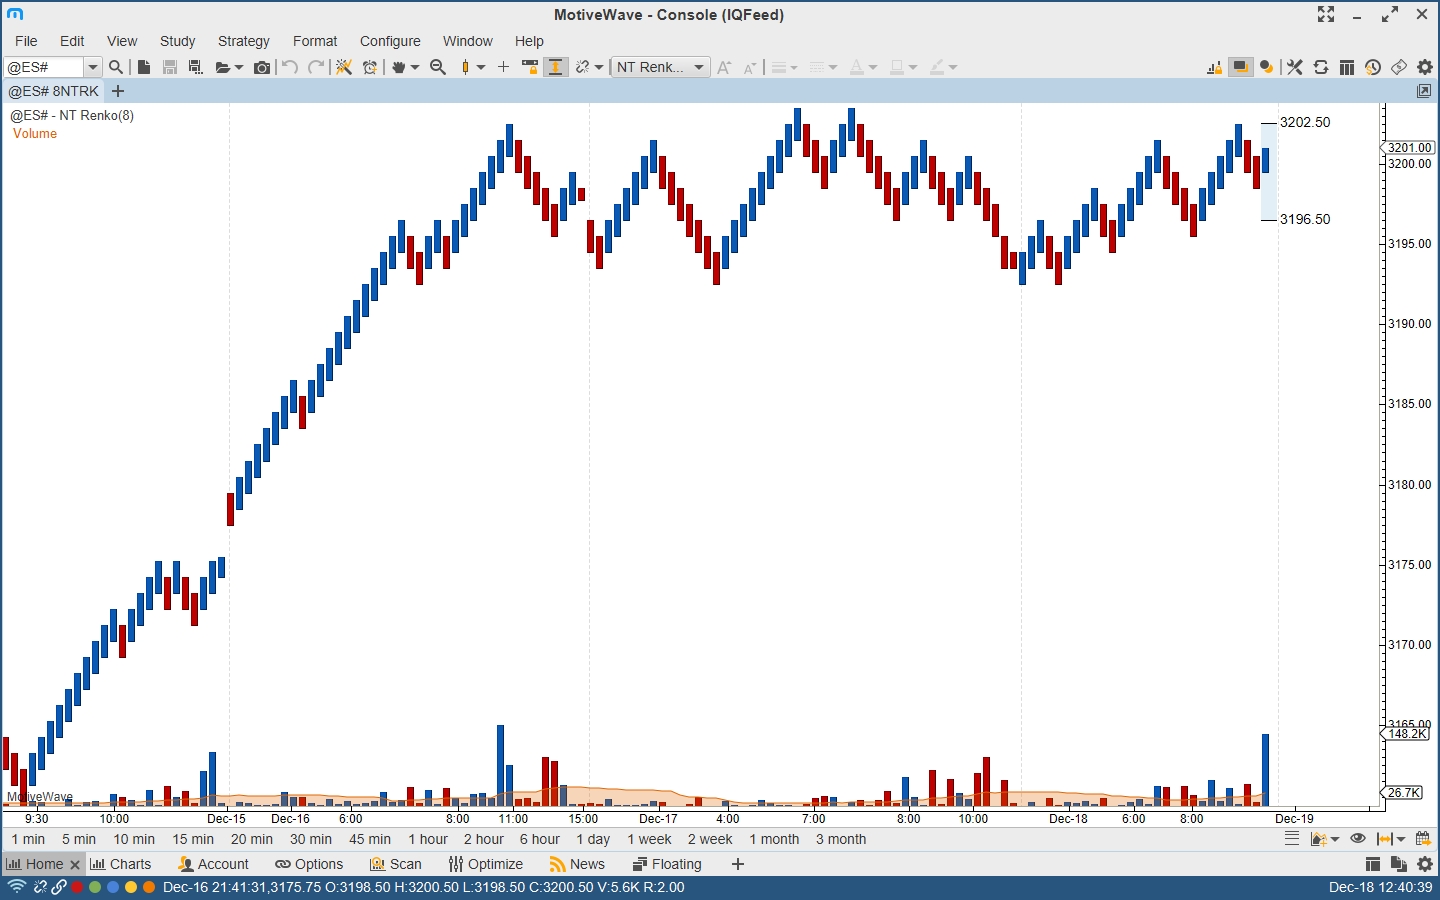
This specialized version of Renko bars starts the next bar at the midpoint of the previous bar (instead of at the top/bottom of the previous bar). This bar type was developed by Newbie-Trader: https://www.newbie-trader.com/
Other Enhancements
Elliott Wave Preferences
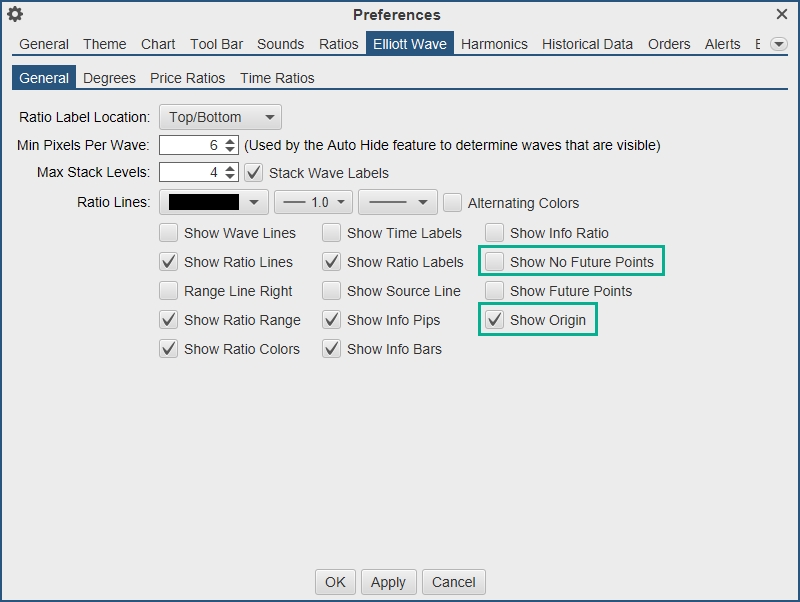
The following options have been added the Elliott Waves. See Preferences dialog “Elliott Wave” tab and the Component Properties dialog (double click on the wave):
Show Origin – If unchecked, the origin point will not be shown (even if it is the top-level wave).
No Future Points – If checked, none of the future points will be displayed. This is in contrast to the Show Future Points being unchecked where only the first future point is displayed.
Commentary Components
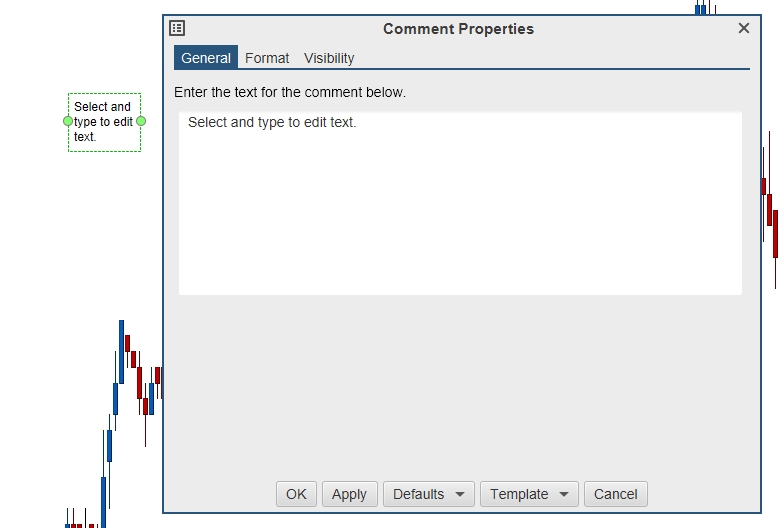
The text for comments can now be modified in the component properties dialogs (right click and choose “Properties” from the comment). Additionally, changing this text as part of a custom component/tool will change the default text when the component is created.
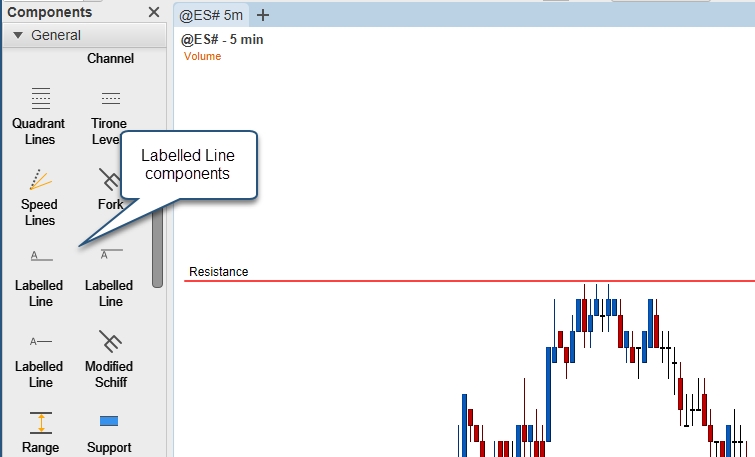
Labelled Line
This new component draws a horizontal line with a customizable label attached to it. This component can be found in the “General” stencil (see Components Panel).
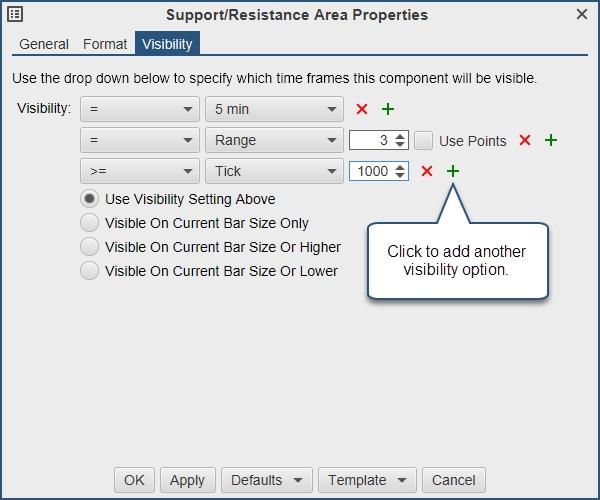
Visibility Options
You can now add multiple visibility options to a component, study or wave/time ratio. An object is visible when one of the visibility conditions is met.
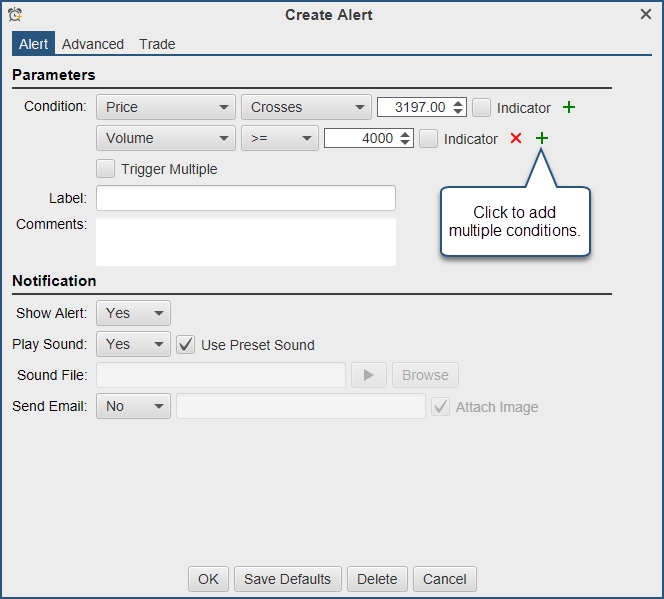
Alert Conditions
Multiple alert conditions are now allowed when creating/modifying an alert.
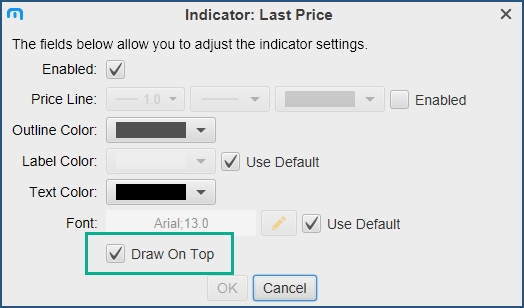
Indicator “Draw on Top”
Added an option to draw an indicator on top of the other indicators. This is on by default for Bid, Ask and Last price. This feature is also available for study indicators (see advanced properties).
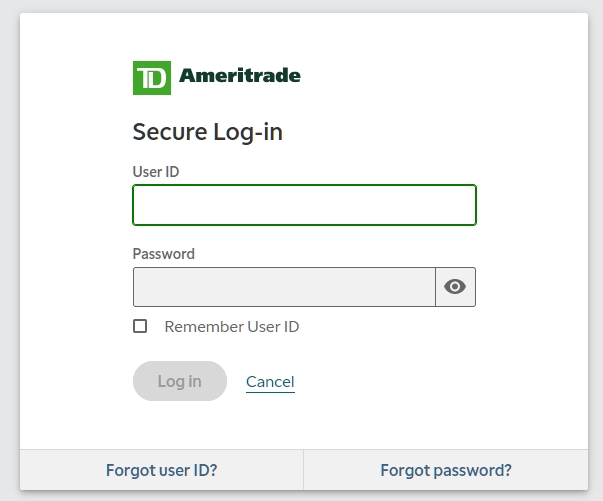
TD Ameritrade Login
The login procedure has been changed to use a browser-based login. This was done to comply with TDA's new API login procedure.
Java 13
MotiveWave version 6.0.2 was updated to the latest Java VM. This will require a full install on Windows (ie: download the latest installer from our website and run it on your local machine). Download available from https://www.motivewave.com/download.htm
Last updated