Studies
MotiveWave™ has over 300 built in studies that can be used to display information on the price plot or separately in a plot below the price.
There are essentially two types of studies:
Overlays – display information that is drawn on top of an existing plot (most typically the price plot)
Study Plots – display information that is displayed in a plot that is separate from the price plot.
Adding a Study
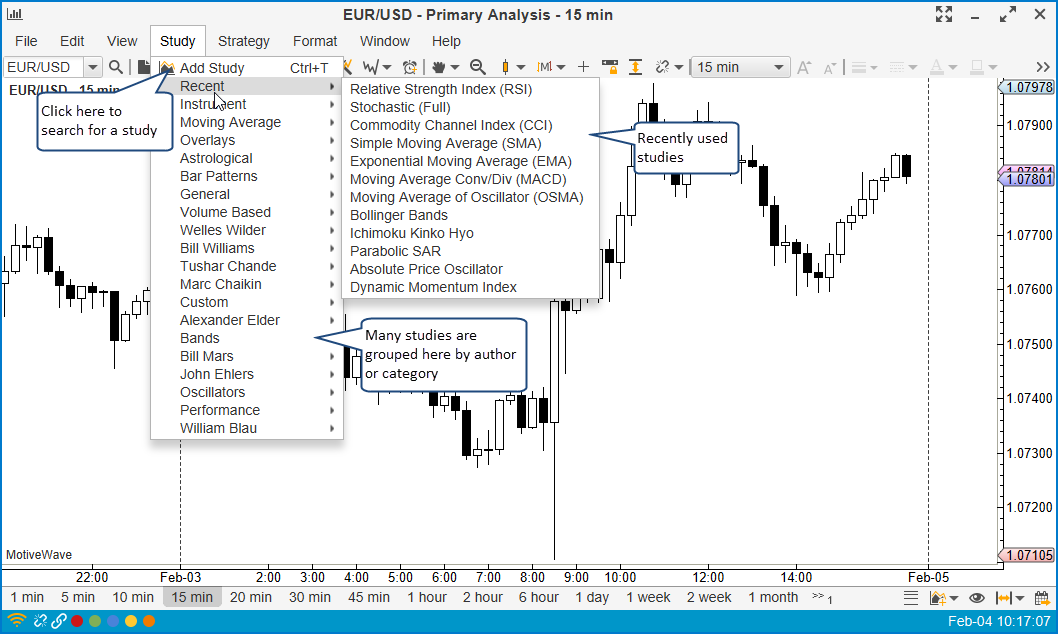
A study may be added to a chart by choosing one of the available studies can be found under the Study menu from the top menu bar. This menu organizes some (not all) of the studies into logical groups (based on author or function). The Add Study option enables you to search for a study instead of trying to find it in a sub-menu. For convenience, a Recent menu is available to access recently used studies.
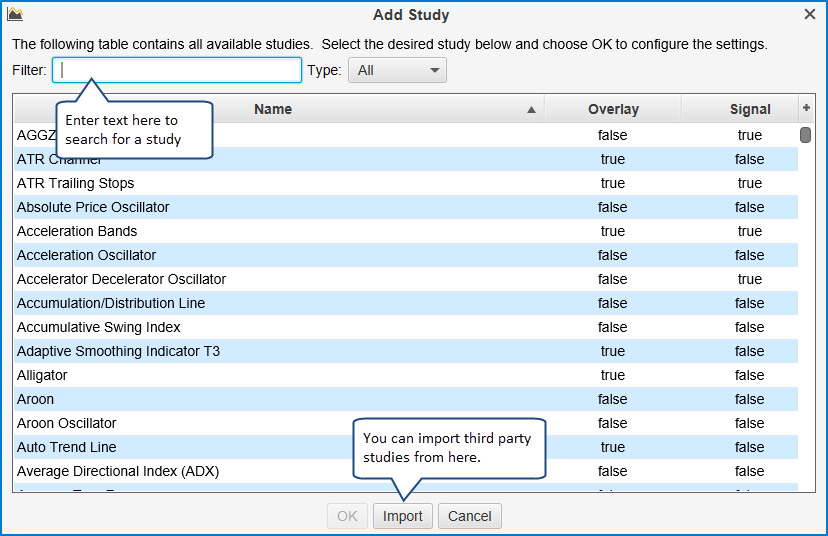
If you choose Add Study, you will see the following dialog. This is a convenient way to search for a study by typing it in into the Filter input (see below):
When you add or edit a study you will see the study dialog similar to the one displayed below. Each study will have different settings and configuration options. The available tabs will depend on the study, but all study dialogs will have an Options tab and a Signals tab (if it generates signals).
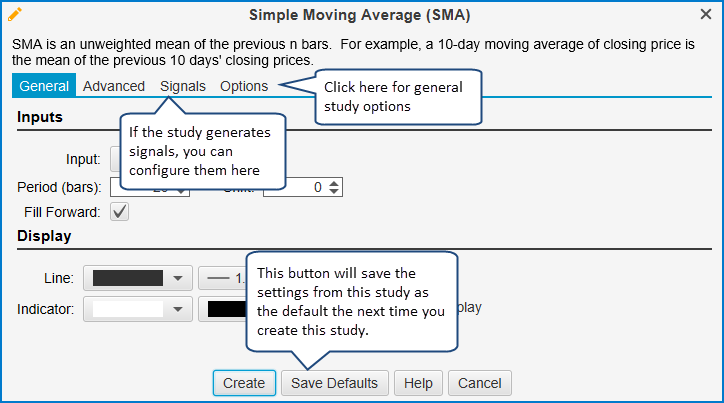
Adjust the settings for the study and click on the Create button to add the study to the chart. For convenience, you can click on the Save Defaults button to save the study settings for the next time you create this study.
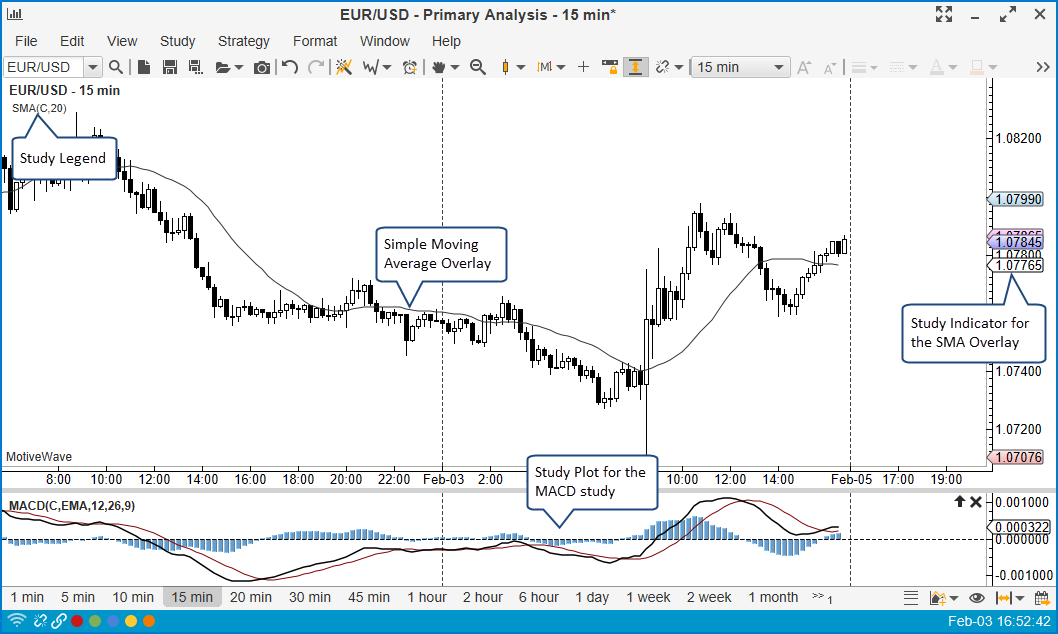
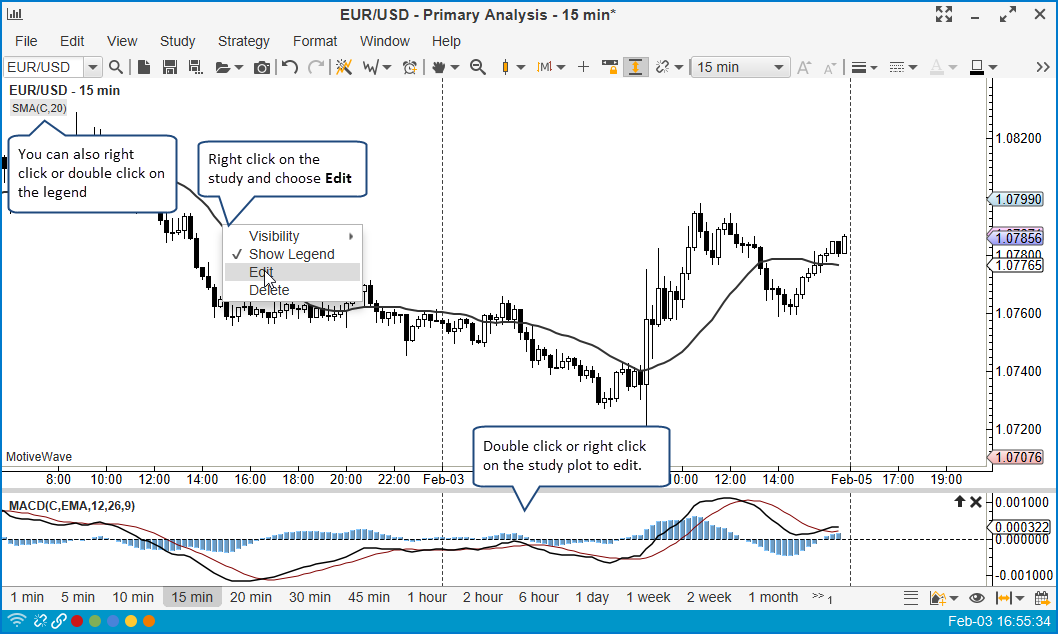
The following screenshot shows the Simple Moving Average (SMA) study from the Study dialog above. Also shown is a Study Plot for the MACD study.
Editing a Study
If you would like to edit the settings on a study simply double click or right click and choose Edit Study.
Study Options
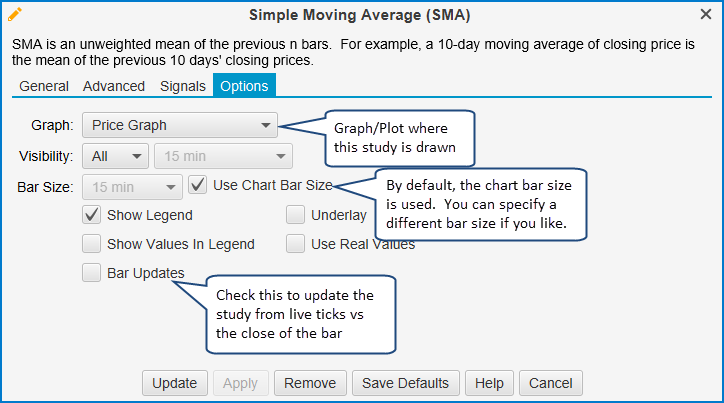
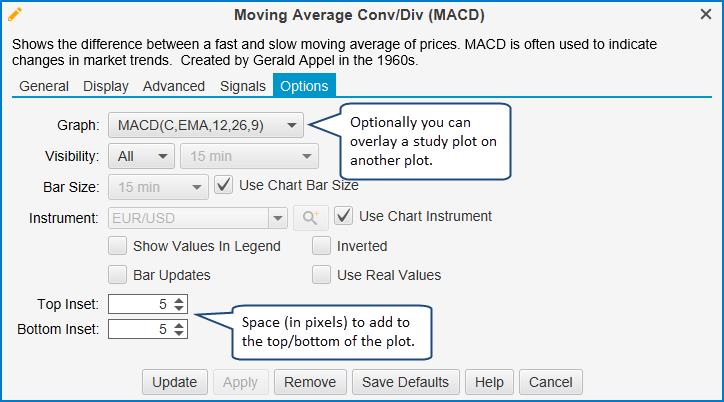
All studies will have an Options tab as the last tab when you create or modify its settings. This tab will contain different values if it is an overlay or a study plot.
Overlay Plot
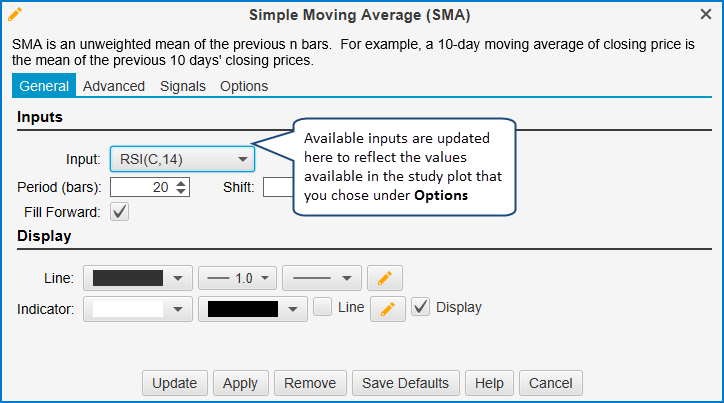
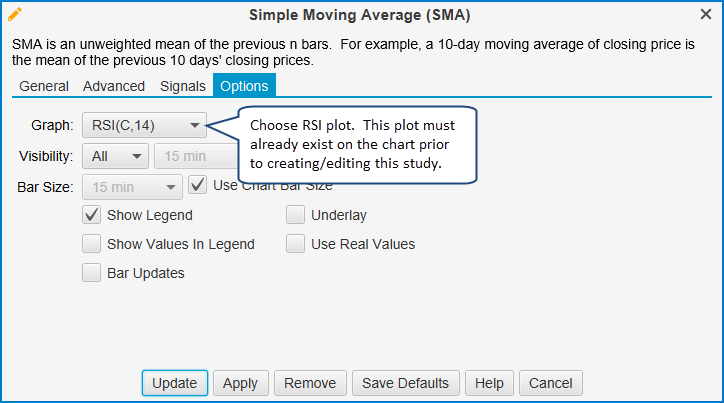
When you create an overlay study, by default it will use the Price Plot. Optionally, you can choose one of the existing plots to display the study. When you change the graph for the study, it will change the input options. For example, if you want to display a simple moving average (SMA) on an RSI study plot, you would choose the RSI(C,14) plot from the Options tab. When you choose this, the Input field (under the General tab) will be updated to reflect the inputs available from the RSI plot.

Study Bar Size
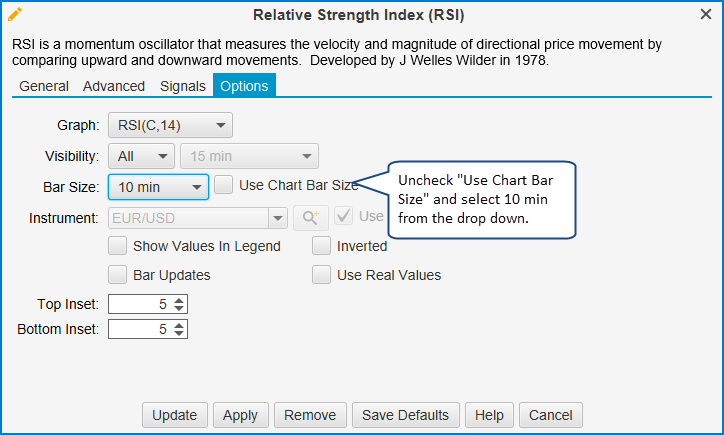
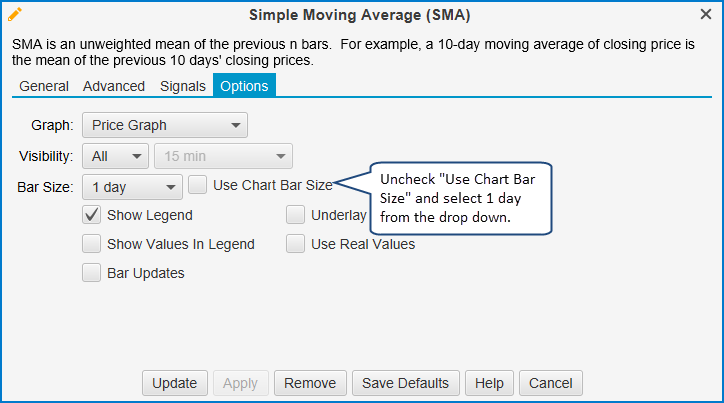
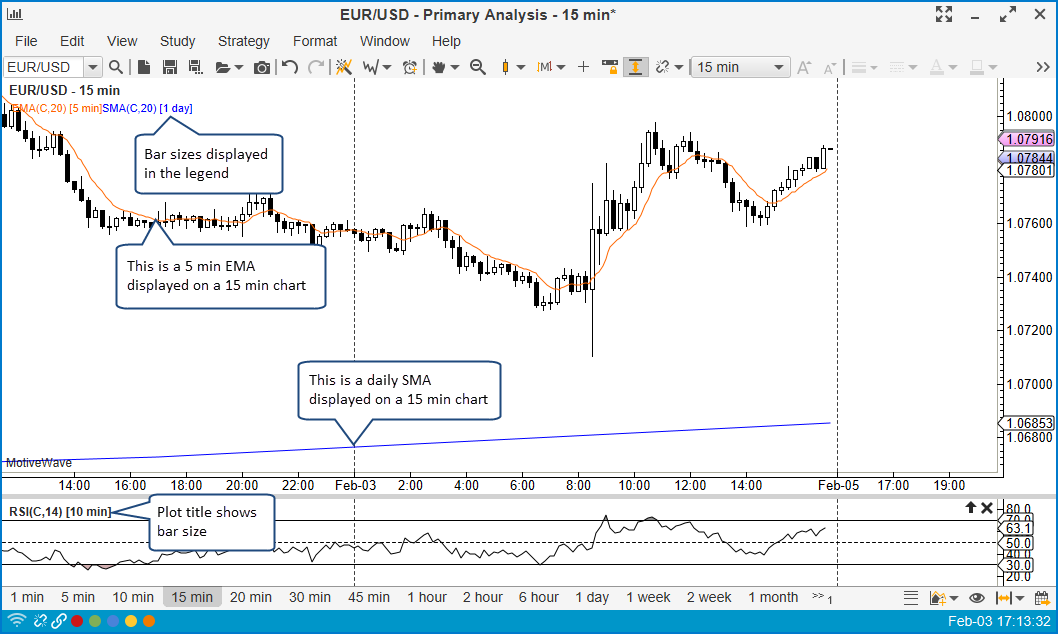
By default when you create a study, it will use the bar size of the chart. When the chart bar size changes, the study will be automatically updated to reflect the new bar size. MotiveWave™ does allow you to choose a specific bar size for the study. This allows you to, for example, display a 1 day SMA (Simple Moving Average) on a 15 minute chart. This feature also applies to study plots so you could display a 10 minute RSI on a 15 minute chart (see example below):
Study Plot Overlay
Study plots may be overlaid on other plots. You may have noticed this feature already with the Volume overlay on the default layout of the Console:

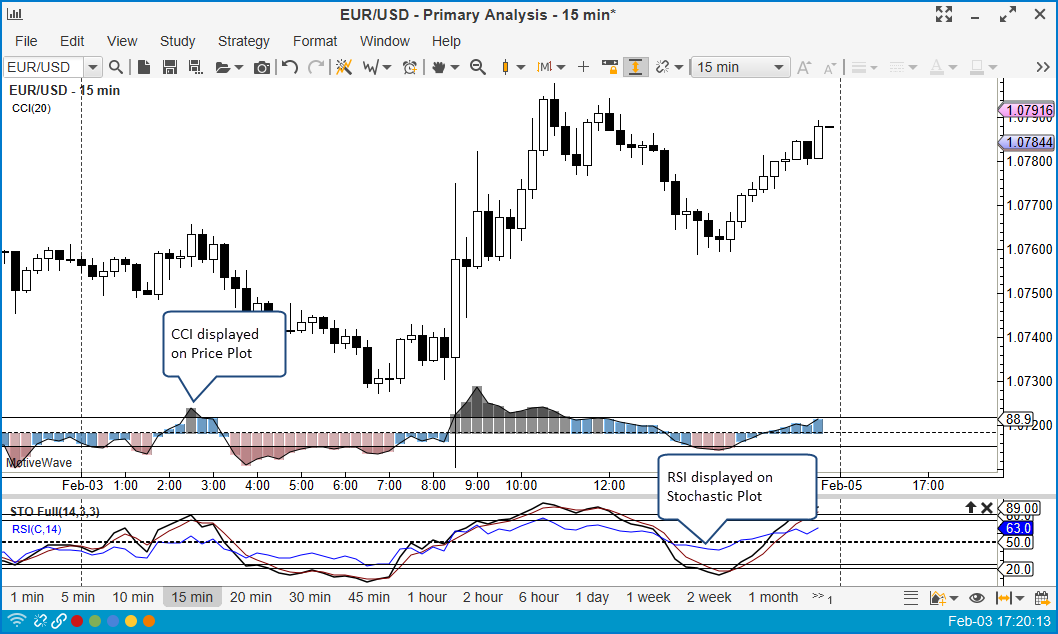
You can change the overlay plot for a study from the Options tab. A study plot can be overlaid on the Price Plot or other study plots. The following examples show a CCI plot on the Price Plot and an RSI plot on a Stochastic plot:
Study Visibility
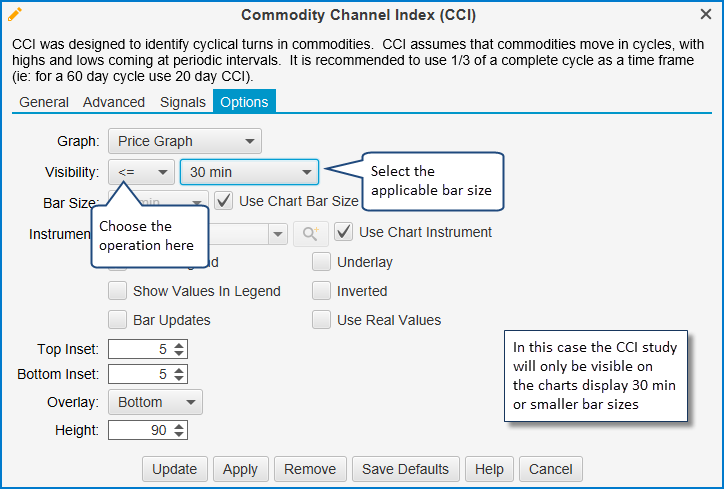
For convenience, you can specify that a study is only visible on certain bar sizes. This is similar to the visibility feature for components. By default a study is visible on all bar sizes. You can change this from the Options tab:
Signals
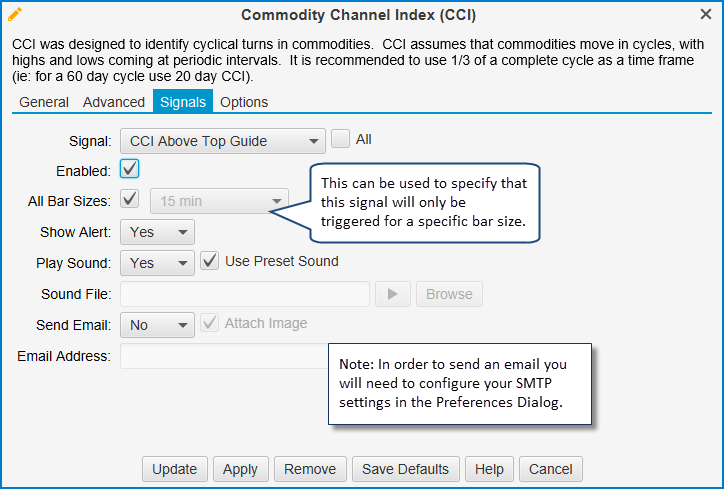
Some studies generate signals. Signals occur when a specific event occurs with the study. For example, a signal may be generated in a CCI study where the CCI value crosses above the top guide. These signals can be used to show alerts, play sounds or even send an email notification. Note: if you want to send emails, you will need to configure your email (SMTP) settings in the Preferences dialog (Configure -> Preferences from the Console menu bar). You will find these options under the Email tab.
Instrument Overlay
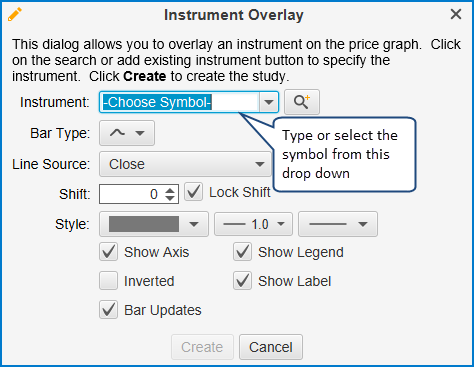
An instrument can be overlaid on top of the price plot by choosing Study -> Instrument -> Instrument Overlay from the top menu bar. This action will open the dialog displayed below. Type (or select from the drop down) the instrument that you would like to overlay in the Instrument field. Click on the Create button to add this overlay to the price plot. This dialog has the following elements:
Instrument – Type or select the instrument.
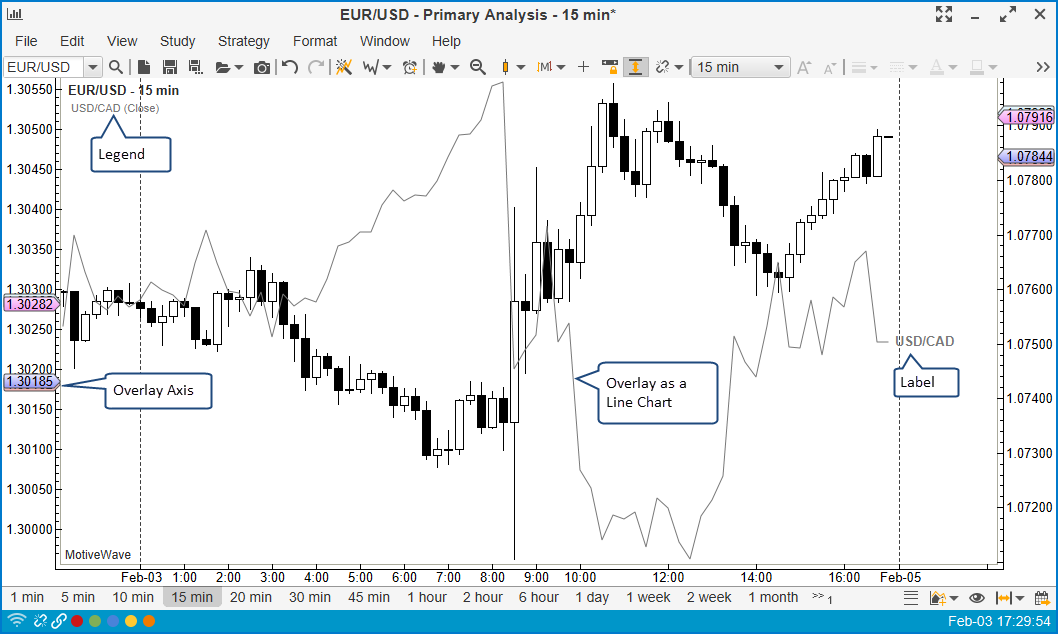
Bar Type – Choose the type of bar you would like to display for the overlay (default is a line chart)
Line Source – If a line chart is chosen, this option allows you to choose the input source for that line (ie closing price, opening price etc)
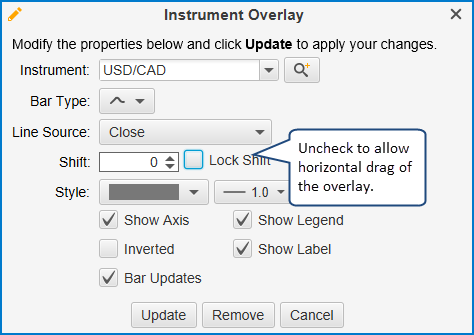
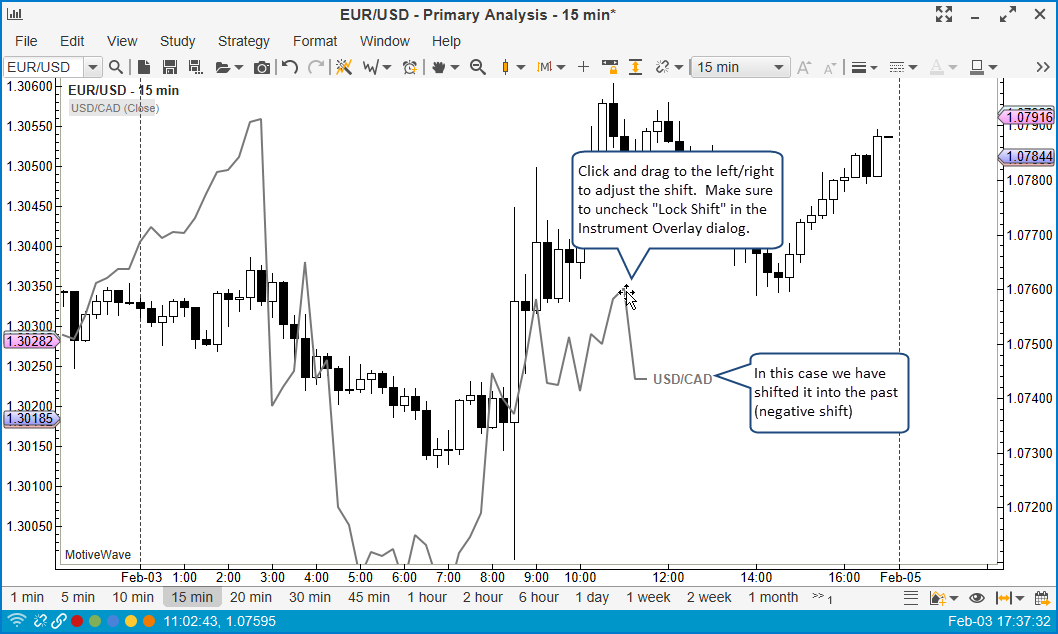
Shift – the number of bars to shift the study forward (negative value for backward). Uncheck Lock Shift to enable dragging of the overlay backward or forward using the mouse.
Style – For line charts, choose the color, thickness and style of the line.
Show Axis – displays the axis for the instrument on the left hand side of the price plot
Inverted – Click to display the overlay upside down
Bar Updates – Click to enable live updates to the overlay instead of updates on the close of the bar
Show Legend – Shows the overlay in the study legend area
Show Label – Displays a label at the end of the overlay for the Instrument symbol
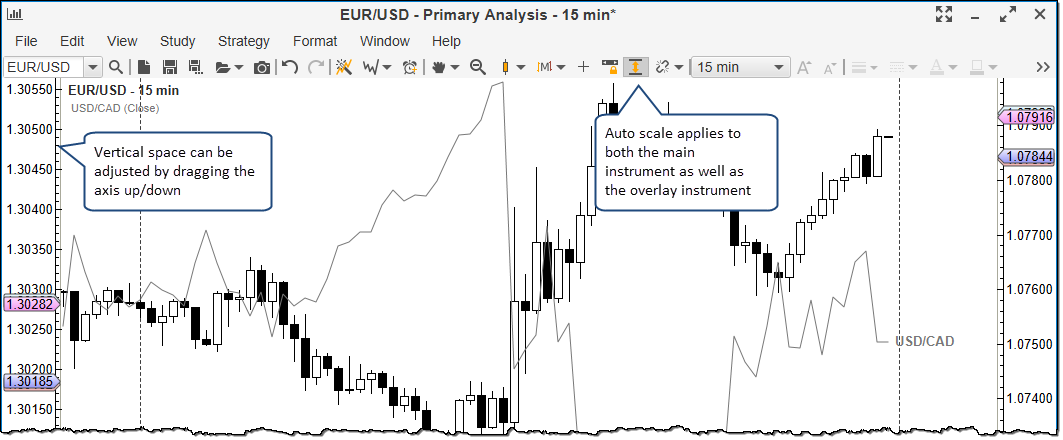
The example below shows an instrument overlay for the USD/CAD pair on top of the price plot for the EUR/USD pair. The axis for the USD/CAD pair is displayed on the left hand side and has indicators for the current prices. With Auto Scale enabled, dragging the chart left or right will automatically scale the values for the overlay.
The vertical scale of the overlay can be adjusted by clicking and dragging the space between the overlay axis and the price plot. Dragging from the top or bottom will add more top/bottom space. Drag from the middle to adjust both at the same time.
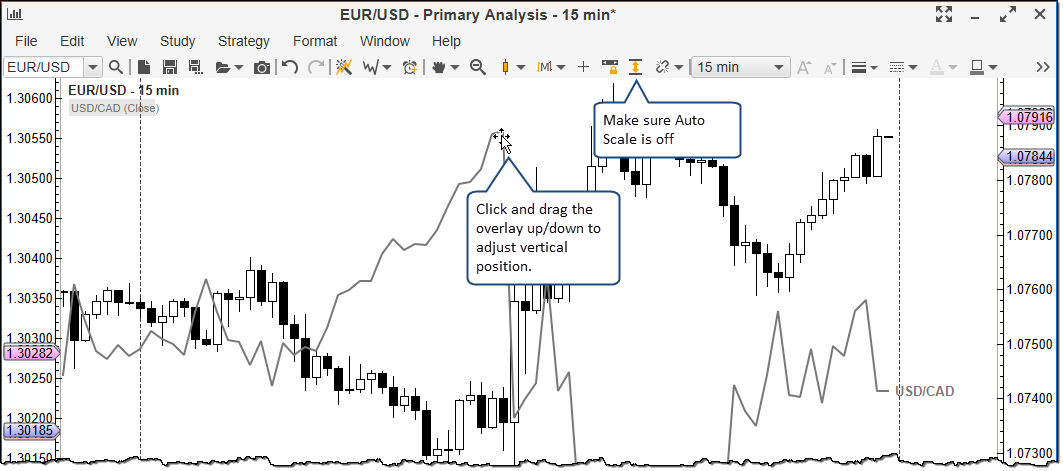
If auto scale is disabled, you can click and drag the overlay up or down to adjust the location of the overlay relative to the main instrument axis.
The horizontal location of the overlay can be adjusted by changing the value of the Shift field in the Instrument Overlay dialog. A positive value will shift the overlay into the future and a negative value will shift it into the past. If you uncheck the Lock Shift option you will be able to adjust the shift by dragging the overlay to the left or right with the mouse.
Last updated