MotiveWave Docs
MotiveWave.com
  • User Guide
    • Welcome
    • Quick Start Guide
      • Getting Started
      • Installation
      • Customization Options
      • Advanced Features
      • Troubleshooting and Support
      • Next Steps
    • Console Overview
      • Preferences
      • Changing the Look and Feel
      • Desktops
      • Quote Sheets
      • Backup and Restore
      • Repository
      • Email Configuration
      • Docking Framework Guide
        • Introduction
        • Stations
        • Pages
        • Layouts
        • Customization
    • Accounts Panel
      • Simulated Account
      • Commissions
    • Alerts
    • Charts
      • Settings
      • Chart Spacing
      • Bar Sizes
      • Importing Data
      • Exporting Data
      • Birds Eye View
      • Cursor Data
      • Depth Of Market
      • Chart Labels
      • News
      • Watermark
      • Scaling
      • Analyses
      • Ratios
      • Time and Price Guides
      • Percent Change Charts
      • Software Development Kit
      • Lock Studies
      • Lock Scroll
      • Study Templates
      • Linking Charts
      • Working With Chart Windows
      • Ticker Tape
      • Chart Trading
      • Data Export Groups
      • Analyses Guide
        • Introduction
        • Managing Analyses
        • Sharing Analyses
    • Components
    • Depth Of Market
    • Elliott Wave
    • Hurst Cycles
      • Introduction
      • Study Overview
      • Using the Hurst Cycle Study
    • Instruments
      • Custom Instruments
    • Option Chain
    • Order Flow
      • Introduction
      • Time Price Opportunity (TPO) Study
      • Volume Imprint
      • Depth of Market
      • Time and Sales
      • Delta Volume
      • Cumulative Delta
      • Bid/Ask Volume
      • Speed of Tape
      • DOM Power
      • Order Heatmap
      • Big Trades
      • Speed Gauges
      • Components
    • Pages
    • Preferences
      • General
      • Theme
      • Chart
      • Toolbar
      • Sounds
      • Ratios
      • Elliott Wave
      • Harmonics
      • Historical Data
      • Orders
      • Alerts
      • Email
      • Trade History
      • Buy/Sell
    • Replay Mode
    • Scanner
      • Scanner
      • Creating a Scan
      • Executing a Scan
      • Editing a Scan
      • Elliott Wave Scanner
      • Harmonic Scanner
      • Study Scanner
    • SDK Programming Guide
      • Preface
      • Change History
      • Introduction
      • Fundamental Classes
      • Overlay Example
      • Study Plot Example
      • Drawing Figures
      • Signals
      • Tick Data
      • Strategies
      • Logging
      • Internationalization
      • Deployment
      • Environment Setup
    • Shortcuts
    • Strategies & Backtest
      • Strategy Back Testing
      • Creating a Strategy Analysis
      • Strategy Analysis
      • Strategies
    • Studies
    • Time and Sales
    • Tool Bar
    • Trade Report
    • Watch List
    • Workspaces
  • Release Notes
    • Release Notes
    • What's New In Version 6.5
    • What's New in Version 6.4
    • What's New in Version 6.3
    • What's New in Version 6.1
    • What's New in Version 6.0
  • Knowledge Base
    • Getting Started
      • Add a Symbol to a Watch List
      • Create a New Page
      • Create a New Workspace
      • Free Data Sources
      • Linux Installation
      • Resize Console Panels
      • Set Up a Simulated Account
      • Does MotiveWave Come With Data?
      • Can MotiveWave Be Used on Multiple Computers?
      • Futures Symbol Table
    • Connection
      • Connection Details
      • Add a Connection to a Workspace
      • Rithmic - Connection Issues and Troubleshooting
      • Connect MotiveWave to R|Trader Pro Gateway
      • GAIN Connection
      • Indian Market Connections
      • Interactive Brokers Connection
        • Troubleshooting Interactive Brokers Connection
        • Historical Data is Slow with Interactive Brokers
      • CQG Symbology
      • TD Ameritrade Search
      • Rithmic Eurex Symbology
      • Computer Sleep Mode
      • IQFeed Data
      • Another Instance of MotiveWave Is Using License Key
    • Workspace
      • Add a Connection to a Workspace
      • Create a New Workspace
      • Create a Workspace Backup
      • Restore a Workspace Backup
      • Switch Connections in a Workspace
      • Workspaces Not Showing Up
    • Charts
      • Adjust for a Stock Split
      • Assign Trading Hours to an Instrument
      • Component and Study Visibility
      • Different Charts for the Same Instrument
      • Make Studies Stick to a Chart
      • Trend Lines Don't Line up on Different Bar Sizes
      • Use a Display Mask
      • Create Tick, Range, PnF, or Renko Chart
      • Clicking on the Tab of One Chart Changes Tab of Other Charts
      • Charts Stopped Streaming Data
      • Charts Show Incorrect Historical Data
      • Time Range Measurements Are Incorrect
      • Limited Tick Data on Charts
      • Set Start Time for Chart Bars
      • View List of Studies and Components on Chart
      • Show ETH or Extended Data
    • Trading
      • Position Average Is Changing Overnight
      • Execute Trades on Another Account
    • General
      • Change Themes
      • Define Trading Hours
      • Futures Contract Backfill
      • Reset the Console Layout
      • Set a Default Account
      • Set Up a Repository
      • Set Up Gmail for Email Alerts
      • Set Up iCloud Mail for Email Alerts
      • MotiveWave Covers Windows Taskbar
      • Limit Instruments in Quick Search
      • Can’t See My Menu Anymore
      • Trade Report Is Incorrect
    • Study
      • Component and Study Visibility
      • Order Heatmap Study Not Showing
      • Forex With Volume Related Studies
      • Add a Custom Study
      • Volume Imprint or TPO Overlap
      • Use Real Values
    • Elliott Wave
      • Elliott Wave Data Window vs Start Date
      • Elliott Wave Functionality
      • Show Multiple Elliott Wave Ratios
      • Stacked Wave Labels
    • Scan
      • What Do the Scanner Results Fair, Good, Etc. Mean?
    • SDK
      • Create a Custom Study or Strategy
    • Optimize - Backtest
      • Backtesting Limitations
    • Support
      • Access Log Files
      • Active Session Exists
      • Create a Workspace Backup
      • Find My License Key and Edition
      • Minimum System Requirements
      • MotiveWave Extensions Directory
      • Uninstall MotiveWave
      • Data Loss
      • Trendlines Shift on Nonlinear Charts
      • Slow Application Performance
    • Error Messages
      • Forex.com - Error Placing Order: 75
      • Binance - Connection Failed: Invalid API Key
      • Binance Futures - Unable to load listen keys
      • IQFeed - Error: Index 1 out of bounds for length 1
      • IQFeed - Connection Failed
      • State Error
      • Error Placing Order(s)
    • Purchase
      • Upgrade from a Lease to a Purchased License
      • Upgrade from a Lower Edition Purchased License to a Higher Edition Purchased License
      • Recently Purchased Where Is My License Key?
      • PayPal Payments
      • How Do I Cancel My Lease?
      • Are Updates to the Software Free?
    • FAQ
      • Can I Add Commentary
      • Can I Have a Simulated and a Live Trading Account
      • Can I Have More Than One Broker Account
      • Can I Save My Analysis
      • Can I Trade from the Chart
      • Can I Use MotiveWave on Multiple Computers
      • Does MotiveWave Support macOS
      • Does MotiveWave Support Multiple Computer Screens
      • How Do I Log in to MotiveWave
      • How Do I Make Point & Figure and Hybrid Renko Charts
      • How Do I Position and Size the Chart Windows on a Specific Screen
      • How Do I Save My Charts
      • How Do I Sync MotiveWave Between Two Computers
      • What Instruments Does MotiveWave Support
      • What Is Compact Mode for Chart Windows
      • Where Are the Chart Tools
  • Video Tutorials
    • Product Demos
    • Startup and Installation
    • Workspaces
    • Broker and Data Feed Connections
    • Overviews
    • General Configuration
    • Configuring Preferences
    • Charts
    • Analyses vs Alternate Analyses
    • Studies and Strategies
    • Trading
    • Alerts
    • Replay Mode
    • Scanners
    • Fibonacci
    • Harmonics
    • Elliott Wave
    • Webinars
    • Third Party Webinars
  • Studies
    • A - B
    • C - D
    • E - F
    • G - H
    • I - J
    • K - L
    • M - N
    • O - P
    • Q - R
    • S - T
    • U - V
    • W - X
    • Y - Z
Powered by GitBook
On this page
  • Creating a New Analysis
  • Open Existing Analysis
  • Manage Analyses
  • Import/Export Analyses
  1. User Guide
  2. Charts

Analyses

PreviousScalingNextRatios

Last updated 12 months ago

MotiveWaveâ„¢ employs the concept of an Analysis to encapsulate the work that you have done in a chart to analyze price movement. An analysis will contain the following types of information:

  • Components – any components that you have added to the chart including: trend lines, Elliott Waves, Gann components, Gartley patterns, commentary etc

  • Studies – Any studies that you have added to the chart

  • Time/Price Guides – These are guides that you have added to the horizontal or vertical axes.

It is important to understand that an analysis is a separate entity from a chart. A chart is a view or an analysis file. This is an important distinction and is fundamental to the underlying design of MotiveWaveâ„¢. While this concept may seem a little confusing at first, it has numerous advantages:

  • View in Multiple Time Frames – A single analysis can be viewed at multiple time frames simultaneously. You can have several open charts that reference the same analysis and edit them from each chart.

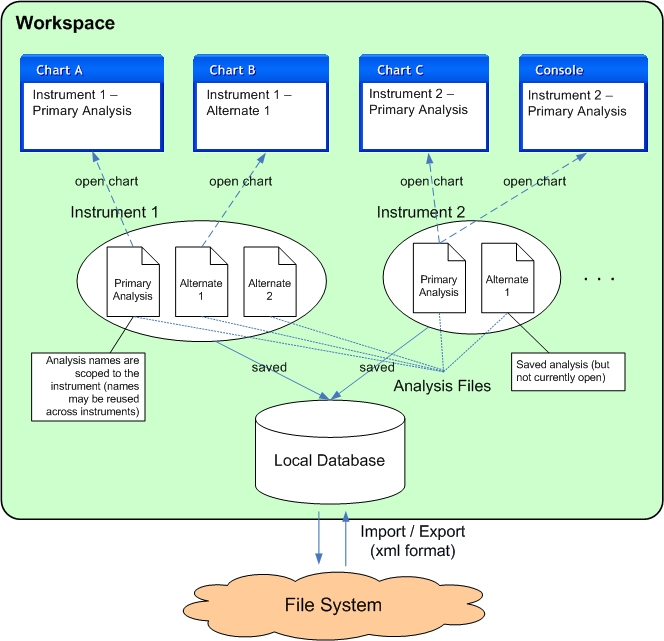
  • Alternate Analyses – Each instrument can have any number of analyses. The name of an analysis is scoped to the instrument so it does not have to be unique across symbols.

  • Saved in Repository – You can save an analysis and load it later after the chart has been closed

  • Share with other People – Analyses can be exported in XML format and shared with your friends. You can also share analyses using the Analysis Sources feature.

The following diagram illustrates the relationship between charts and analyses. Each instrument may have multiple analyses which are saved in the local database (repository). When you open a chart, you are opening an analysis. MotiveWaveâ„¢ allows you to open an analysis from more than one chart at the same time. Changes made in either chart are synchronized between the two so you do not have to worry about overwriting you modifications.

Creating a New Analysis

The default analysis for any instrument is called the Primary Analysis. Whenever you open a chart for the first time, it will open the Primary Analysis. The net effect of this behavior is that all changes between the open charts for that instrument will be synchronized between them.

If you do not want these changes to be synchronized, you can create one or more Alternate Analyses. There are several ways to do this; perhaps the most convenient is to use the New Analysis button on the tool bar.

The following dialog will appear when you create a new analysis. Enter a name for the analysis. By default, analyses are named Alternate 1, Alternate 2 etc. You can however choose any name you like for the analysis. A new analysis may be empty (just price bars) or you can base an analysis on an existing analysis by choosing one from the Based On drop down.

Once you have created the new analysis, the chart will display a set of tabs at the top where the active tab is named with the new analysis.

Open Existing Analysis

If you want to quickly open an analysis, just click on the small black triangle next to the open button on the tool bar. Alternatively, choose File -> Open/Manage Analyses from the top menu bar (File -> Chart -> Open/Manage Analyses from the Console menu bar).

Manage Analyses

The Manage Analyses dialog allows you to open, export, rename, delete or create new analyses for the given instrument. This dialog can be access from the menu bar: File -> Open/Manage Analyses from the top menu bar (File -> Chart -> Open/Manage Analyses from the Console menu bar).

Import/Export Analyses

Import and export are very valuable tools for sharing your analysis with another MotiveWaveâ„¢ user.

When you export an analysis file, the file will contain all of the information related to your analysis as well as information about the instrument. The exported file will be in JSON format and will have an extension of .mwml (MotiveWave Markup Language).

Choose File -> Export Analysis from the top menu bar (File -> Chart -> Export Analysis from the Console) to open the Export Analysis dialog. By default the analysis file will be saved on your computer desktop in the form <Symbol> – <Analysis Name>.mwml. You may change this name and location if you like. Click on the Save button to export the analysis to the selected file.

Similarly, to import an analysis file, choose File -> Import Analysis from the top menu bar (File -> Chart -> Import Analysis from the Console) to display the Import Analysis dialog. Locate the analysis file, select it and press the Open button. If the chart you are currently using has the same instrument as the imported analysis file, it will be opened in another analysis tab. If the instrument does not match the chart, a message dialog will be displayed indicating that the import was successful and how to open the imported file.

Charts and Analyses
New Analysis
New Analysis Dialog
Chart with New Analysis
Open Analysis
Manage Analyses Dialog
Export Analysis Dialog
Import Analysis Dialog