MotiveWave Docs
MotiveWave.com
  • User Guide
    • Welcome
    • Quick Start Guide
      • Getting Started
      • Installation
      • Customization Options
      • Advanced Features
      • Troubleshooting and Support
      • Next Steps
    • Console Overview
      • Preferences
      • Changing the Look and Feel
      • Desktops
      • Quote Sheets
      • Backup and Restore
      • Repository
      • Email Configuration
      • Docking Framework Guide
        • Introduction
        • Stations
        • Pages
        • Layouts
        • Customization
    • Accounts Panel
      • Simulated Account
      • Commissions
    • Alerts
    • Charts
      • Settings
      • Chart Spacing
      • Bar Sizes
      • Importing Data
      • Exporting Data
      • Birds Eye View
      • Cursor Data
      • Depth Of Market
      • Chart Labels
      • News
      • Watermark
      • Scaling
      • Analyses
      • Ratios
      • Time and Price Guides
      • Percent Change Charts
      • Software Development Kit
      • Lock Studies
      • Lock Scroll
      • Study Templates
      • Linking Charts
      • Working With Chart Windows
      • Ticker Tape
      • Chart Trading
      • Data Export Groups
      • Analyses Guide
        • Introduction
        • Managing Analyses
        • Sharing Analyses
    • Components
    • Depth Of Market
    • Elliott Wave
    • Hurst Cycles
      • Introduction
      • Study Overview
      • Using the Hurst Cycle Study
    • Instruments
      • Custom Instruments
    • Option Chain
    • Order Flow
      • Introduction
      • Time Price Opportunity (TPO) Study
      • Volume Imprint
      • Depth of Market
      • Time and Sales
      • Delta Volume
      • Cumulative Delta
      • Bid/Ask Volume
      • Speed of Tape
      • DOM Power
      • Order Heatmap
      • Big Trades
      • Speed Gauges
      • Components
    • Pages
    • Preferences
      • General
      • Theme
      • Chart
      • Toolbar
      • Sounds
      • Ratios
      • Elliott Wave
      • Harmonics
      • Historical Data
      • Orders
      • Alerts
      • Email
      • Trade History
      • Buy/Sell
    • Replay Mode
    • Scanner
      • Scanner
      • Creating a Scan
      • Executing a Scan
      • Editing a Scan
      • Elliott Wave Scanner
      • Harmonic Scanner
      • Study Scanner
    • SDK Programming Guide
      • Preface
      • Change History
      • Introduction
      • Fundamental Classes
      • Overlay Example
      • Study Plot Example
      • Drawing Figures
      • Signals
      • Tick Data
      • Strategies
      • Logging
      • Internationalization
      • Deployment
      • Environment Setup
    • Shortcuts
    • Strategies & Backtest
      • Strategy Back Testing
      • Creating a Strategy Analysis
      • Strategy Analysis
      • Strategies
    • Studies
    • Time and Sales
    • Tool Bar
    • Trade Report
    • Watch List
    • Workspaces
  • Release Notes
    • Release Notes
    • What's New In Version 6.5
    • What's New in Version 6.4
    • What's New in Version 6.3
    • What's New in Version 6.1
    • What's New in Version 6.0
  • Knowledge Base
    • Getting Started
      • Add a Symbol to a Watch List
      • Create a New Page
      • Create a New Workspace
      • Free Data Sources
      • Linux Installation
      • Resize Console Panels
      • Set Up a Simulated Account
      • Does MotiveWave Come With Data?
      • Can MotiveWave Be Used on Multiple Computers?
      • Futures Symbol Table
    • Connection
      • Connection Details
      • Add a Connection to a Workspace
      • Rithmic - Connection Issues and Troubleshooting
      • Connect MotiveWave to R|Trader Pro Gateway
      • GAIN Connection
      • Indian Market Connections
      • Interactive Brokers Connection
        • Troubleshooting Interactive Brokers Connection
        • Historical Data is Slow with Interactive Brokers
      • CQG Symbology
      • TD Ameritrade Search
      • Rithmic Eurex Symbology
      • Computer Sleep Mode
      • IQFeed Data
      • Another Instance of MotiveWave Is Using License Key
    • Workspace
      • Add a Connection to a Workspace
      • Create a New Workspace
      • Create a Workspace Backup
      • Restore a Workspace Backup
      • Switch Connections in a Workspace
      • Workspaces Not Showing Up
    • Charts
      • Adjust for a Stock Split
      • Assign Trading Hours to an Instrument
      • Component and Study Visibility
      • Different Charts for the Same Instrument
      • Make Studies Stick to a Chart
      • Trend Lines Don't Line up on Different Bar Sizes
      • Use a Display Mask
      • Create Tick, Range, PnF, or Renko Chart
      • Clicking on the Tab of One Chart Changes Tab of Other Charts
      • Charts Stopped Streaming Data
      • Charts Show Incorrect Historical Data
      • Time Range Measurements Are Incorrect
      • Limited Tick Data on Charts
      • Set Start Time for Chart Bars
      • View List of Studies and Components on Chart
      • Show ETH or Extended Data
    • Trading
      • Position Average Is Changing Overnight
      • Execute Trades on Another Account
    • General
      • Change Themes
      • Define Trading Hours
      • Futures Contract Backfill
      • Reset the Console Layout
      • Set a Default Account
      • Set Up a Repository
      • Set Up Gmail for Email Alerts
      • Set Up iCloud Mail for Email Alerts
      • MotiveWave Covers Windows Taskbar
      • Limit Instruments in Quick Search
      • Can’t See My Menu Anymore
      • Trade Report Is Incorrect
    • Study
      • Component and Study Visibility
      • Order Heatmap Study Not Showing
      • Forex With Volume Related Studies
      • Add a Custom Study
      • Volume Imprint or TPO Overlap
      • Use Real Values
    • Elliott Wave
      • Elliott Wave Data Window vs Start Date
      • Elliott Wave Functionality
      • Show Multiple Elliott Wave Ratios
      • Stacked Wave Labels
    • Scan
      • What Do the Scanner Results Fair, Good, Etc. Mean?
    • SDK
      • Create a Custom Study or Strategy
    • Optimize - Backtest
      • Backtesting Limitations
    • Support
      • Access Log Files
      • Active Session Exists
      • Create a Workspace Backup
      • Find My License Key and Edition
      • Minimum System Requirements
      • MotiveWave Extensions Directory
      • Uninstall MotiveWave
      • Data Loss
      • Trendlines Shift on Nonlinear Charts
      • Slow Application Performance
    • Error Messages
      • Forex.com - Error Placing Order: 75
      • Binance - Connection Failed: Invalid API Key
      • Binance Futures - Unable to load listen keys
      • IQFeed - Error: Index 1 out of bounds for length 1
      • IQFeed - Connection Failed
      • State Error
      • Error Placing Order(s)
    • Purchase
      • Upgrade from a Lease to a Purchased License
      • Upgrade from a Lower Edition Purchased License to a Higher Edition Purchased License
      • Recently Purchased Where Is My License Key?
      • PayPal Payments
      • How Do I Cancel My Lease?
      • Are Updates to the Software Free?
    • FAQ
      • Can I Add Commentary
      • Can I Have a Simulated and a Live Trading Account
      • Can I Have More Than One Broker Account
      • Can I Save My Analysis
      • Can I Trade from the Chart
      • Can I Use MotiveWave on Multiple Computers
      • Does MotiveWave Support macOS
      • Does MotiveWave Support Multiple Computer Screens
      • How Do I Log in to MotiveWave
      • How Do I Make Point & Figure and Hybrid Renko Charts
      • How Do I Position and Size the Chart Windows on a Specific Screen
      • How Do I Save My Charts
      • How Do I Sync MotiveWave Between Two Computers
      • What Instruments Does MotiveWave Support
      • What Is Compact Mode for Chart Windows
      • Where Are the Chart Tools
  • Video Tutorials
    • Product Demos
    • Startup and Installation
    • Workspaces
    • Broker and Data Feed Connections
    • Overviews
    • General Configuration
    • Configuring Preferences
    • Charts
    • Analyses vs Alternate Analyses
    • Studies and Strategies
    • Trading
    • Alerts
    • Replay Mode
    • Scanners
    • Fibonacci
    • Harmonics
    • Elliott Wave
    • Webinars
    • Third Party Webinars
  • Studies
    • A - B
    • C - D
    • E - F
    • G - H
    • I - J
    • K - L
    • M - N
    • O - P
    • Q - R
    • S - T
    • U - V
    • W - X
    • Y - Z
Powered by GitBook
On this page
  • StudyHeader Annotation (@StudyHeader)
  • initialize method
  • calculate Method
  1. User Guide
  2. SDK Programming Guide

Study Plot Example

PreviousOverlay ExampleNextDrawing Figures

Last updated 12 months ago

In this example we are going to create a Study Plot based on a simple MACD. Note: if you would like a more comprehensive MACD example, you can look at the source code for the MACD indicator that exists within MotiveWave™.

MACD stands for ‘Moving Average Convergence/Divergence’ and was written by Gerald Appel in the 1970s. If you would like more information on this study go to: .

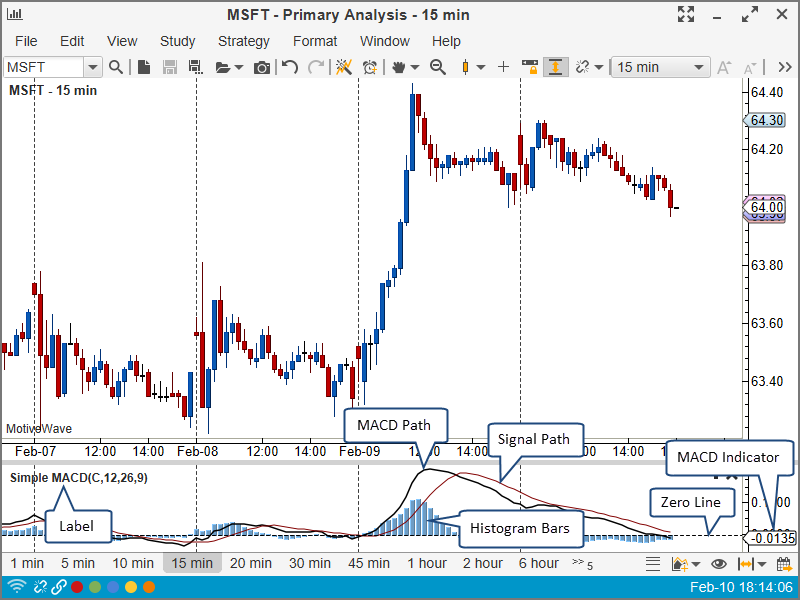
Here is a screen shot of what this study looks like:
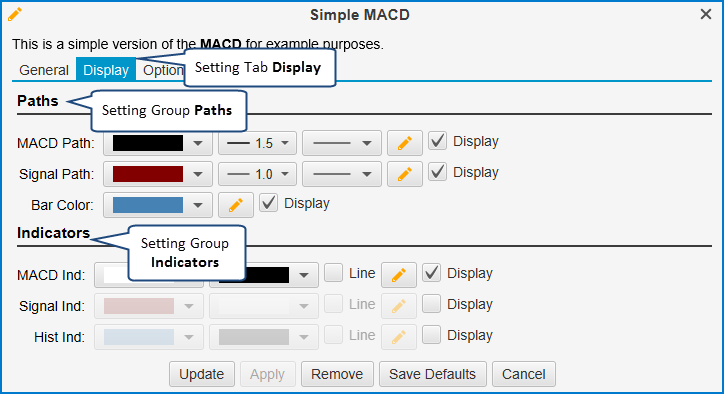
Here is a screen shot of the Study Dialog that the user will use to configure the Simple MACD:
Let us start by looking at the source code for this study:

package study_examples;

import com.motivewave.platform.sdk.common.*;
import com.motivewave.platform.sdk.common.desc.*;
import com.motivewave.platform.sdk.study.*;

/** Simple MACD example.  This example shows how to create a Study Plot
    that is based on the MACD study.  For simplicity code from the 
    MotiveWave MACD study has been removed or altered. */
@StudyHeader(
    namespace="com.mycompany", 
    id="SimpleMACD", 
    name="Simple MACD",
    desc="This is a simple version of the <b>MACD</b> for example purposes.",
    menu="My Studies",
    overlay=false)
public class SimpleMACD extends Study 
{
  // This enumeration defines the variables that we are going to store in the 
  // Data Series
	enum Values { MACD, SIGNAL, HIST };
  final static String HIST_IND = "histInd"; // Histogram Parameter 
	
  /** This method initializes the settings and defines the runtime settings. */
  @Override
  public void initialize(Defaults defaults)
  {
    // Define the settings for this study
    // We are creating 2 tabs: 'General' and 'Display'
    SettingsDescriptor settings = new SettingsDescriptor();
    setSettingsDescriptor(settings);
    SettingTab tab = new SettingTab("General");
    settings.addTab(tab);

    // Define the 'Inputs'
    SettingGroup inputs = new SettingGroup("Inputs");
    inputs.addRow(new InputDescriptor(Inputs.INPUT, "Input", Enums.BarInput.CLOSE));
    inputs.addRow(new IntegerDescriptor(Inputs.PERIOD, "Period 1", 12, 1, 9999, 1));
    inputs.addRow(new IntegerDescriptor(Inputs.PERIOD2, "Period 2", 26, 1, 9999, 1));
    inputs.addRow(new IntegerDescriptor(Inputs.SIGNAL_PERIOD, "Signal Period", 9, 1, 9999, 1));
    tab.addGroup(inputs);
    
    tab = new SettingTab("Display");
    settings.addTab(tab);
    // Allow the user to configure the settings for the paths and the histogram
    SettingGroup paths = new SettingGroup("Paths");
    tab.addGroup(paths);
    paths.addRow(new PathDescriptor(Inputs.PATH, "MACD Path", 
                 defaults.getLineColor(), 1.5f, null, true, false, true));
    paths.addRow(new PathDescriptor(Inputs.SIGNAL_PATH, "Signal Path", 
                 defaults.getRed(), 1.0f, null, true, false, true));
    paths.addRow(new BarDescriptor(Inputs.BAR, "Bar Color", defaults.getBarColor(), true, true));
    // Allow the user to display and configure indicators on the vertical axis
    SettingGroup indicators = new SettingGroup("Indicators");
    tab.addGroup(indicators);
    indicators.addRow(new IndicatorDescriptor(Inputs.IND, "MACD Ind", 
                      null, null, false, true, true));
    indicators.addRow(new IndicatorDescriptor(Inputs.SIGNAL_IND, "Signal Ind", 
                      defaults.getRed(), null, false, false, true));
    indicators.addRow(new IndicatorDescriptor(HIST_IND, "Hist Ind",
                      defaults.getBarColor(), null, false, false, true));

    RuntimeDescriptor desc = new RuntimeDescriptor();
    setRuntimeDescriptor(desc);
    desc.setLabelSettings(Inputs.INPUT, Inputs.PERIOD, Inputs.PERIOD2, Inputs.SIGNAL_PERIOD);
    // We are exporting 3 values: MACD, SIGNAL and HIST (histogram)
    desc.exportValue(new ValueDescriptor(Values.MACD, "MACD", new String[] 
                     {Inputs.INPUT, Inputs.PERIOD, Inputs.PERIOD2}));
    desc.exportValue(new ValueDescriptor(Values.SIGNAL, "MACD Signal",
                     new String[] {Inputs.SIGNAL_PERIOD}));
    desc.exportValue(new ValueDescriptor(Values.HIST, "MACD Histogram", new String[] 
                     {Inputs.PERIOD, Inputs.PERIOD2, Inputs.SIGNAL_PERIOD}));
    // There are two paths, the MACD path and the Signal path
    desc.declarePath(Values.MACD, Inputs.PATH);
    desc.declarePath(Values.SIGNAL, Inputs.SIGNAL_PATH);
    // Bars displayed as the histogram
    desc.declareBars(Values.HIST, Inputs.BAR);
    // These are the indicators that are displayed in the vertical axis
    desc.declareIndicator(Values.MACD, Inputs.IND);
    desc.declareIndicator(Values.SIGNAL, Inputs.SIGNAL_IND);
    desc.declareIndicator(Values.HIST, HIST_IND);

    // These variables are used to define the range of the vertical axis
    desc.setRangeKeys(Values.MACD, Values.SIGNAL, Values.HIST);
    // Display a 'Zero' line that is dashed.
    desc.addHorizontalLine(new LineInfo(0, null, 1.0f, new float[] {3,3}));
  }

  /** This method calculates the MACD values for the data at the given index. */
  @Override  
  protected void calculate(int index, DataContext ctx)
  {
    int period1 = getSettings().getInteger(Inputs.PERIOD);
    int period2 = getSettings().getInteger(Inputs.PERIOD2);
    int period = Util.max(period1, period2);
    if (index < period) return; // not enough data to compute the MAs

    // MACD is the difference between two moving averages.
    // In our case we are going to use an exponential moving average (EMA)
    Object input = getSettings().getInput(Inputs.INPUT);
    DataSeries series = ctx.getDataSeries();
    Double MA1 = null, MA2 = null;
    
    MA1 = series.ema(index, period1, input);
    MA2 = series.ema(index, period2, input);
    if (MA1 == null || MA2 == null) return;

    // Define the MACD value for this index
    double MACD = MA1 - MA2; 
    series.setDouble(index, Values.MACD, MACD);

    int signalPeriod = getSettings().getInteger(Inputs.SIGNAL_PERIOD);
    if (index < period + signalPeriod) return; // Not enough data yet

    // Calculate moving average of MACD (signal path)
    Double signal = series.sma(index, signalPeriod, Values.MACD);
    series.setDouble(index, Values.SIGNAL, signal);
    if (signal == null) return;

    // Histogram is the difference between the MACD and the signal path
    series.setDouble(index, Values.HIST, MACD - signal);
    series.setComplete(index);
  }  
}

StudyHeader Annotation (@StudyHeader)

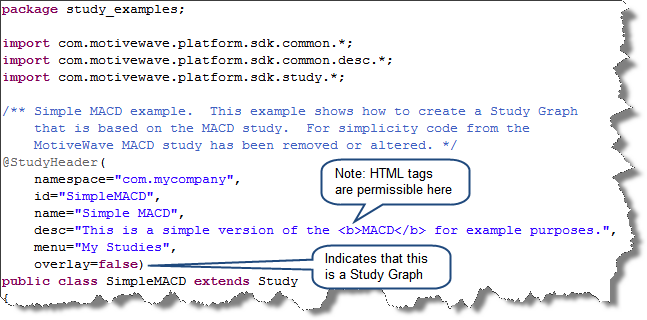
The main difference in the study header from the previous example is the ‘overlay’ tag is set to false. This indicates to MotiveWave™ that this study should be displayed in a separate study plot. You will notice here as well that we have included some HTML markup in the ‘desc’ tag. The description displayed in the Study Dialog supports HTML so you can put any valid HTML tags here (do not include JavaScript, this is not supported).
initialize method

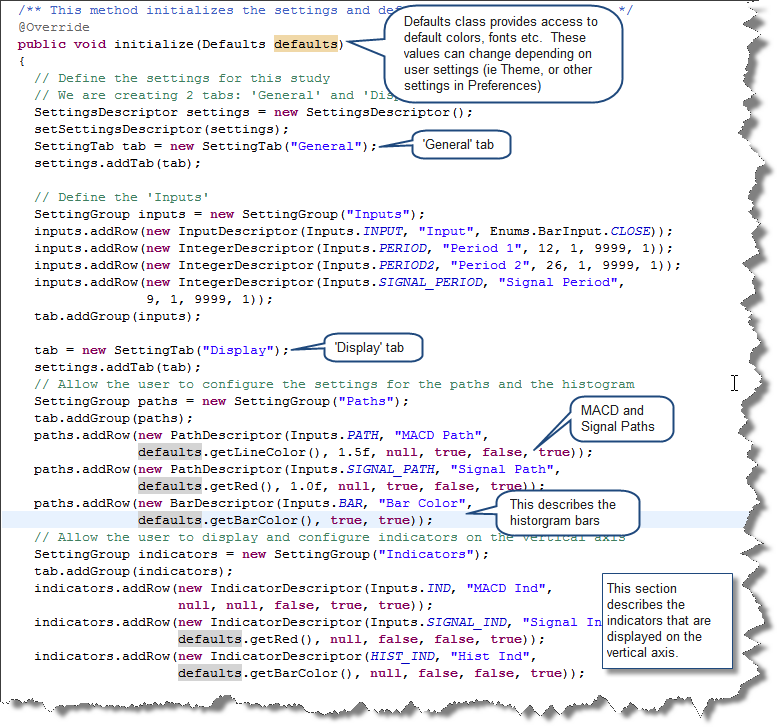
We have defined a bit more in the initialize section from the previous example. To illustrate the usage of tabs, we have created 2 tabs: ‘General’ and ‘Display’. We have also defined the bars for the histogram (see BarDescriptor).

Indicators are displayed on the vertical axis (right side of the screen). By default, we are only going to show the first indicator (MACD), but we will allow the user to show indicators for the current signal value as well as the histogram. For this we will use the IndicatorDescriptor and set the values accordingly. We have organized these into a Setting Group called ‘Indicators’

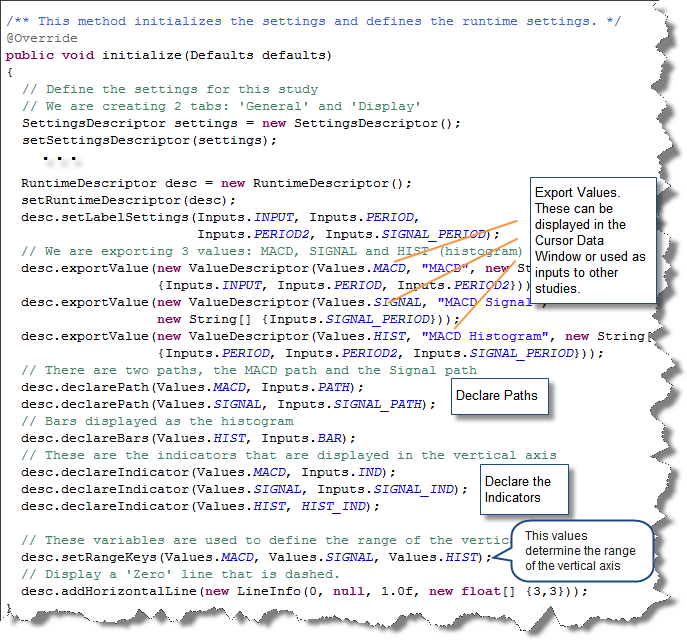
The following screen shot (with markup) shows the part of the initialize method where we are describing the settings for the study:
Next, we need to describe the runtime parameters using the RuntimeDescriptor. For the label, we want to append the input, period, period2 and the signal period.

In this case, we are going to export 3 values: MACD, SIGNAL and HIST.

In order to display the histogram as bars, we use the ‘declareBars’ method on the study descriptor. This will tell MotiveWave™ to show vertical bars using the BarDescriptor identified by Inputs.BAR.
calculate Method

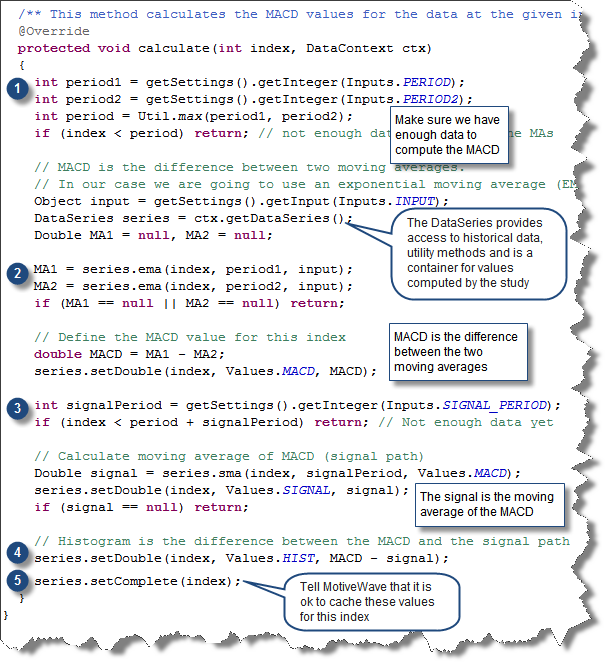
The calculate method is used to compute the values for each historical bar in the data series. In our case, we are going to do the following:

  • Retrieve User Settings – these are accessed from the getSettings() method.

  • Compute and Store the MACD – The DataSeries object contains the historical data as well as the utility methods for computing moving averages. The MACD value is stored in the data series at the given index using the key Values.MACD.

  • Compute and Store the signal – The signal is a moving average of the MACD. Use the data series to compute the moving average with Values.MACD as the key. The signal value is stored in the data series at the given index using the key: Values.SIGNAL.

  • Compute and store the histogram – The histogram is simply the difference between the MACD and the signal. This is stored in the data series at the given index using the key: Values.HIST.

  • Mark the index as ‘Complete’ - Finally, indicate that this index is ‘complete’. This allows MotiveWave™ to cache these values (to improve performance).
http://en.wikipedia.org/wiki/MACD
Figure 30 - Simple MACD
Figure 31 - Simple MACD Study Header
Figure 32 - Simple MACD initialize settings
Figure 33 - Simple MACD initialize runtime
Figure 34 - Simple MACD calculate method