
What's New in Version 6.4
Introduction
Welcome to MotiveWave™ version 6.4! This document will outline the features that have been added between version 6.3 and version 6.4.
Study Quick Editor & Tool Bar Study Editor
Study controls can now be added to the tool bar and are also accessible from a new study quick editor.
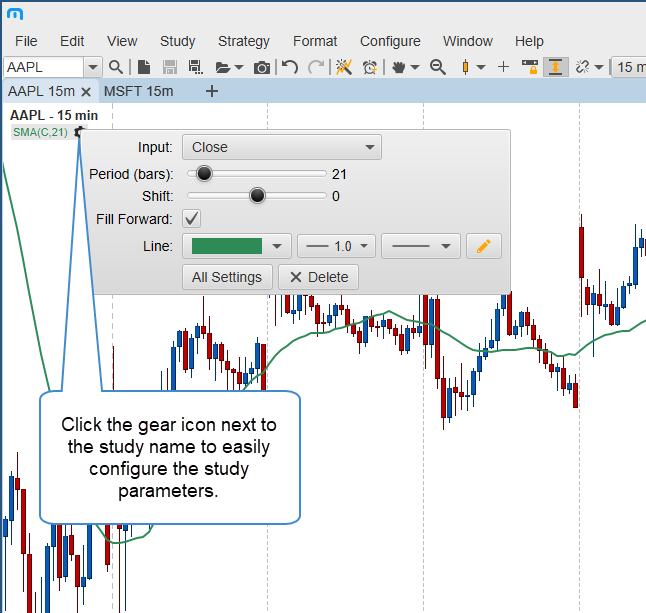
Study Quick Editor
Buttons have been added to the study titles to show a quick editor that contains some of the study controls.
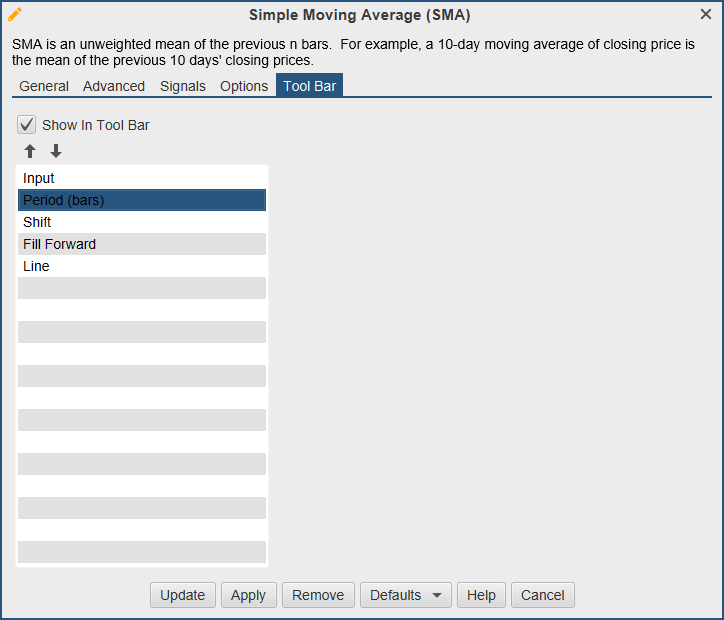
Tool Bar
A Tool Bar tab has been added to the study dialog to choose controls that are displayed in the tool bar. To enable this option, select Show In Tool Bar and then select the desired controls. Hold down CTRL or COMMAND on your keyboard to select multiple options.
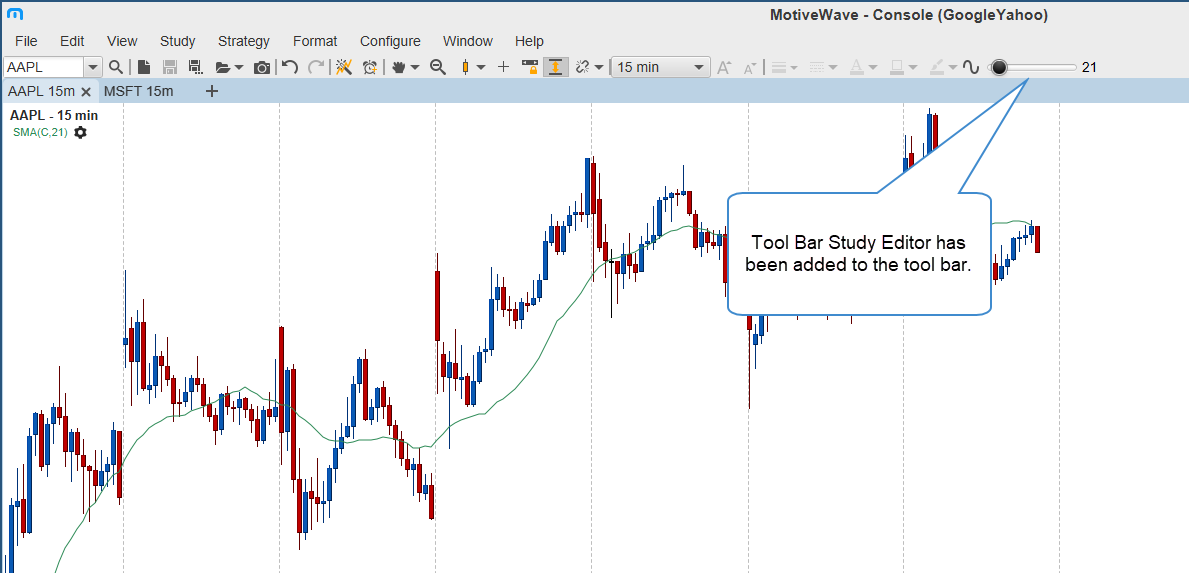
Tool Bar Study Editor
A study editor action is available to add to the tool bar. This is used in conjunction with the Tool Bar option above and will display the selected controls.
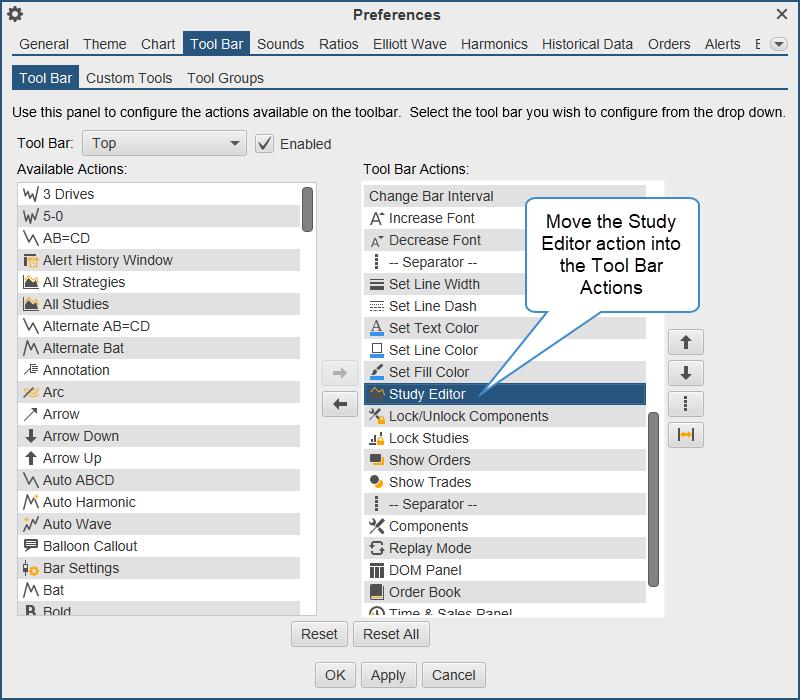
For existing workspaces, you may need to add the Study Editor action to your existing tool bar. This can be found in Configure > Preferences > Tool Bar, select your desired tool bar and then move the Study Editor action into the tool bar actions.
SDK
The SDK has been enhanced to identify specific settings that are available to the Quick Editor and Tool Bar. For details see the updated SDK Document:
https://www.motivewave.com/support/sdk.htm
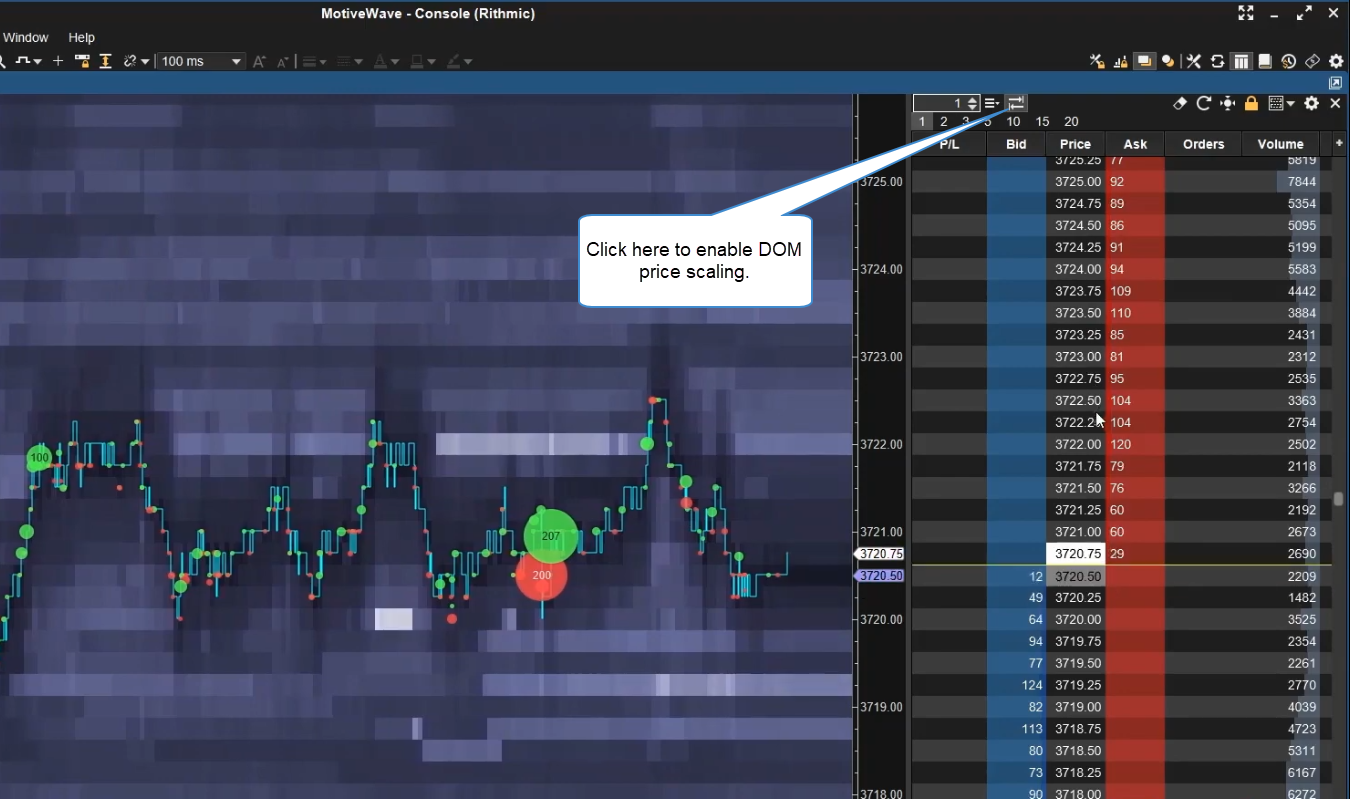
Depth of Market Price Scaling
The scaling of the chart can now be synced to the attached DOM (Depth of Market). A new button has been added to the tool bar in the DOM to toggle this chart scaling method on/off.
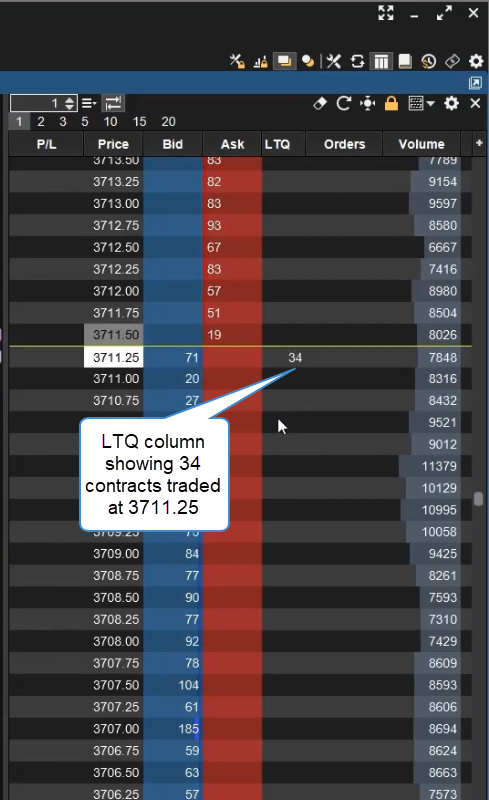
LTQ (Last Traded Quantity) DOM Column
A new DOM column was added which shows the cumulative total of contracts traded since a trade was completed at another price. This column resets each time a trade occurs at a different price.
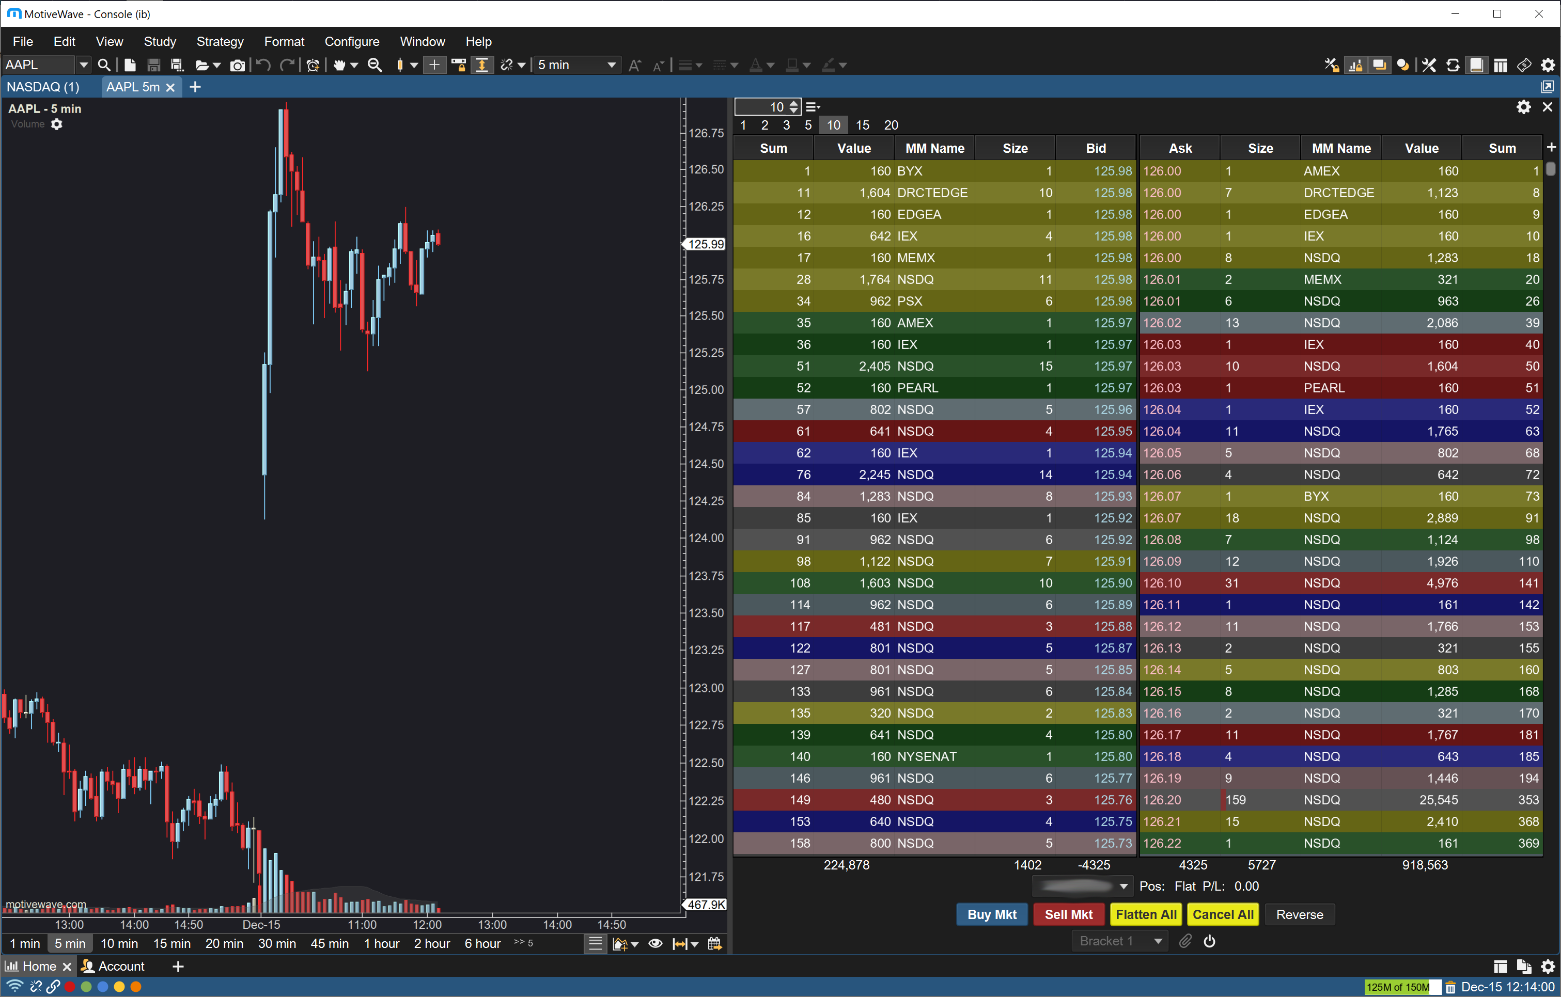
Level II (Market Depth)
Interactive Brokers
Interactive Brokers Smart Depth (Level II) was added. Open the order book to view.
TD Ameritrade
TD Ameritrade Order Book has an added option to expand the rows by Market Maker and optionally color rows at the same price.
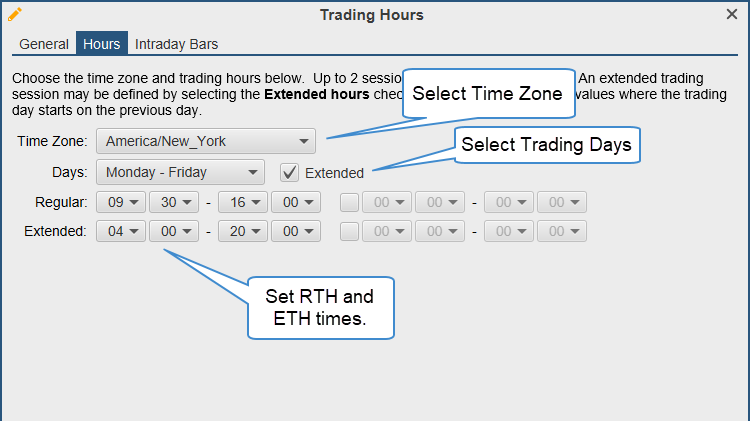
Trading Hours
The following enhancements have been added to the Trading Hours feature (See Configure > Preferences > General > Trading Hours).
Hours
The interface for specifying trading hours has been simplified to provide the same daily hours across multiple days (e.g. Monday – Friday, Sunday – Saturday etc.)
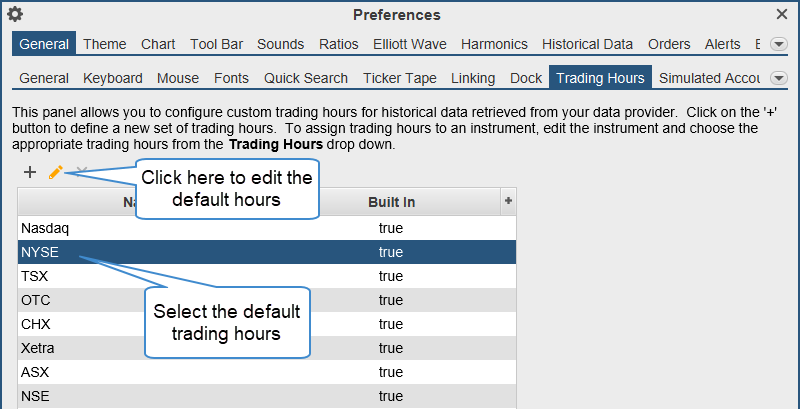
Edit Built-In Hours
The built-in hours can now be modified instead of creating a new set of trading hours. You can revert to the default hours by selecting the modified hours in the list and pressing the Delete key.
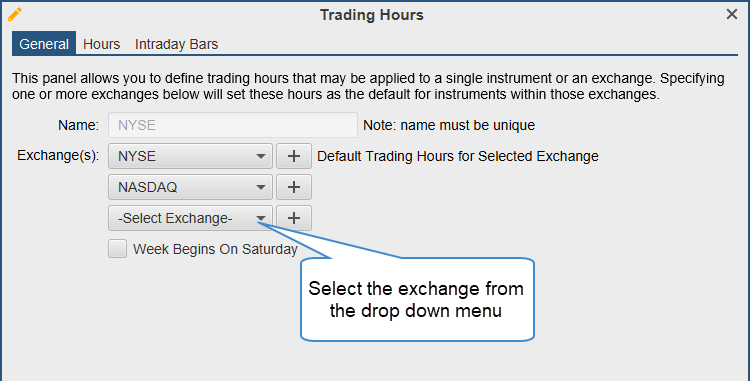
Multiple Exchanges
You can now assign trading hours to multiple exchanges.
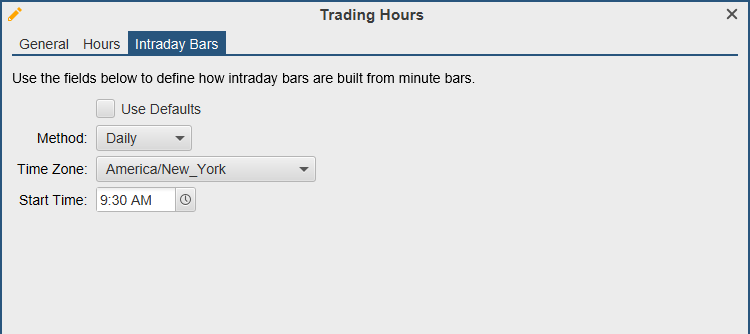
Intraday Bar
You can specify a bar build method for intraday bars (overriding the global default). This bar build method will be applied to all the instruments on that exchange.
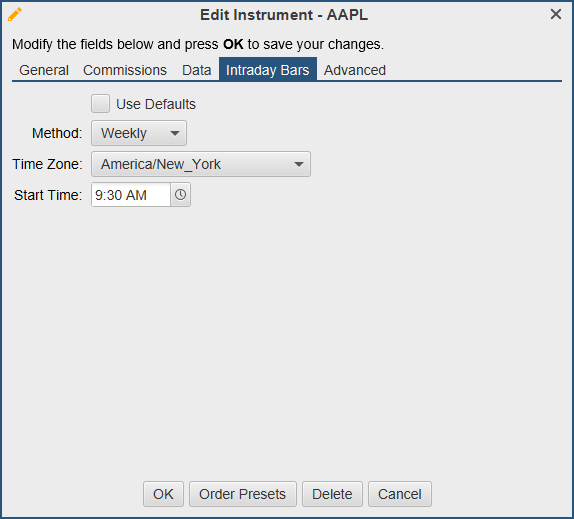
Intraday Bar Build
The method for configuring how intraday bars is built can now be configured per instrument via the Edit Instrument dialog. This allows for greater flexibility.
Simulated Trades Only
An option has been added to the built-in simulated account to only allow trading on the internal simulated account (Configure > Preferences > General > Simulated Account). This option is very useful if you’re using your brokerage account for data while you place simulated trades.
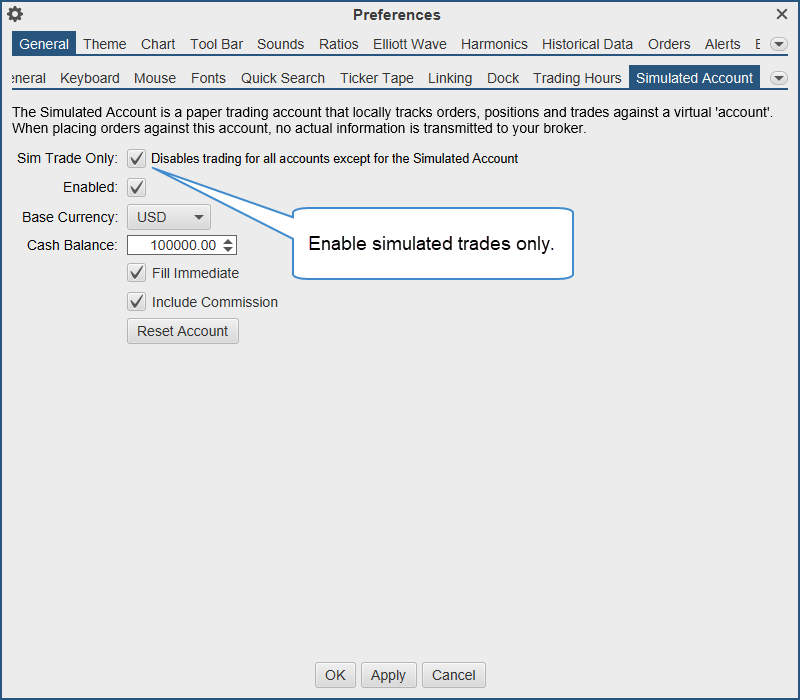
Chart Indicators
The following enhancements have been added to the Chart Indicators.
Chart Specific Settings
Charts can override the global setting from the Chart Settings dialog.
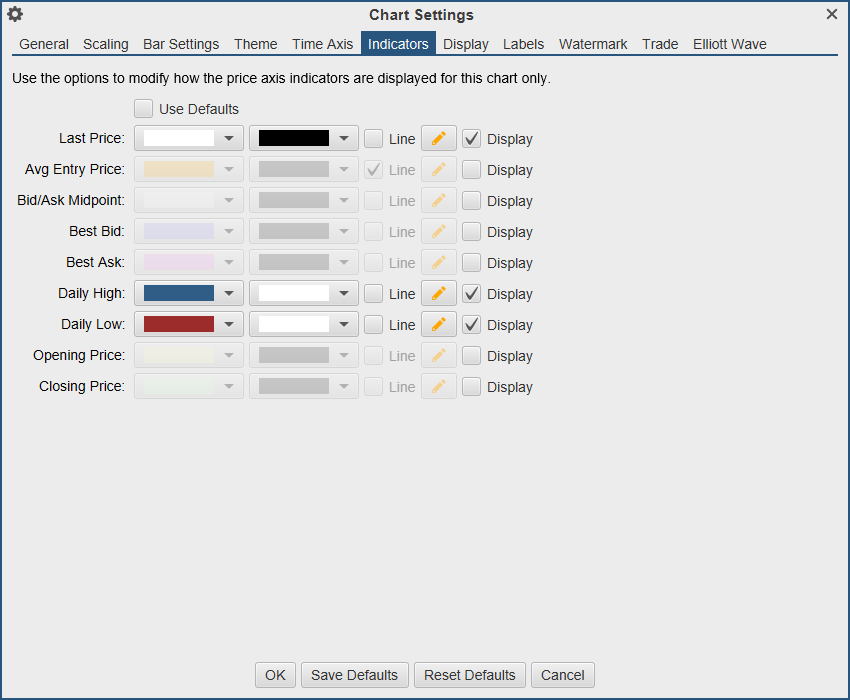
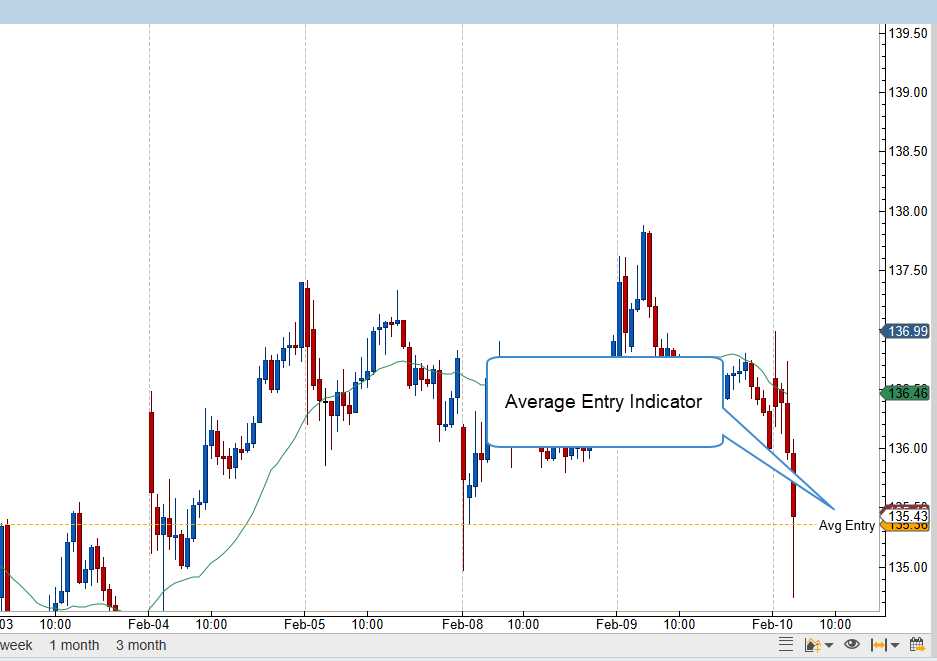
Average Entry Price
This new indicator displays the average entry price for the current position as an indicator.
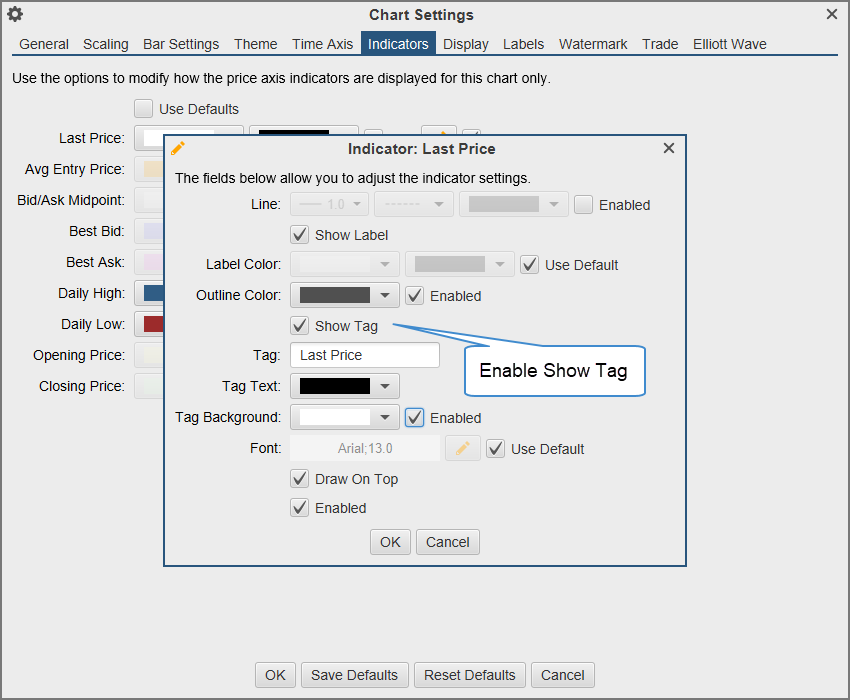
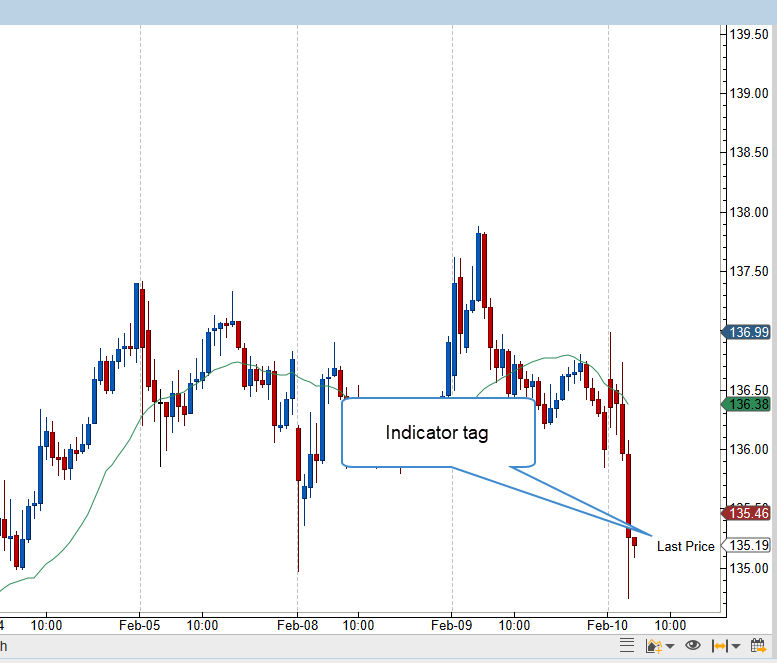
Tags
Optionally a tag may be assigned to an indicator. This tag displays the given text to the left of the indicator.
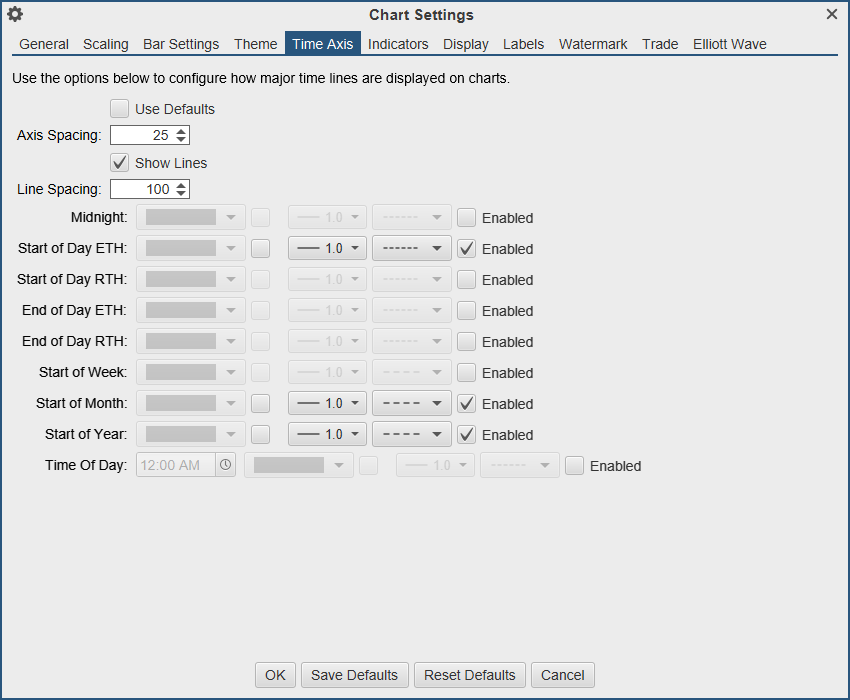
Time Axis
The following enhancements have been added to the Time Axis.
Chart Specific Settings
Charts can override the global settings from the Chart Settings dialog.
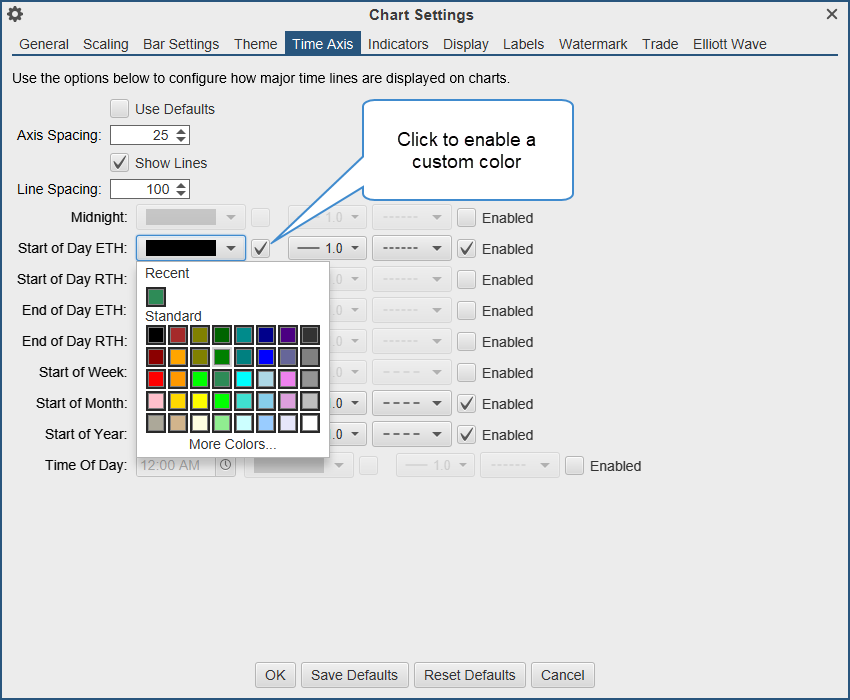
Line Color
A color can now be chosen for each time axis line that is enabled. Click the checkbox to the right of the color drop down to enable a specific color.
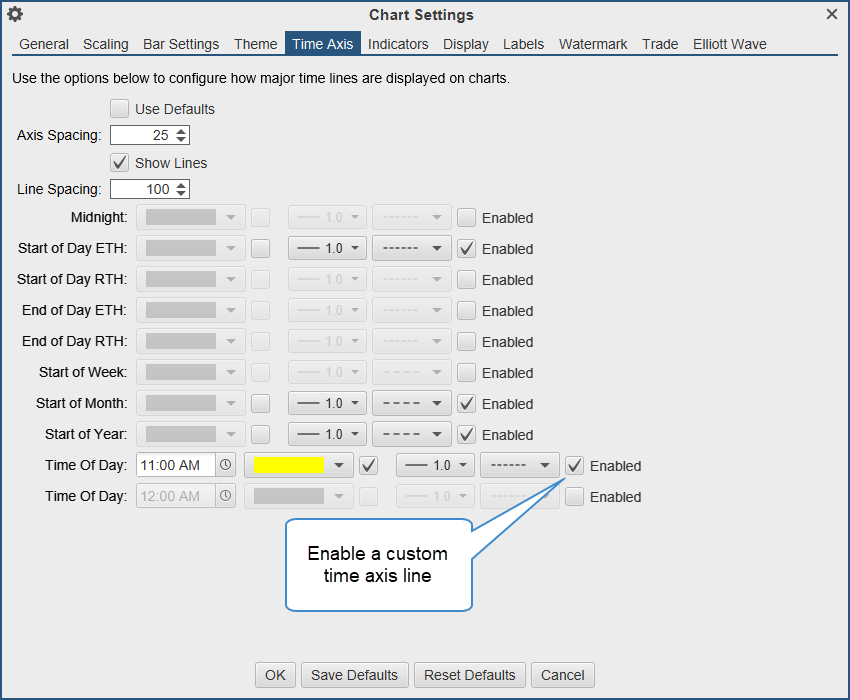
Time of Day
Custom lines can be displayed at specific times of day (E.g. 11:00am).
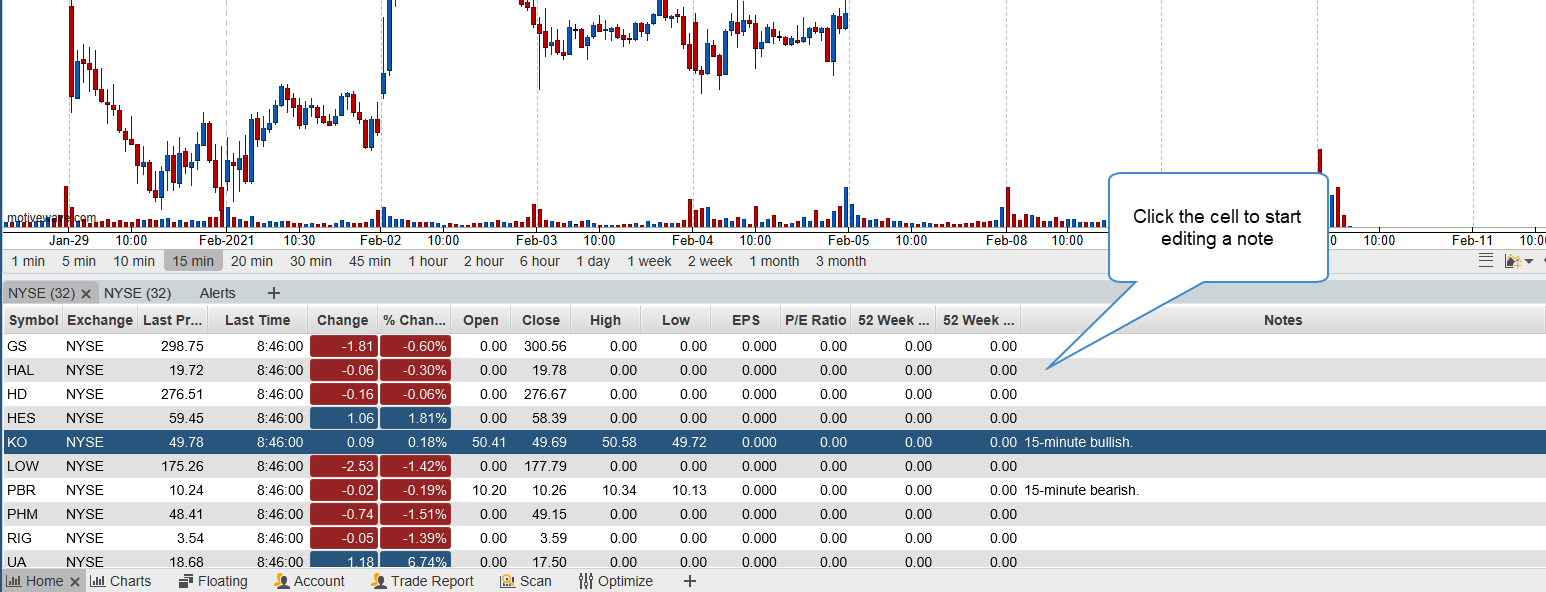
Watch List Notes
A “Notes” column has been added to Watch Lists where you can enter custom notes. Clicking on the cell in the Watch List will allow you to edit the value in line. The notes are tied to the instrument and can also be edited and viewed in the Edit Instrument dialog.
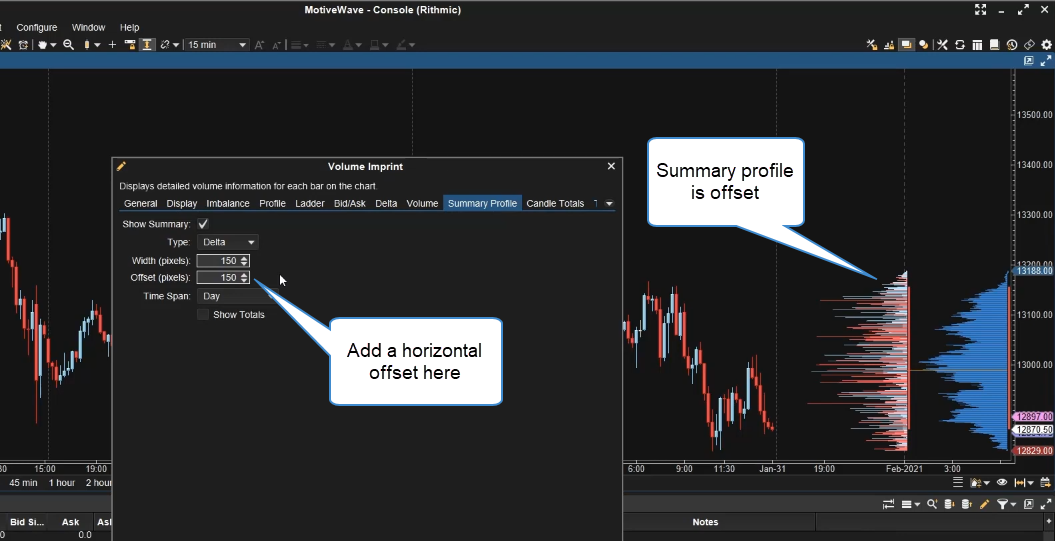
Volume Imprint Offset
A horizontal offset can be added to the Summary Profile, this will allow you to display two profiles without overlap.
Other Enhancements
Here are the other enhancements that have been added between version 6.3 and 6.4.
Export Trades – Exported trades now includes milliseconds.
Alerts – Comments are now displayed in the alerts and alert history panels.
OHLC study – Added Previous Open as an available option.
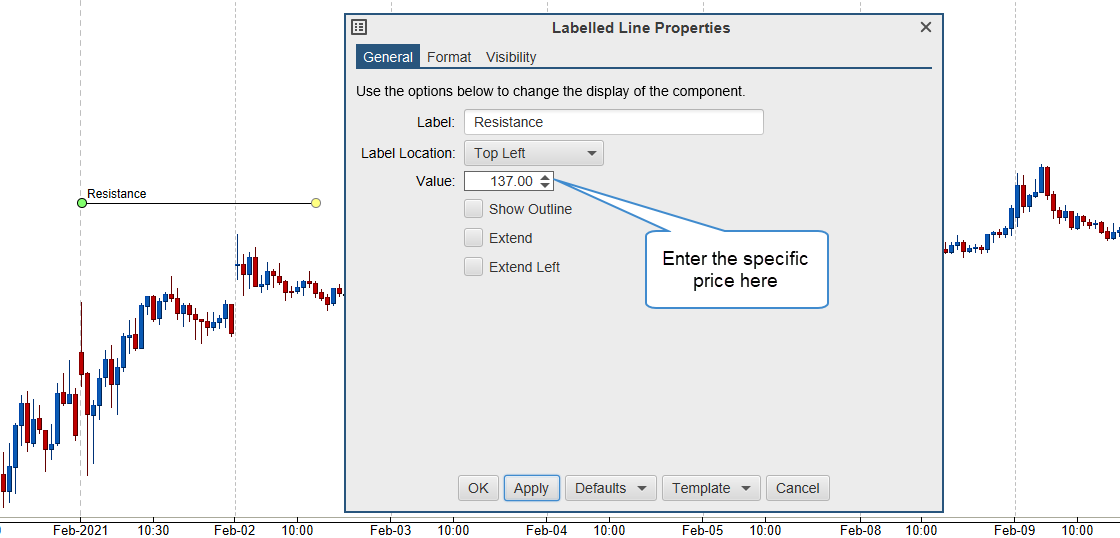
Labelled Line – Price can be chosen in the properties dialog.
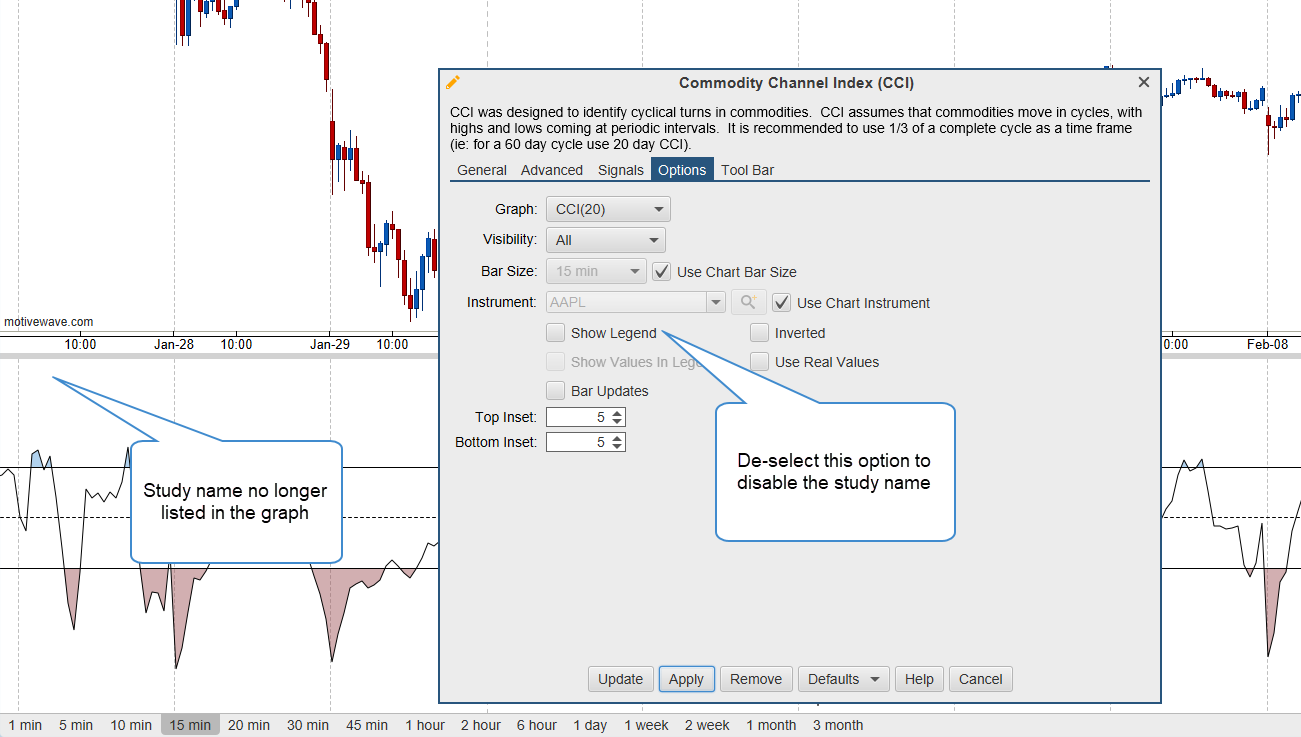
Study Graph – Ability to remove the display of the study title (See Options tab, “Show Legend”).
Exit Strategy – Added decimal places for stop/target where the offset type is set to “Percent”.
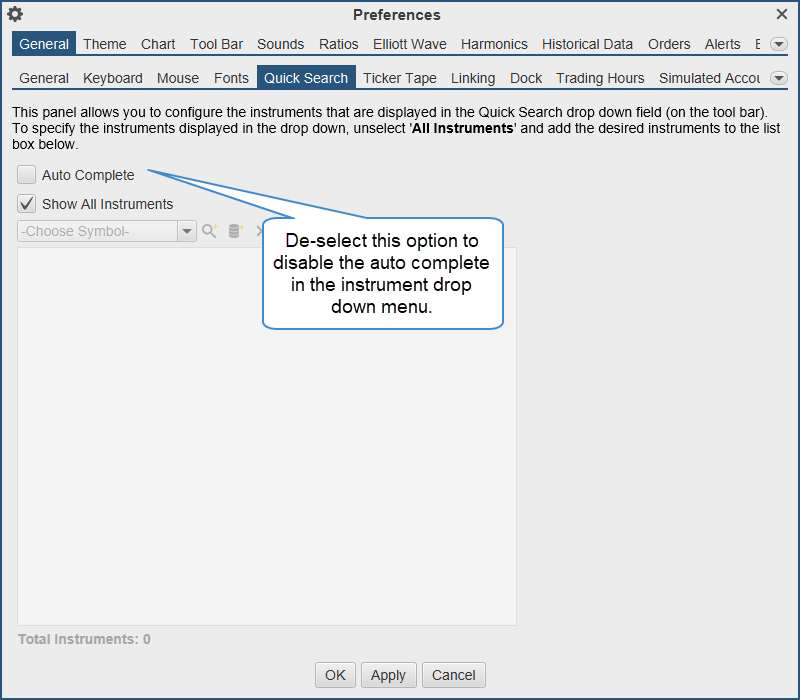
Quick Search – Auto Complete feature can now be turned off.
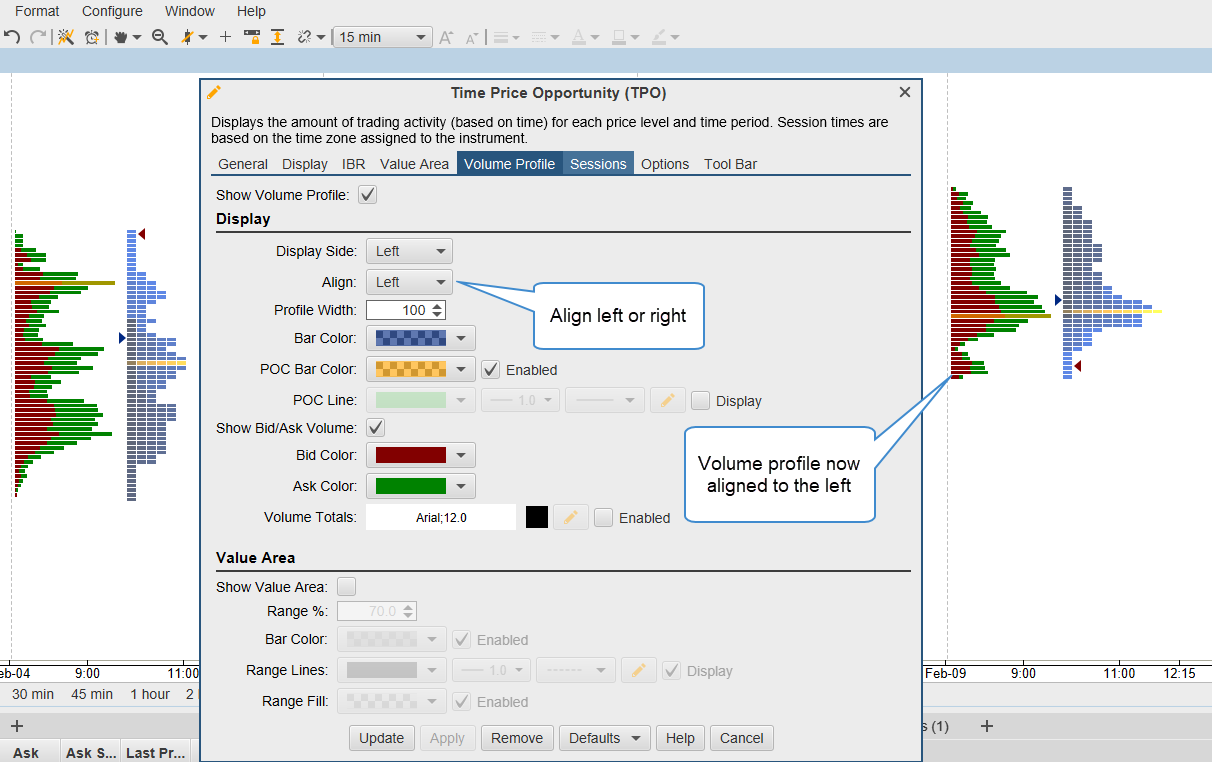
TPO Study – Volume profiles now have an align option (left or right).
Mid Point – Added midpoint column to Watch Lists. This is the midpoint between the bid and ask prices.
Default Layout – The default layout has changed when creating a new workspace.
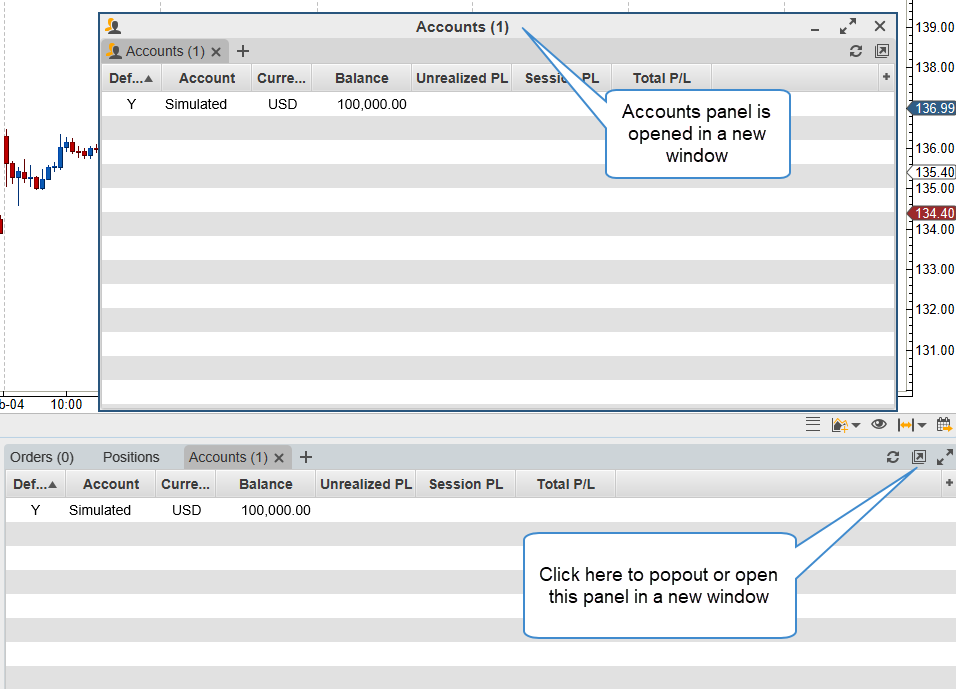
Popout Panels – A popout (open in new window) option has been added to more panels in the console: Accounts, Positions, Orders, Trades, Optimizer, Alerts, Trade Report, Options, and Journal.
Time Calculation Method – Added an option to calculate elapsed time in a component using elapsed time versus trading time. This option is available in Configure > Preferences > Chart > Chart Settings.
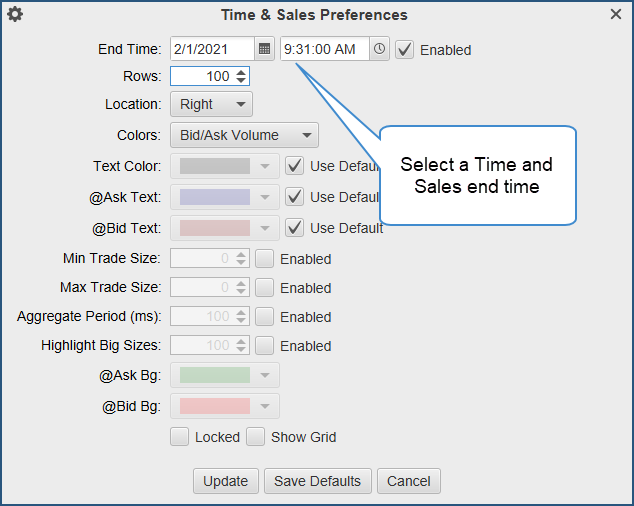
Time and Sales – Added an optional end time field. This allows you to scroll to a specific time in the Time and sales panel. This can be found in the Time and Sales preferences.
CQG – Updated to the latest API.
Cumulative Delta study – Added the ability to restart the delta calculation at the start of the week or month.
Trade History – Added the option to choose account on the Export to CSV feature.
DOM Shortcuts – Added the ability to assign keyboard shortcuts to the following: Reset @Bid/@Ask, Lock DOM, and Clear Notes.
Last updated