
Introduction
Welcome to the MotiveWave™ Analyses Guide! If you are reading this document then you have already installed MotiveWave™ on your computer and you are ready to start using the application.
If you have not yet installed MotiveWave™ or registered for a trial on our website, please read the Installation Guide before continuing on with this document.
The Analyses feature is one of the most distinguishing and powerful features of MotiveWave™. An analysis is essentially a document that contains all of the studies and drawings (components) that have been added to a chart. There are two types of analyses:
Untitled – Untitled analyses are scoped to a chart and are discarded when the chart is explicitly closed (introduced in version 6.1).
Titled – Titled analyses have a name and are saved in the workspace. A titled analysis can be recalled later, even if the chart has been closed. It is also possible to open a titled analysis in multiple charts at the same time.
An analysis may contain the following types of information:
Components (Drawings) – this includes any component from the Components panel or a component drawn using a mouse tool. Examples include: Trend Lines, Elliott Waves, Commentary etc
Studies – Any studies that you have added to the chart (including price overlays and study graphs).
Time/Price Guides – Horizontal and vertical guides that have been added from the price or time axes.
It is important to understand that an analysis is a separate entity from a chart. A chart is a view or an analysis file. This is an important distinction and is fundamental to the underlying design of MotiveWave™. While this concept may seem a little confusing at first, it has numerous advantages:
View in Multiple Time Frames – A single analysis can be viewed at multiple time frames simultaneously. You can have several open charts that reference the same analysis and edit them from each chart.
Alternate Analyses – Each instrument can have any number of analyses. The name of an analysis is scoped to the instrument so it does not have to be unique across symbols.
Saved in Repository – You can save an analysis and load it later after the chart has been closed
Share with other People – Analyses can be exported in XML format and shared with your friends. You can also share analyses using the Analysis Sources feature.
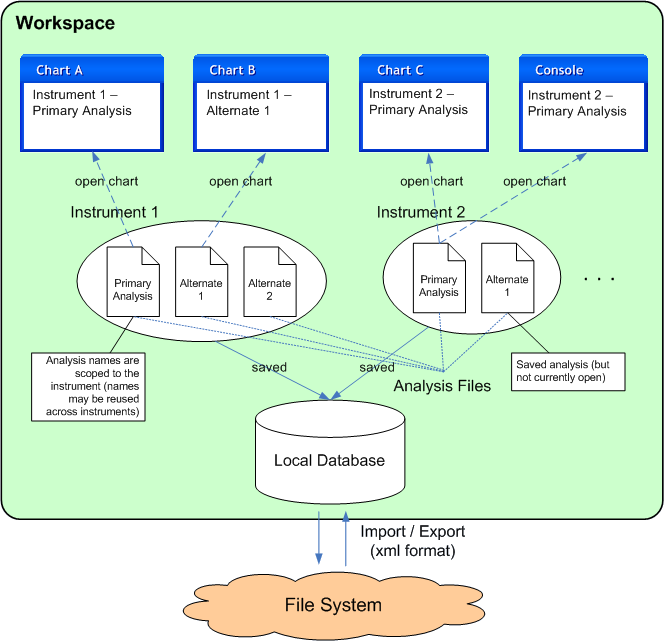
The following diagram illustrates the relationship between charts and analyses. Each instrument may have multiple analyses which are saved in the local database (repository). When you open a chart, you are opening an analysis. MotiveWave™ allows you to open an analysis from more than one chart at the same time. Changes made in either chart are synchronized between the two so you do not have to worry about overwriting you modifications.
Untitled Analyses
Version 6.1 of MotiveWave™ introduced the concept of untitled analyses. Untitled analyses are scoped to a chart (i.e. the contents of the chart are not shared between other charts of the same instrument). This is the behavior that you would typically see in other charting software. If your analysis is very simple or mostly based on studies, this is likely the desired behavior. These analyses are persisted with the chart when the workspace is shut down and re-opened, but unless explicitly saved the contents of the chart will be lost if the chart is closed.
Switching Chart Instrument
When a chart is displaying an untitled analysis, it will maintain a separate untitled analysis for every instrument that is displayed in that chart. Each of these analyses are persisted with the chart when the workspace is shutdown.
For example, open a chart for AAPL and add some drawings and/or studies to the chart. Change the instrument to GOOGL and add some drawings to that graph. If you switch back to AAPL the, drawings/studies that you added will still be there.

In the screen shot below, the instrument for the chart has been changed to GOOGL. Since this is the first time GOOGL has been displayed in the chart, a new untitled (blank) analysis will be created and displayed.

When the instrument for the chart is switched back to APPL, the retained untitled analysis for AAPL will be displayed:

Saving Untitled Analyses
An untitled analysis can be converted into a titled analysis by clicking on the “Save As” button and assigning it a name.


Titled Analyses
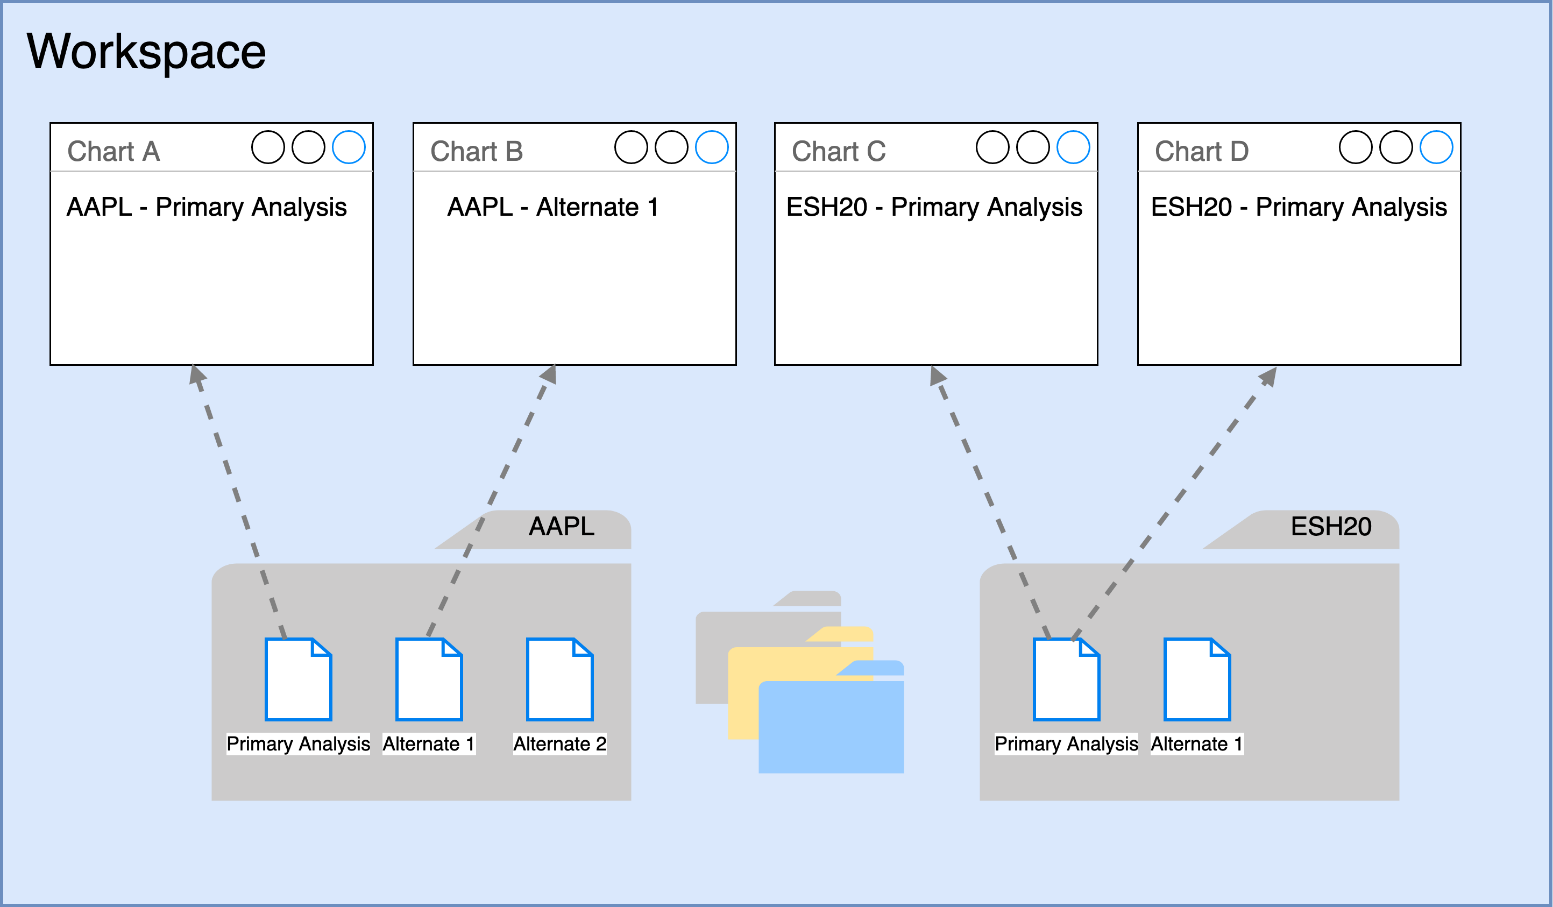
Titled analyses have a name and are stored separately from the chart. These analyses are stored in the workspace within a folder for each instrument. This allows the same name to be used across instruments.
What makes this feature unique is that the analysis is not tied to the chart (as in other charting software), but is stored independently. In most charting software the contents of the chart are lost when the chart is closed (unless explicitly saved). An analysis may also be opened concurrently in multiple charts. Changes in one chart will automatically be reflected in other charts that have the same analysis open (regardless of bar size).
The screen shot below shows how changes to one chart are automatically reflected on other charts. A trend line drawn in one chart will also be drawn in all other charts showing the same analysis (regardless of bar size).

Last updated