
Introduction
Ultimate
Acknowledgments
Special thanks to Michael Richards from Time Price Analysis (https://www.timepriceanalysis.com) for approaching us to create this study. Michael has provided significant guidance and feedback in the implementation of this study.
Introduction
Welcome to the MotiveWave™ Hurst Cycles Guide! If you are reading this document then you have already installed MotiveWave™ on your computer and you are ready to start using the application. The Hurst Cycle study is only available in the Ultimate Edition of MotiveWave™ (which is part of the free trial).
If you have not yet installed MotiveWave™ or registered for a trial on our website, please read the Installation Guide before continuing on with this document.
The purpose of this document is to highlight and explain some of the recent features added to MotiveWave™ for plotting Hurst Cycles. This document is not intended to be a comprehensive guide to Hurst Cyclic theory.
Hurst’s Cyclic Theory
Hurst’s Cyclic Theory was developed in the 1970’s by an American engineer by the name of JM Hurst. The basic tenant behind this theory is that markets achieve significant lows (or troughs) at the beginning (or end) of a cycle. Cycles have varying degrees based on wave length (in time) and are harmonized with the higher level cycles. Hurst spent years of research on mainframe computers to identify and validate cycles and how they coincide with the markets. During this period he identified a nominal model of cycle wave degrees that is common across many markets and securities.
The underlying goal of this theory is to predict when a significant price low will occur for a market or individual security (such as a stock or a foreign exchange pair). The time frame for a prediction will depend on the wave length of the cycle being analyzed.
Hurst defined eight principles that apply to cycles:
The Principle of Commonality – Markets and security price movements have many elements in common. In particular they tend to have common high and low points that coincide with cycles.
The Principle of Cyclicality – Price movements correspond to a combination of waves that exhibit cyclic characteristics.
The Principle of Summation – Cycle waves of different degrees combine to affect price movement and do so by adding the waves together.
The Principle of Harmonicity – Cycle waves of different degrees are harmonized and are related by a small integer value.
The Principle of Synchronicity – Cycle waves are phased and synchronized at price troughs.
The Principle of Proportionality – Waves in price movement have amplitude that is proportional to their wavelength.
The Principle of Nominality – A specific, nominal collection of harmonically related waves is common to all price movements.
The Principle of Variation – Variation in harmonicity, synchronicity, proportionality and nominality (previous 4 principles) is expected.
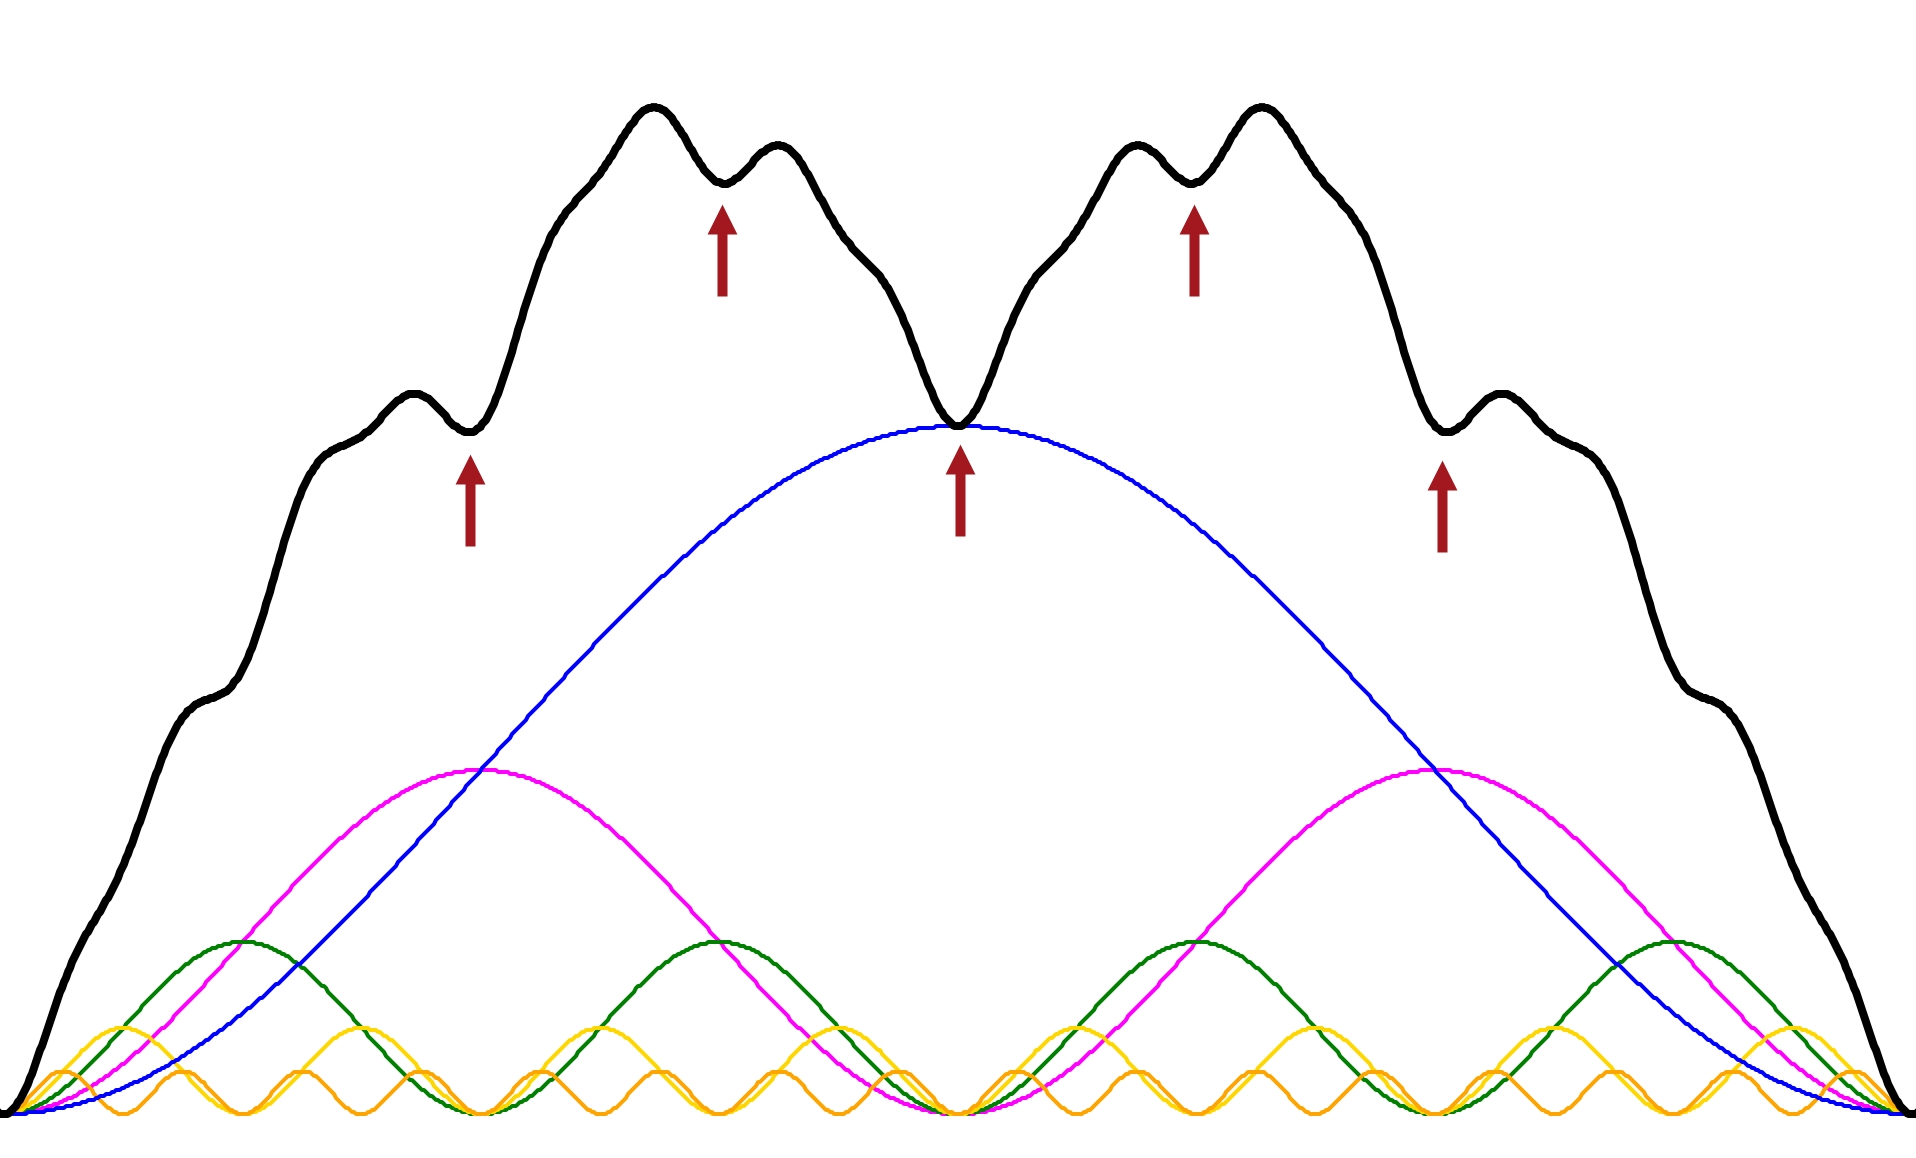
Together these principles define a theory that describes the price movement of markets and securities as a combination of an infinite number of harmonically related cycles. The troughs (as opposed to the peaks) of these cycles are synchronized at significant price lows. The theory defines exactly how these cycles combine to explain how price moves in a market or individual security (with allowance for some variation).
The following diagram illustrates how cycles of different wave lengths can combine to affect price movement in a market (using sine waves). Where the troughs of the cycles align, significant lows appear in the price structure. The black line represents price and is the summation of the cycles (sine waves).
While the basic concepts of this theory may be relatively simple, application of a cyclic model to a particular market or security is not and may require years of study and experience to apply properly.
The Hurst Cycle study in MotiveWave™ applies sophisticated pattern recognition to identify and label Hurst cycles but it is not a substitute for experience and knowledge of cyclic theory. It is therefore very important to understand all of the settings in this study in order to realize its full benefits. Manual intervention may be necessary to adjust the locations of some of the cycles to achieve optimal results.
Hurst Nominal Model
From years of research on market data in the 1970s, JM Hurst identified a nominal cycle model that was common in the markets that he followed. This nominal model is the default model that is built into the Hurst Cycle study.
Cycle Degree (Name)
Average Wave Length
Harmonic Ratio
18 Year
17.93 Years
9 Year
8.96 Years
2 x 1
54 Month
53.77 Months
2 x 1
18 Month
17.93 Months
3 x 1
40 Week
38.97 Weeks
2 x 1
20 Week
19.48 Weeks
2 x 1
80 Day
68.2 Days
2 x 1
40 Day
34.1 Days
2 x 1
20 Day
17 Days
2 x 1
10 Day
8.5 Days
2 x 1
5 Day
4.3 Days
2 x 1
Several years ago David Hickson developed a charting platform called Sentient Trader (http://www.sentienttrader.com). He extended the original Hurst nominal model to include lower time frames (intraday) as can be seen in the following table.
Cycle Degree (Name)
Average Wave Length
Harmonic Ratio
2 Day
2.2 Days
2 x 1
1 Day
1.11 Days
2 x 1
5 Hour
5.3 Hours
5 x 1
160 Minute
160 Minutes
2 x 1
1 Hour
53.3 Minutes
3 x 1
30 Minute
26.67 Minutes
2 x 1
15 Minute
13.3 Minutes
2 x 1
7 Minute
6.6 Minutes
2 x 1
3 Minute
3.3 Minutes
2 x 1
Terms and Definitions
The following are common terms and their definitions that explain some of the concepts in Hurst Cyclic analysis:
Cycle
Cycles form the basis of Hurst Cyclic theory. A cycle is a repeating period of time that begins and ends at troughs in price movement. Cycles are defined by their average wavelength (in time) but do exhibit variability in their length and amplitude.
Cycle Degree
The degree of a cycle essentially defines its wave length. Higher level degrees have longer wavelengths vs shorter wavelengths for lower level degrees.
Cycle Model
Market cycles are grouped together to form a cycle model. All cycles in the model are related to the other cycles using a simple harmonic ratio. The default cycle model used in MotiveWave™ is the Hurst Nominal Model, but custom cycles may be used as well.
FLD
FLD stands for Future Line of Demarcation. The FLD is calculated by transposing the midpoint of each candle forward in time by half the wave length of the cycle degree. For example and 20 day cycle (17 day wave length) would transpose the midpoint of each candle forward by 9 bars if displayed on a daily chart (9 is roughly half of the 17 day wave length).
Harmonic Ratio
A Harmonic Ratio represents the ratio of cycle waves to the next cycle wave of higher degree. In most cases a cycle wave will be related to the next higher cycle by a ratio of 2 to 1 but other ratios are possible (such as 3 to 1 or 5 to 1).
Hurst Nominal Model
This is the cyclic model as defined by JM Hurst in the 1970s after years of computational analysis using mainframes.
Peak
A peak is a high point in price movement for a market or individual security.
Sine Wave
A curve the represents the periodic oscillations of amplitude computed from a sine function. Sine waves may be optionally plotted for any cycle in the Hurst Cycle study.
Trough
A trough is a low point in price movement for a market or individual security.
VLT
VLT stands for Valid Trend Line. VLTs are used to validate the placement of cycle markers. They are drawn by connecting the troughs of the two most recent cycle markers of the given degree and extending the line. VTLs drawn for the troughs of a cycle are used to confirm a peak in the cycle of one degree higher when the price crosses below the VTL. Conversely, VTLs drawn for the peaks of a cycle may be used to confirm a trough in the cycle of one degree higher when the price crosses above the VTL.
Last updated