Study Overview
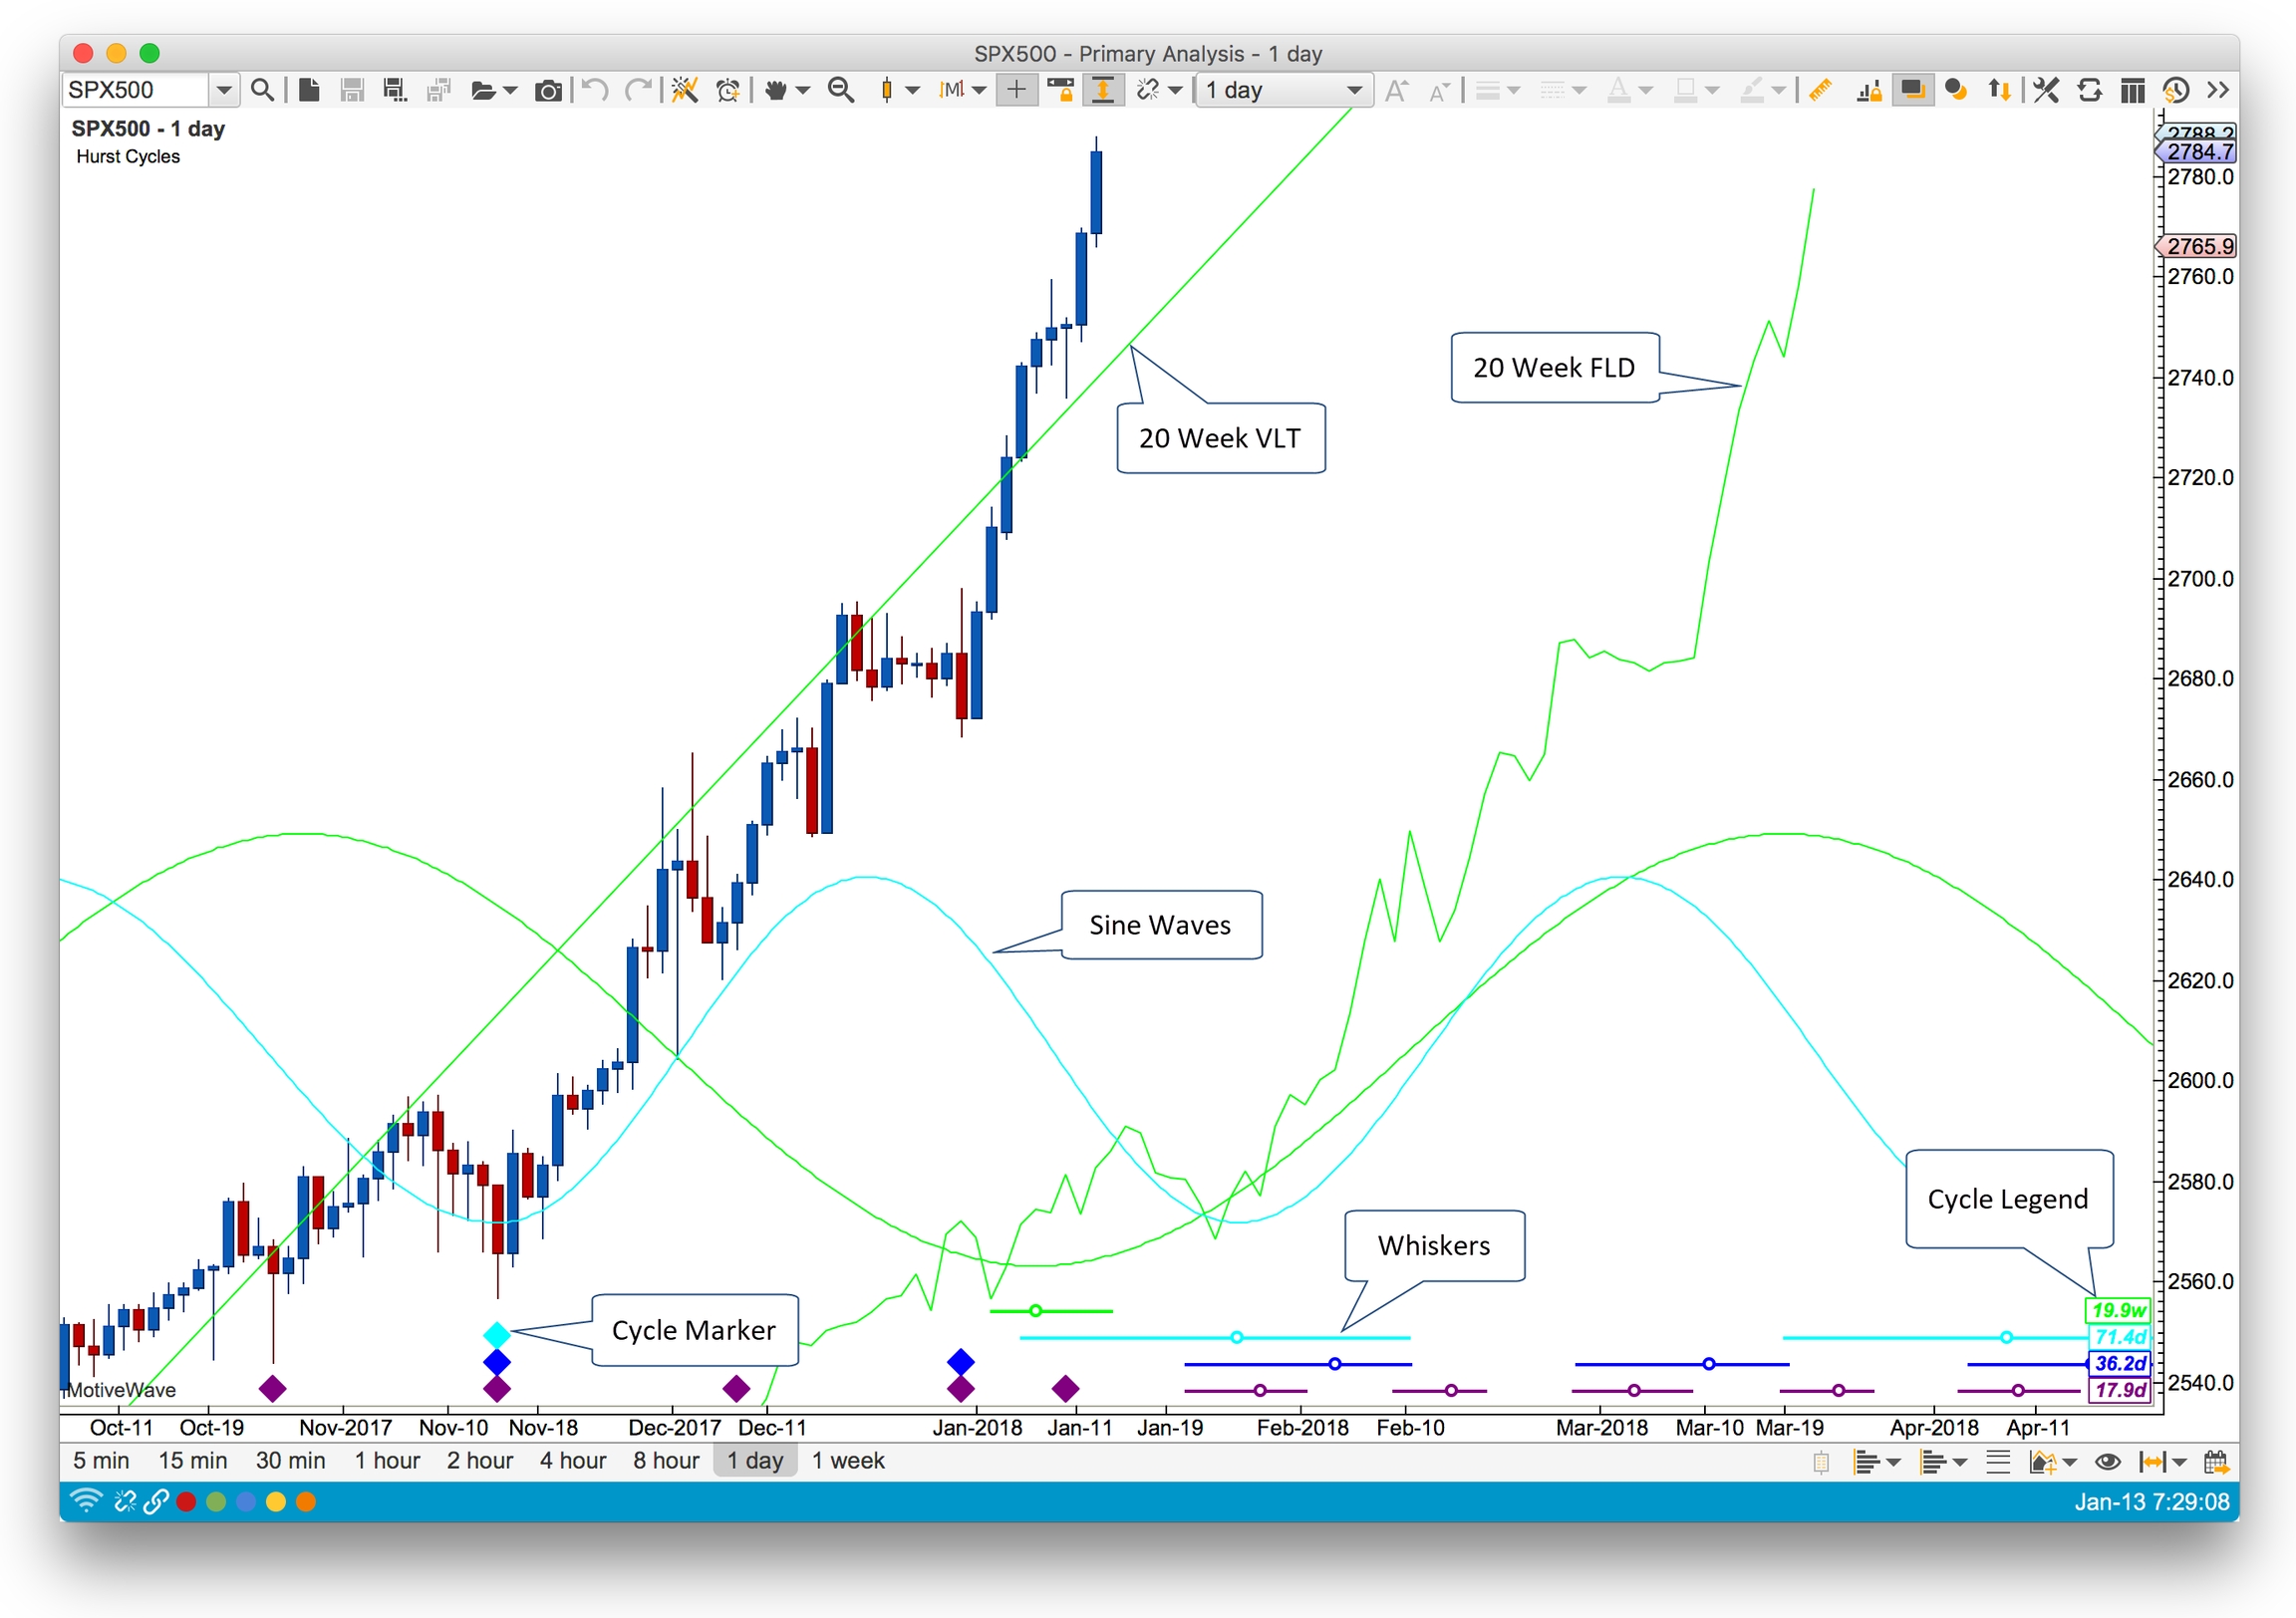
In this section we explore the elements of the Hurst Cycle study in MotiveWave™. The screen shot below contains a sample Hurst Cycle study overlaid on an S&P 500 daily chart:
Study Components:
Cycle Marker – These markers indicate where they cycles begin and end for each cycle that is plotted in the study. The color of the marker indicates the cycle degree to which the marker belongs.
Whiskers and Circles – Each whisker (a colored horizontal line with a small circle) delineates the possible range for the completion of the next cycle. The circle on the line is the location of the average cycle length (computed from the plotted cycle markers)
Cycle Legend – Identifies each cycle degree (by color) and gives the average computed cycle length.
Sine Waves – Sine waves may be plotted for each cycle. These can be useful to visually identify where the cycle troughs line up for multiple cycles.
Semi Circles – (not shown) optionally semi circles may be use identify there the cycles begin and end.
VLT – Valid Trend Line. A VLT may be drawn by connecting the two most recent price troughs for a cycle. VLTs are often used to validate (or invalidate) the location of the cycle markers.
FLD – Future Line of Demarcation. This line plots the midpoint of each candle and transposes it by half the cycle period into the future.
Settings
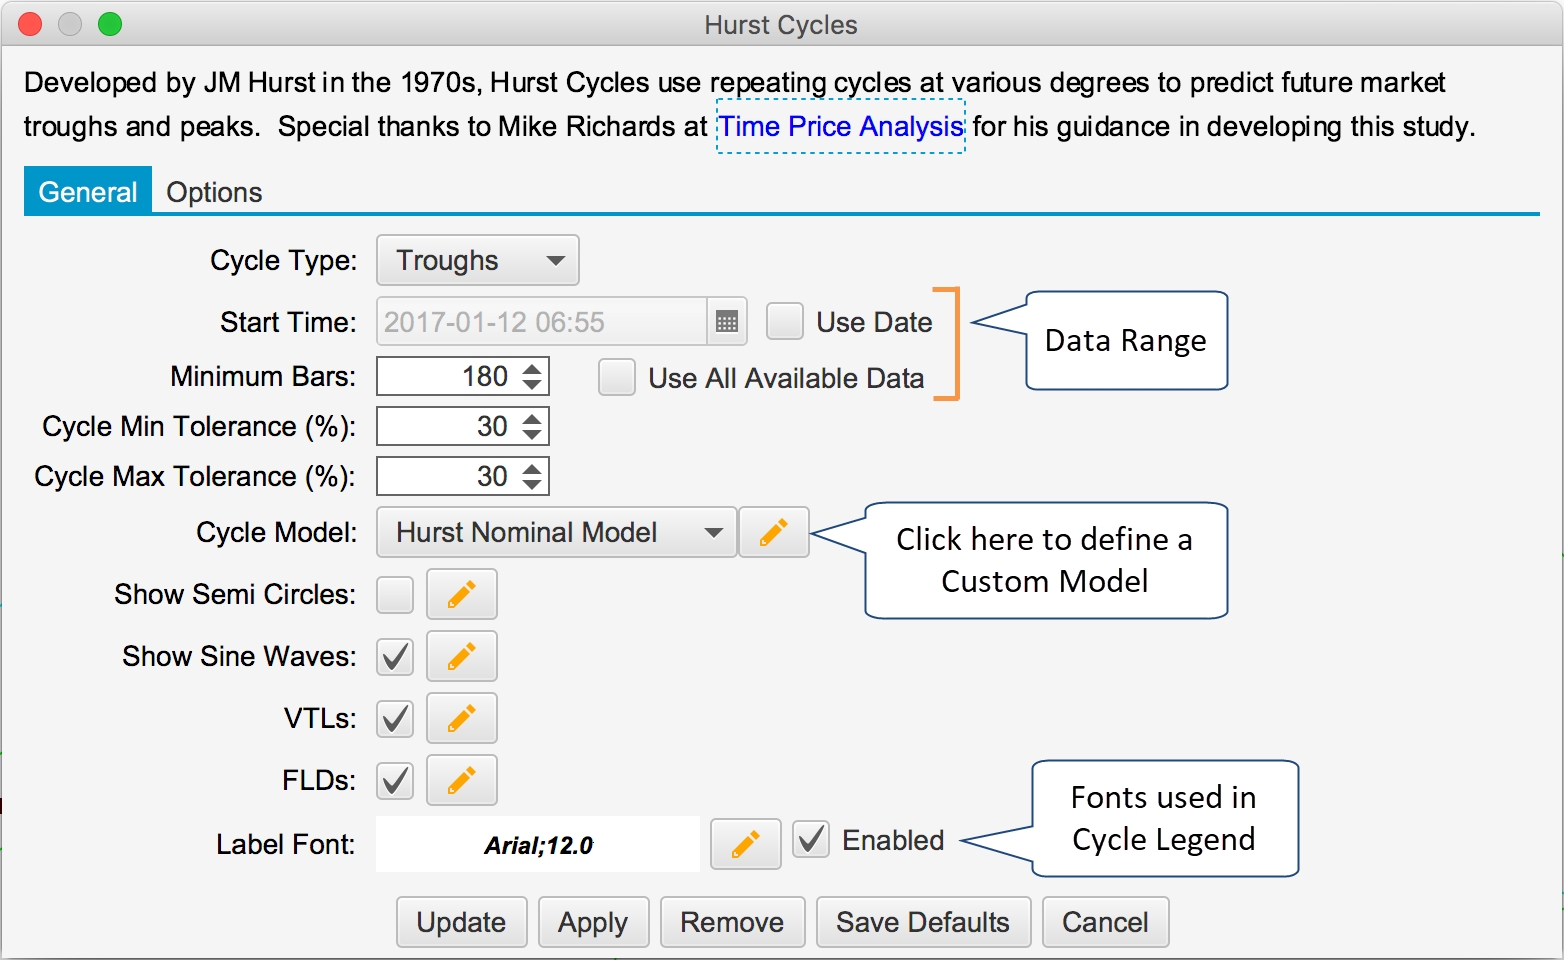
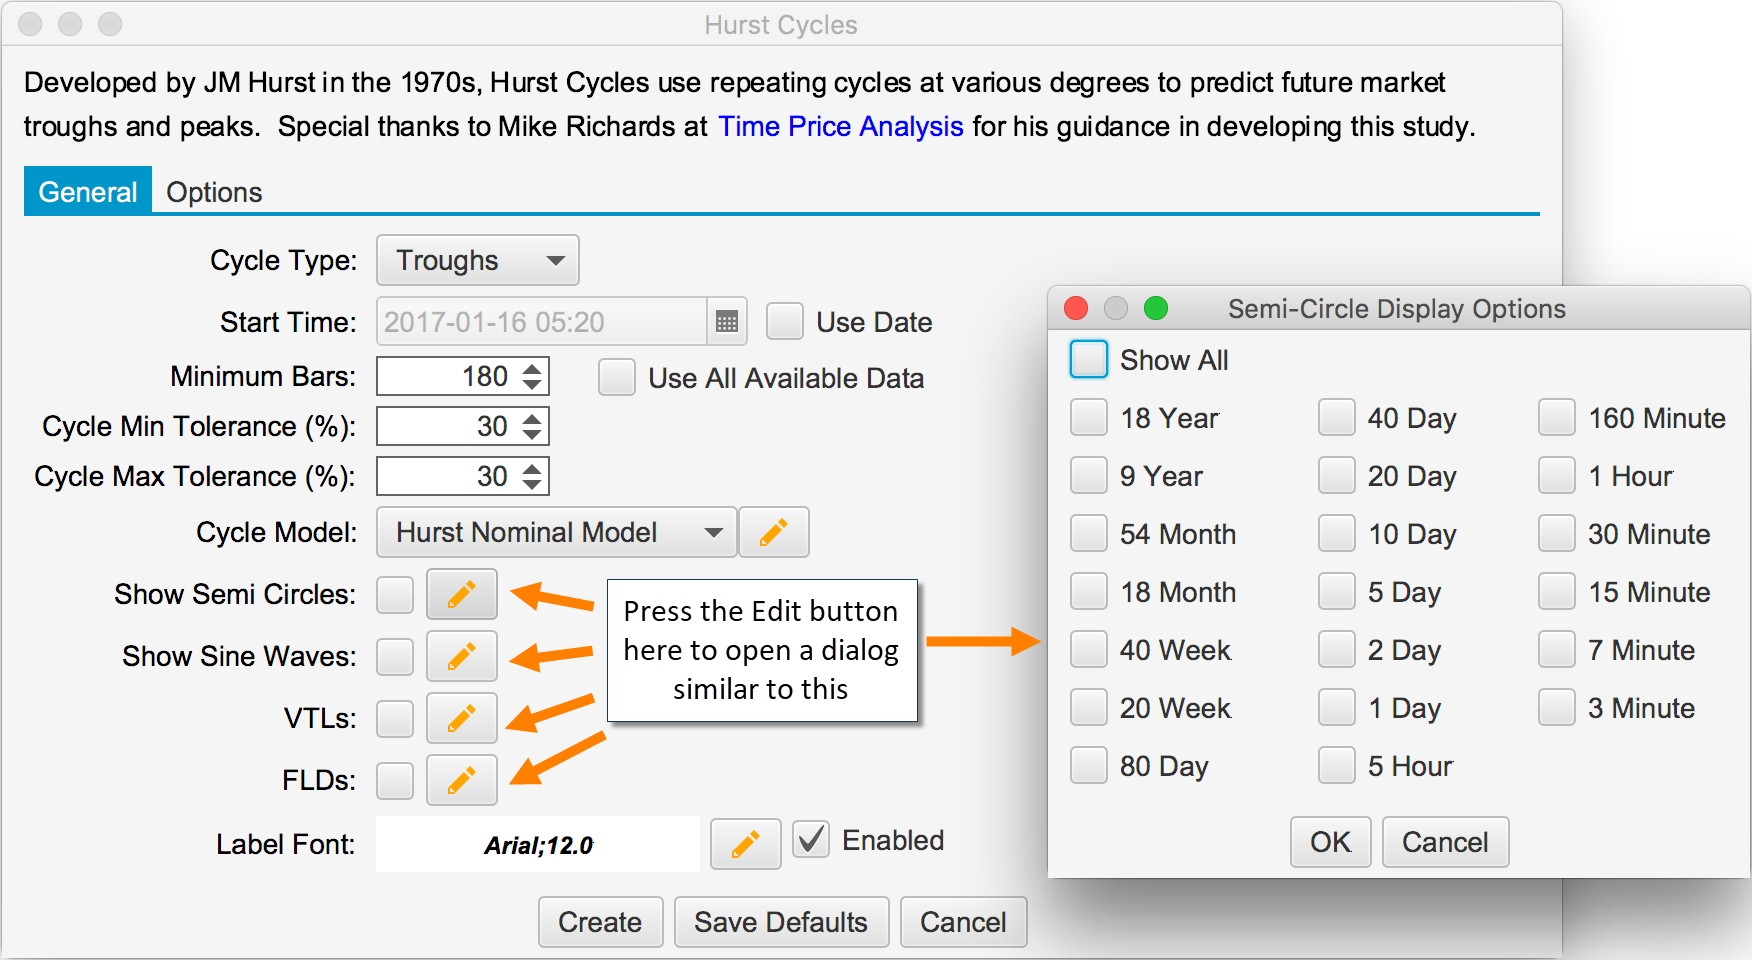
The following screen shot shows the available settings for the Hurst Cycles Study.
Cycle Type
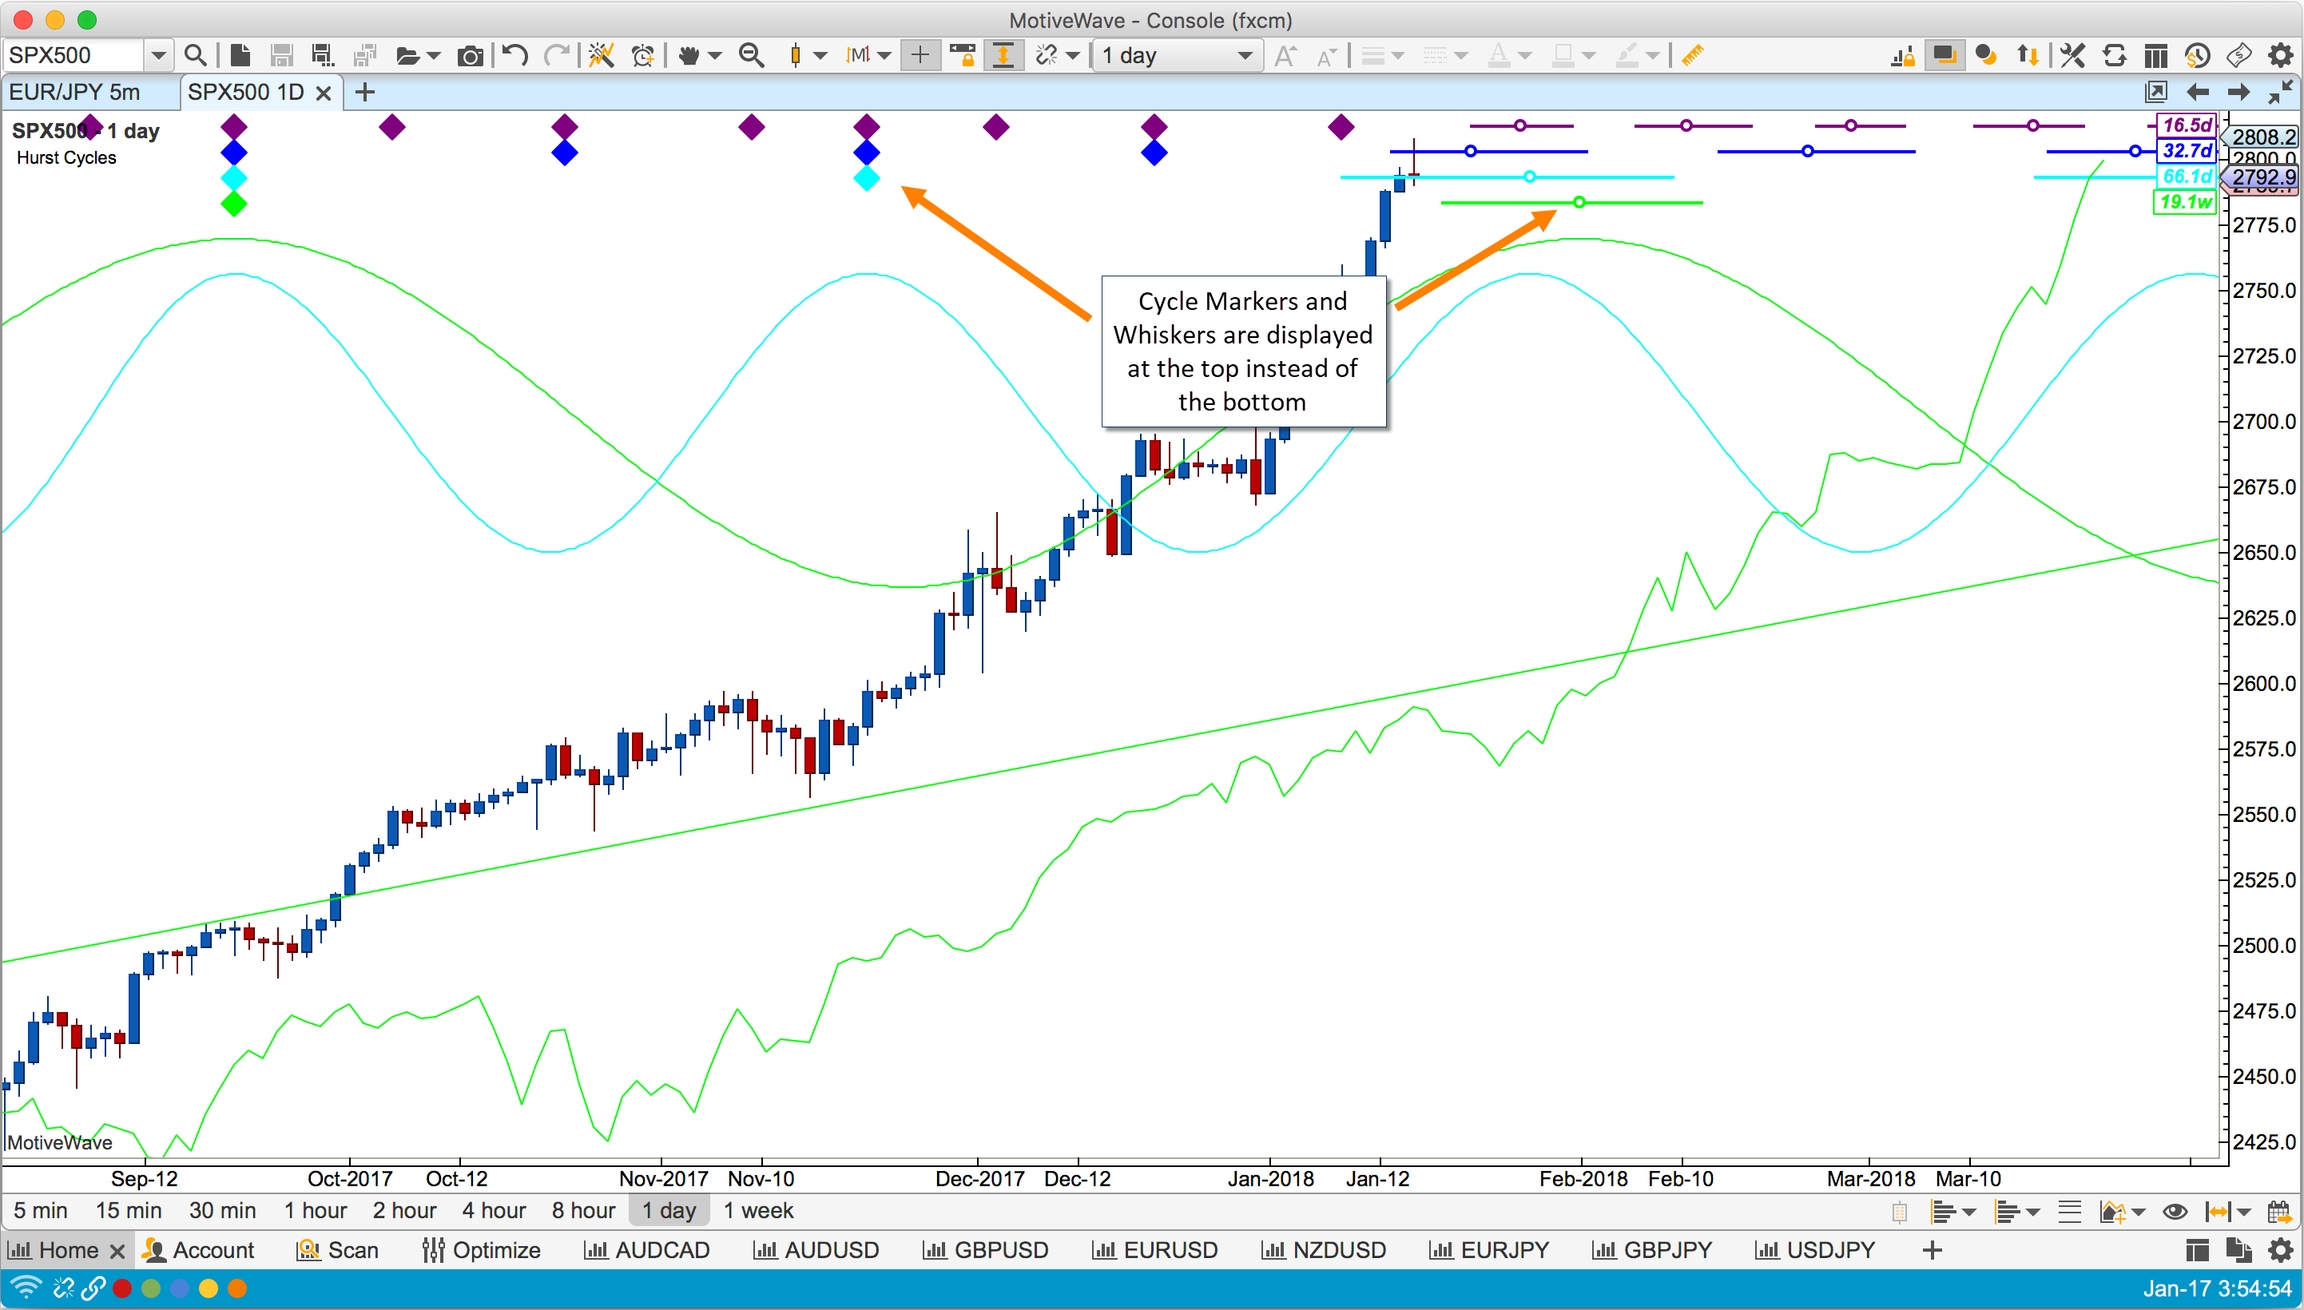
JM Hurst’s original cyclic theory only applied to price troughs. You can however switch this mode to analyze the price peaks instead. In “Peaks” mode the study is displayed at the top of the chart (instead of the bottom). This enables you to display both a Peaks and a Troughs study on the same chart. The screen shot below shows the Hurst Cycles study with the Cycle Type parameter set to “Peaks”:
Data Range
The data range settings are very important for the pattern matching algorithm inside the Hurst Cycles study. The available range of data directly determines the top level cycle degree (since this is time based). Once the top level markers are determined, MotiveWave will recursively “decompose” each cycle degree using the harmonic relationships and tolerance to find the best matching peaks/troughs. The following options may be used to determine the range of data available to the study:
Start Time – Use this option to specify a specific start date/time. MotiveWave will place the first (top degree) cycle marker at this point (or closest significant price trough/peak).
Minimum Bars – This option will ensure that MotiveWave loads the specified minimum number of bars (provided the historical data is available from your broker/data service). However, more data may be loaded if the user scrolls back in time or another study requires more data.
All Available Data – Use this option to load all data from the local cache of historical data. Note: this option will not enforce minimum number of bars to be loaded.
Tolerance
Hurst’s principle of variation states that the wave length of each cycle will vary. The Cycle Min/Max Tolerance settings enable to you set boundaries on how much the wave length will vary.
Consider for example the 10 Day cycle (which actually has a wave length of 8.5 days). If the minimum tolerance is set to 20% and the maximum tolerance is set to 30%, then the range for this cycle is:
Minimum Length: 6.8 Days (8.5 – 8.5*0.20)
Maximum Length: 11.05 (8.5 + 8.5*0.30)
It is very important to ensure that the tolerance settings do not cause the wave lengths of the cycle degrees to overlap. For example a min/max tolerance of 100% would cause most cycles to overlap with their parent cycles in the Hurst Nominal Model.
Cycle Model
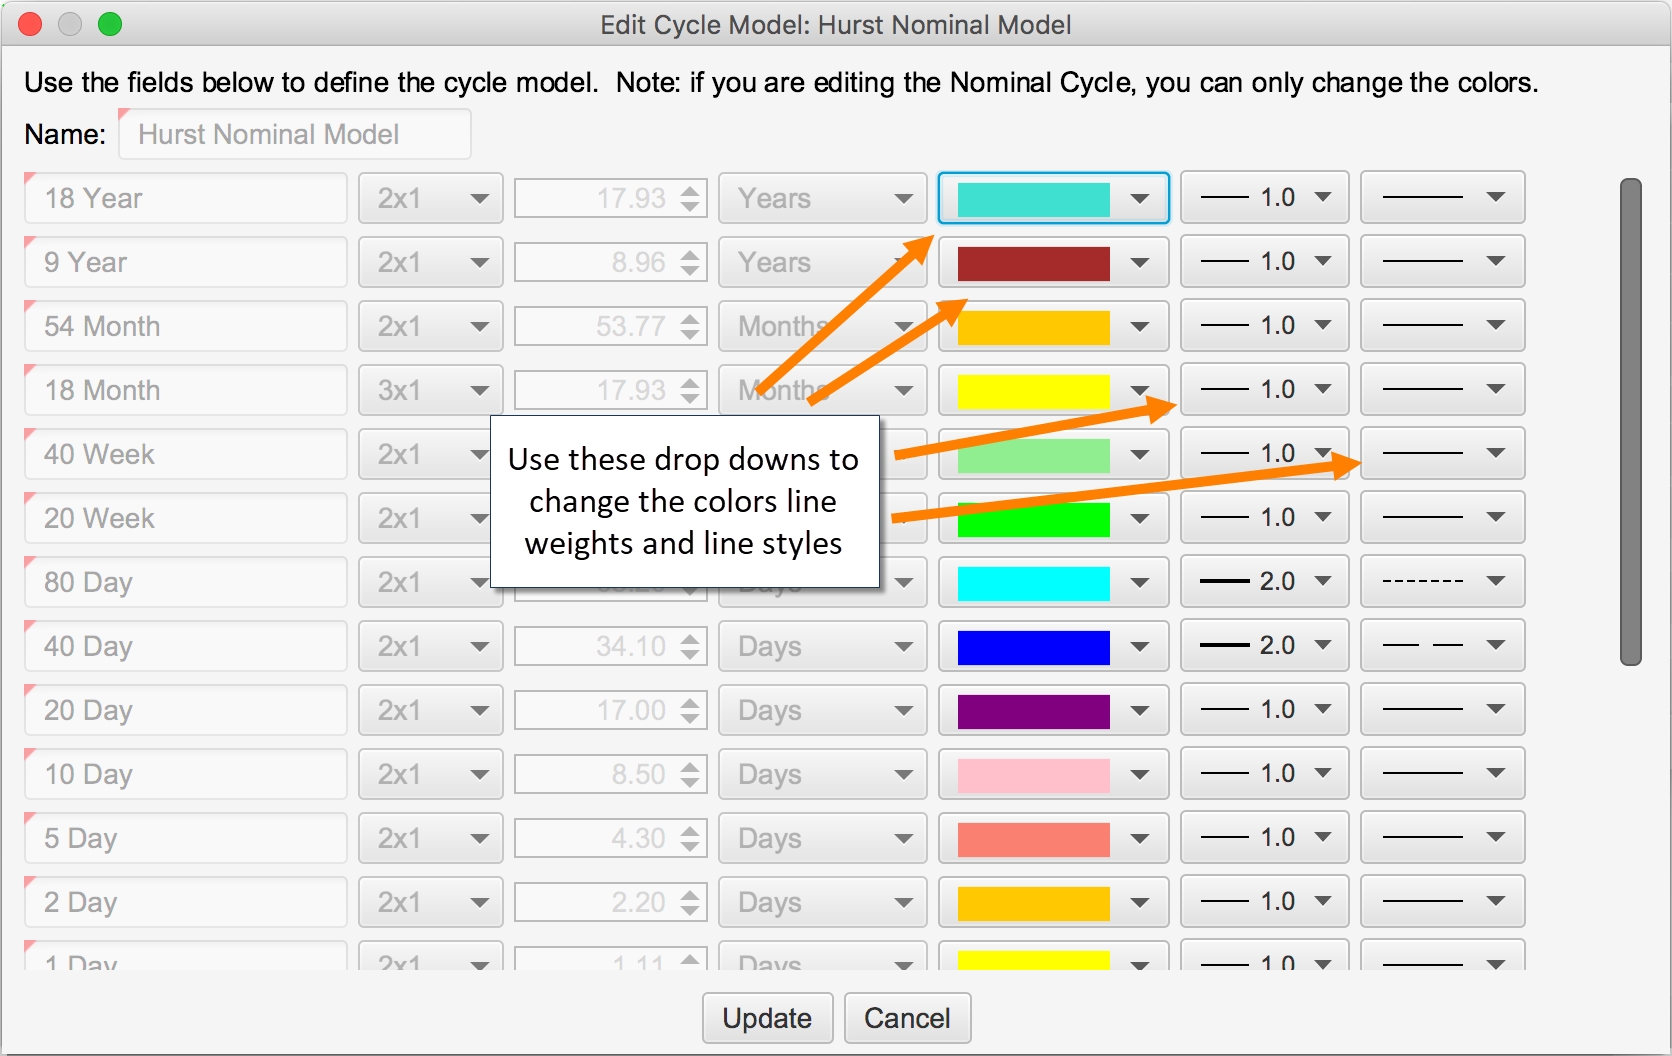
By default, MotiveWave™ will use the Hurst Nominal Cycle Model for its cyclic analysis (which has been expanded with the intraday cycles developed by David Hickson). You can modify the colors and line weights/styles for this model, but the cycle lengths and harmonic ratios cannot be changed.
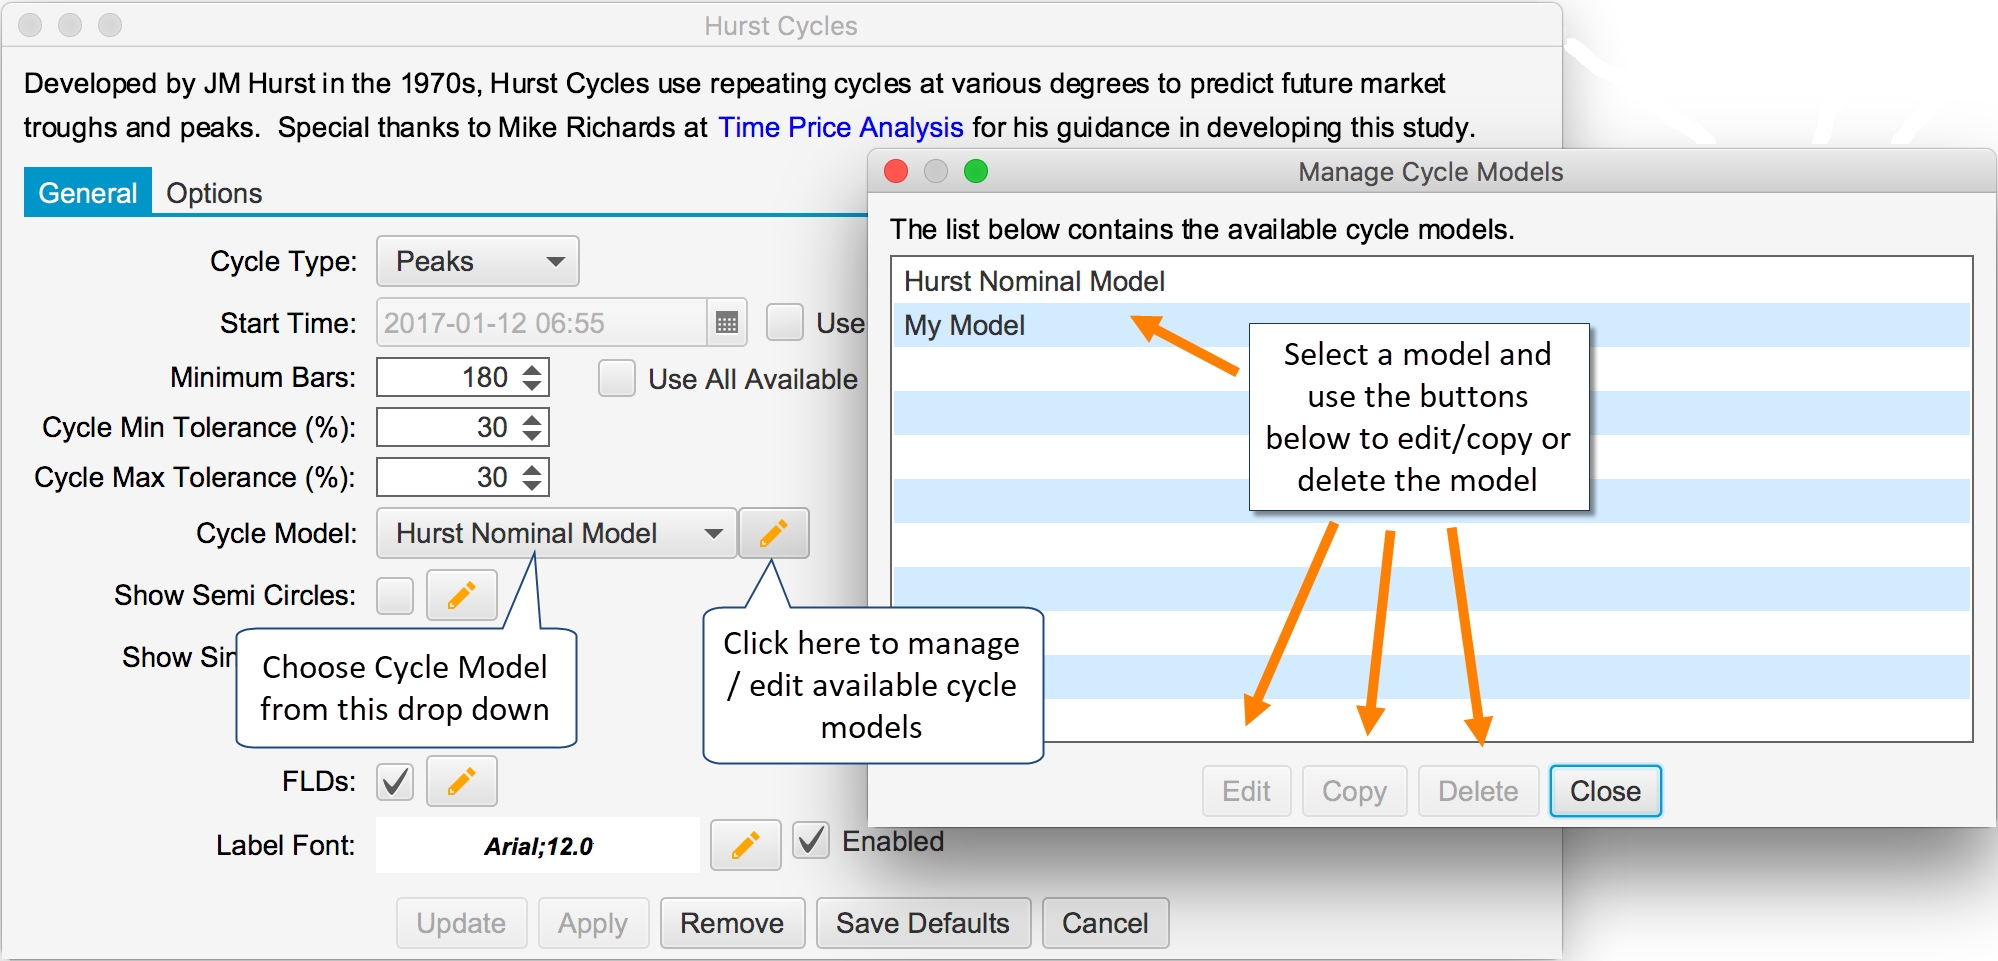
Additional cycle models may be defined and used instead of the Hurst Nominal Cycle Model. Click on the edit button (pencil icon) next to the Cycle Model drop down. From the Manage Cycle Models dialog, a new cycle model can be created by selecting an existing model and pressing the “Copy” button.
Editing the Hurst Nominal Model
You can adjust the colors of the cycle markers and the line weights/styles for the built-in Hurst Nominal model. Select the model in the Manage Cycle Models dialog (see previous section) and click on the “Edit” button. You can choose the color and line weight/style for each cycle degree from the active drop down buttons.
Creating Custom Models
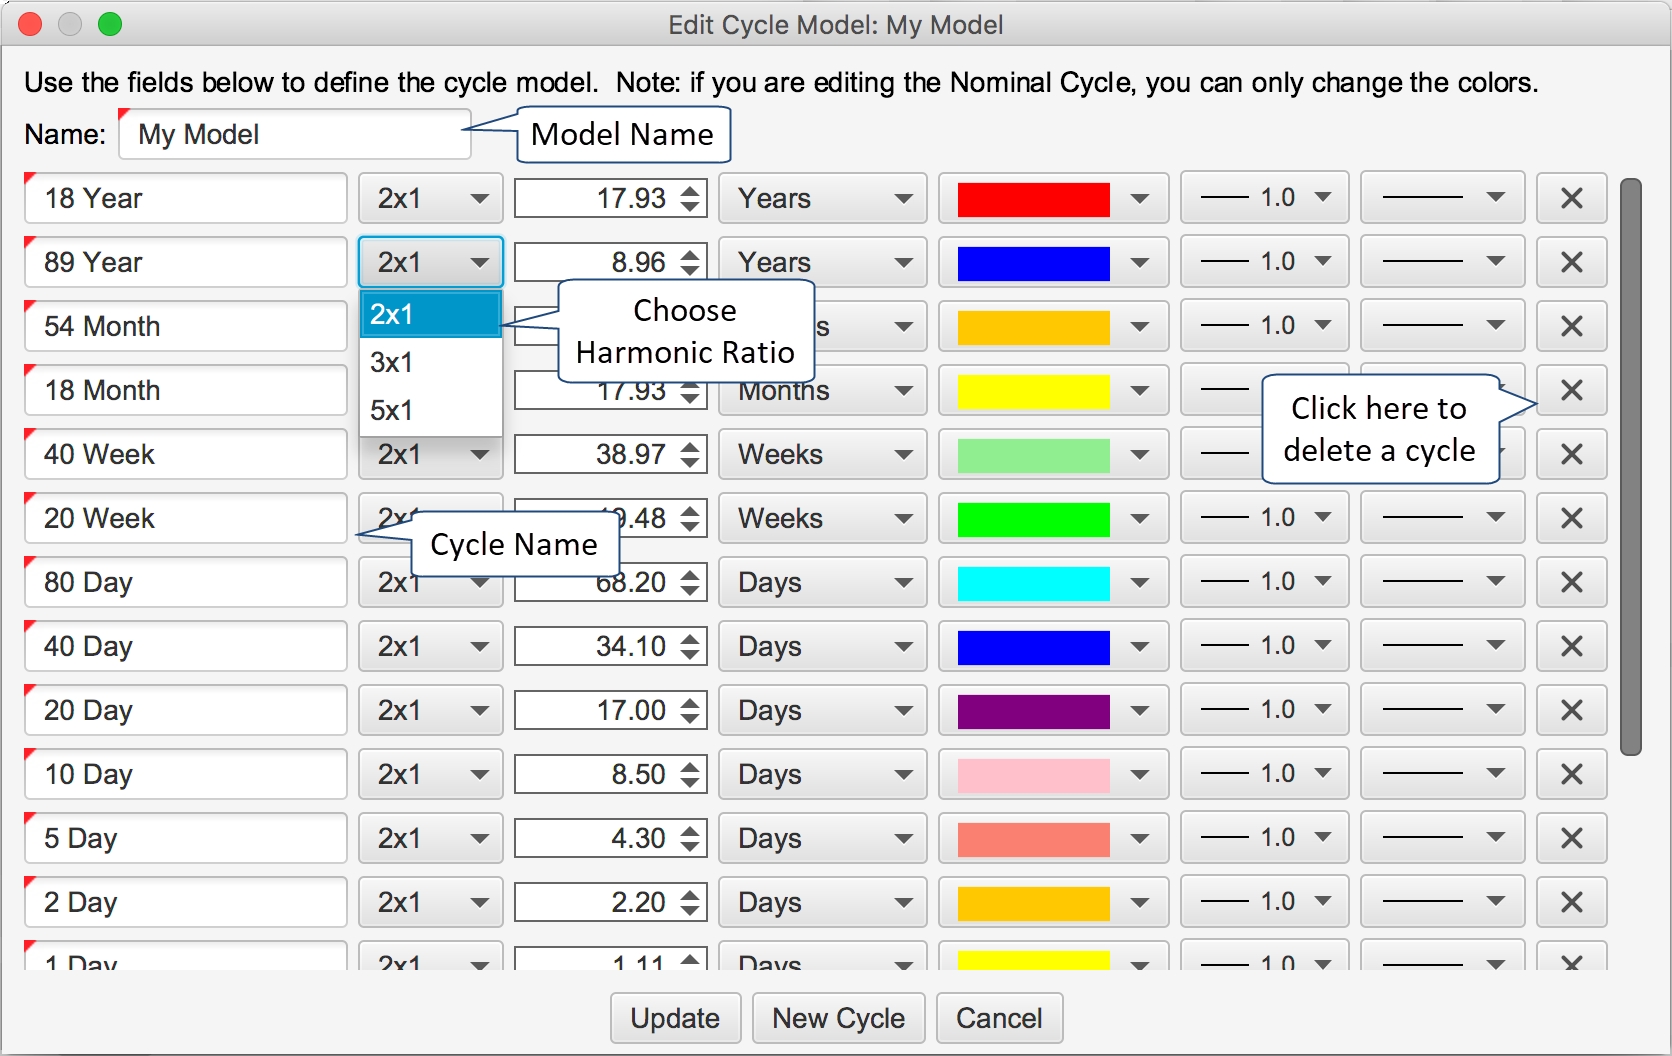
Custom models can be created by copying an existing model and modifying its properties (see Manage Cycle Models dialog above). Once you have copied an existing model, press the Edit button from the Manage Cycle Models dialog to open the cycle editor dialog (see below). You can add or remove existing cycles and change the cycle names, wave lengths, colors and harmonic ratios.
Other Options
The following options can be configured to be displayed for all or specific cycles on the chart. The available cycles will depend on the Cycle Model that was chosen for the study.
Semi Circles
Sine Waves
VTLs
FLDs
User Interaction
After the Hurst Cycles study is added to a chart, you can interact with it directly through the following:
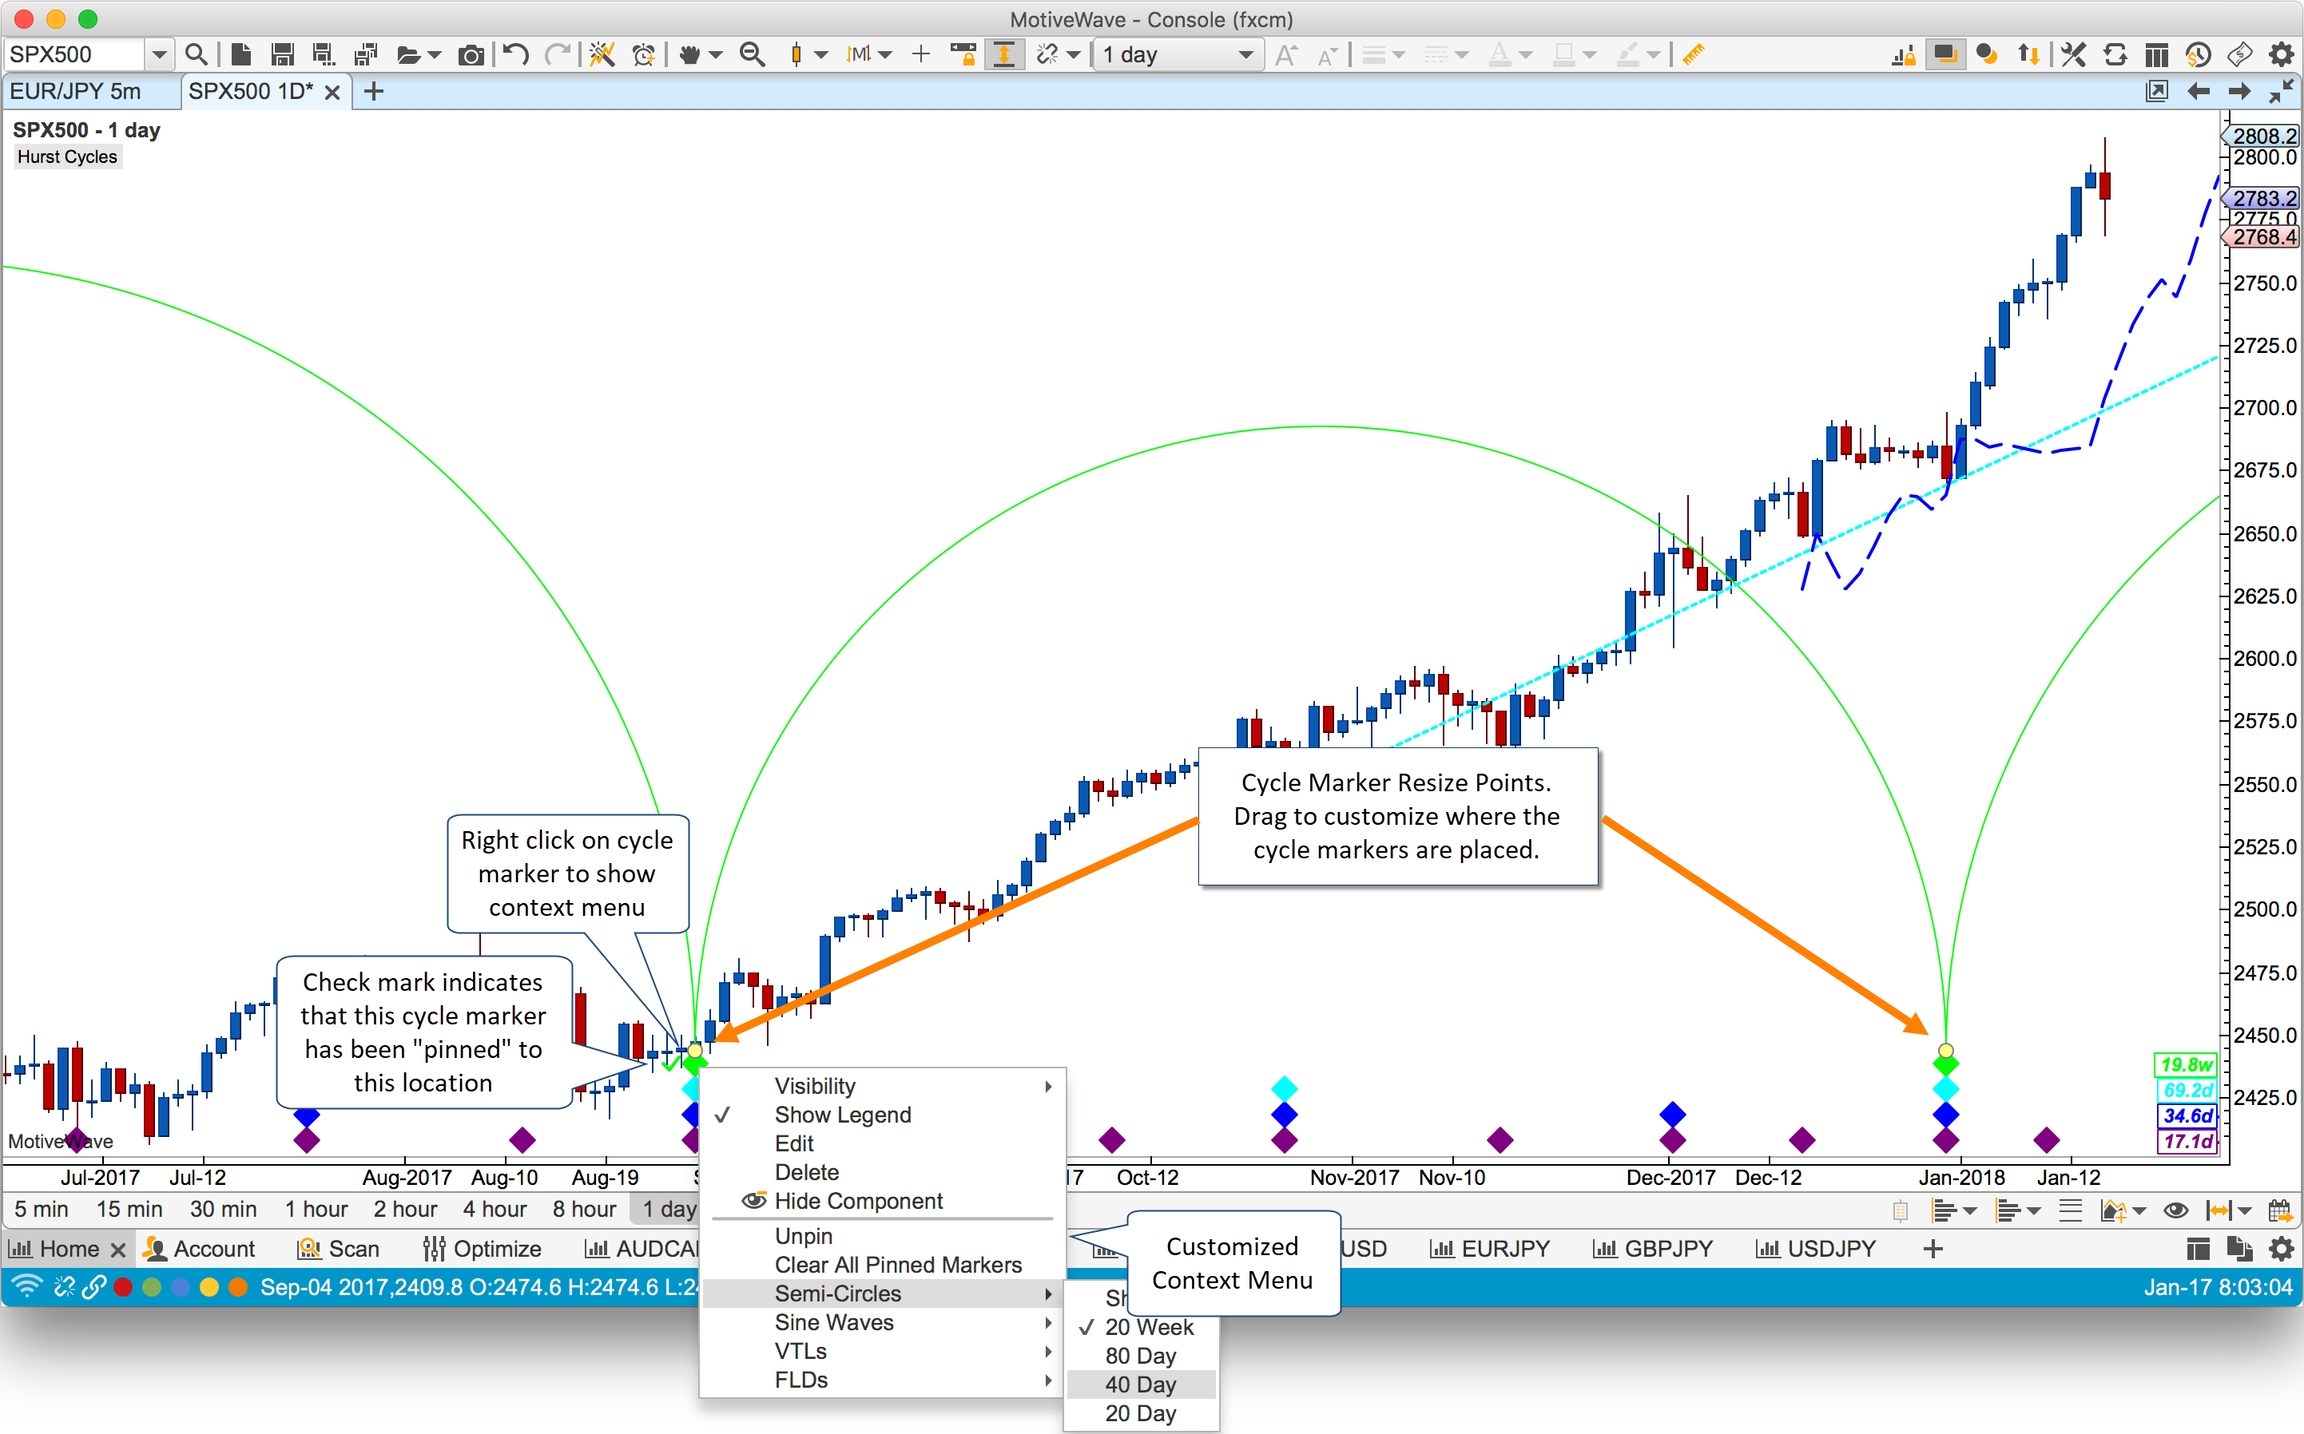
Context Menu – Right click on the study to display a custom context menu for configuring some of the study options
Resize Points – Resize points are displayed for the top level cycle markers. You can adjust the location of some or all of the cycle markers to override the automatic placement of cycle markers using the built-in pattern recognition algorithm.
The screen shot below illustrates user interaction points with the Hurst Cycles study (without opening the study properties dialog):
Context Menu
From the context menu, you can quickly show or hide Semi-Circles, Sine Waves, VTLs or FLDs or specific cycle degrees. In addition, the context menu also has the following options:
Unpin – If the cycle marker at the right click location has been pinned (dragged to a specific location) this option will allow the study to automatically adjust the marker location using its pattern matching algorithm. This option will not be available it the selected cycle marker has not been pinned.
Clear All Pinned Markers – removes all the user defined positions for the cycle markers. This tells the study to automatically choose the highest scoring peaks/troughs for all cycle markers.
Resize Points
The resize points (yellow dots on the top level cycle markers) allow you to specify where some of the markers should be placed. The study will place the remaining markers around these points using the constraints from the cycle model.
Once a cycle marker has been moved, it is considered to be “pinned” and the study will not move its location. Pinned cycle markers will have a check mark displayed on the left hand side to visually indicate that it has been chosen by the user.
Cycle markers can be moved at any time by dragging the yellow dots. The dots will snap to the closest bar. You can “unpin” (tell the study to automatically position it) via the right click context menu (choose the “Unpin” option).
Last updated