
Using the Hurst Cycle Study
This section discusses some of the basics of how to use the Hurst Cycles study to predict future market peaks or troughs.
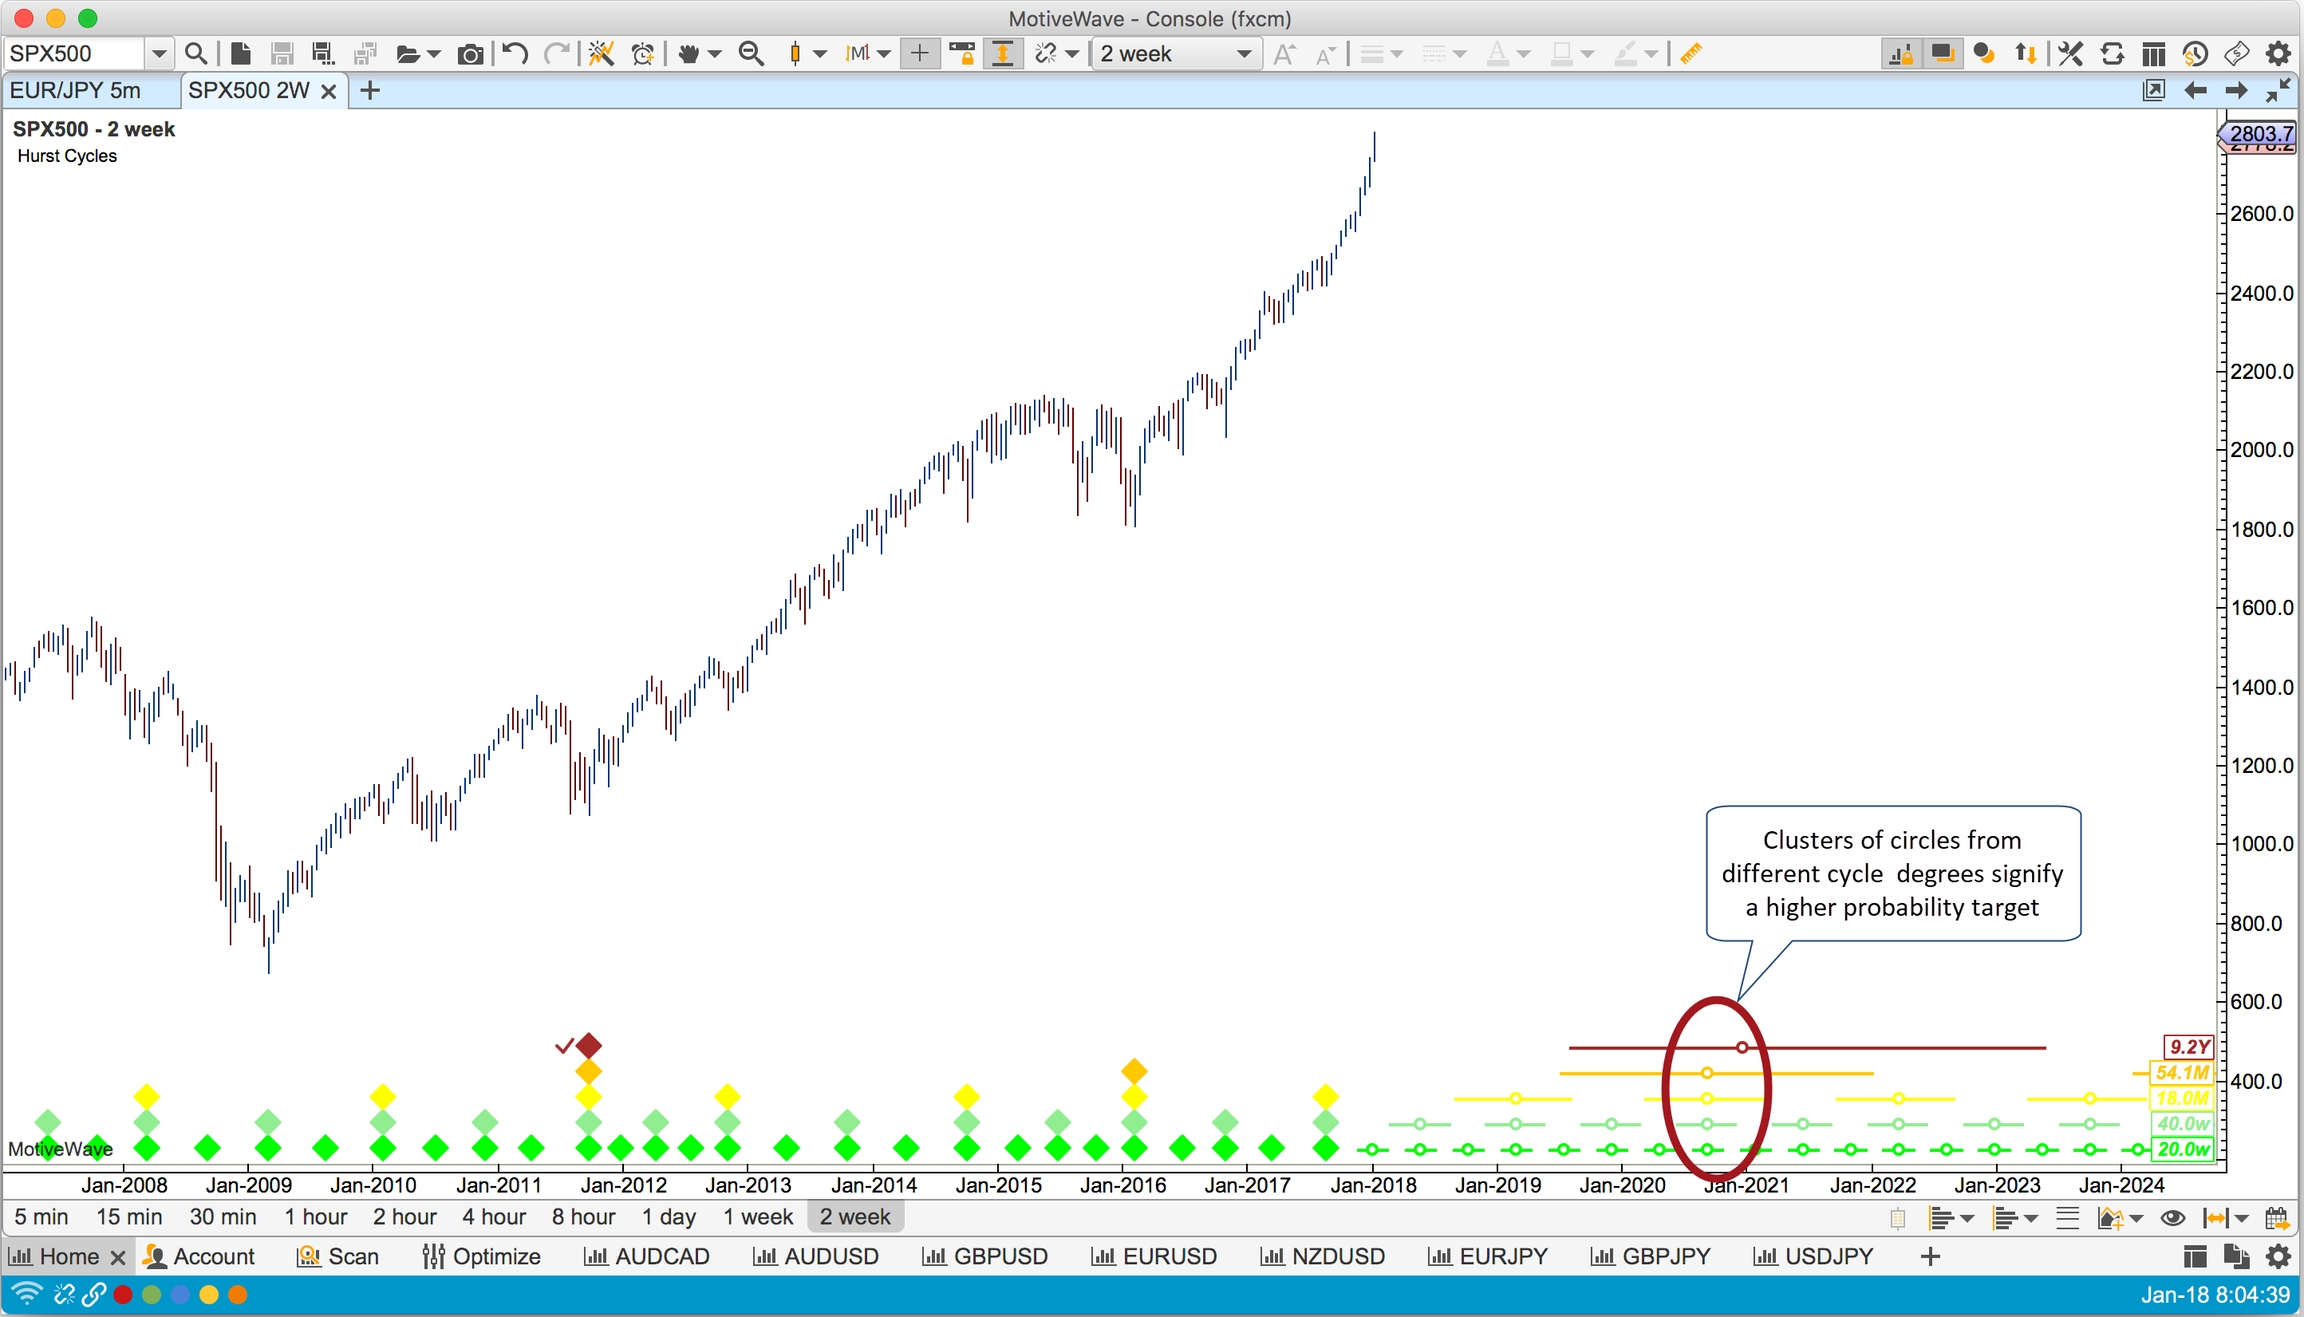
Circles and Whiskers
The circles and whiskers (horizontal lines with a circle overlaid) are a projection from the latest confirmed cycle marker into the future. The circle represents the average cycle time and the start/end of the lines mark the minimum and maximum lengths of the cycle (using the Cycle Min/Max tolerance settings).
These can be used to predict when a price trough (or peak) may occur. Higher probability targets occur where circles from different cycles cluster together.
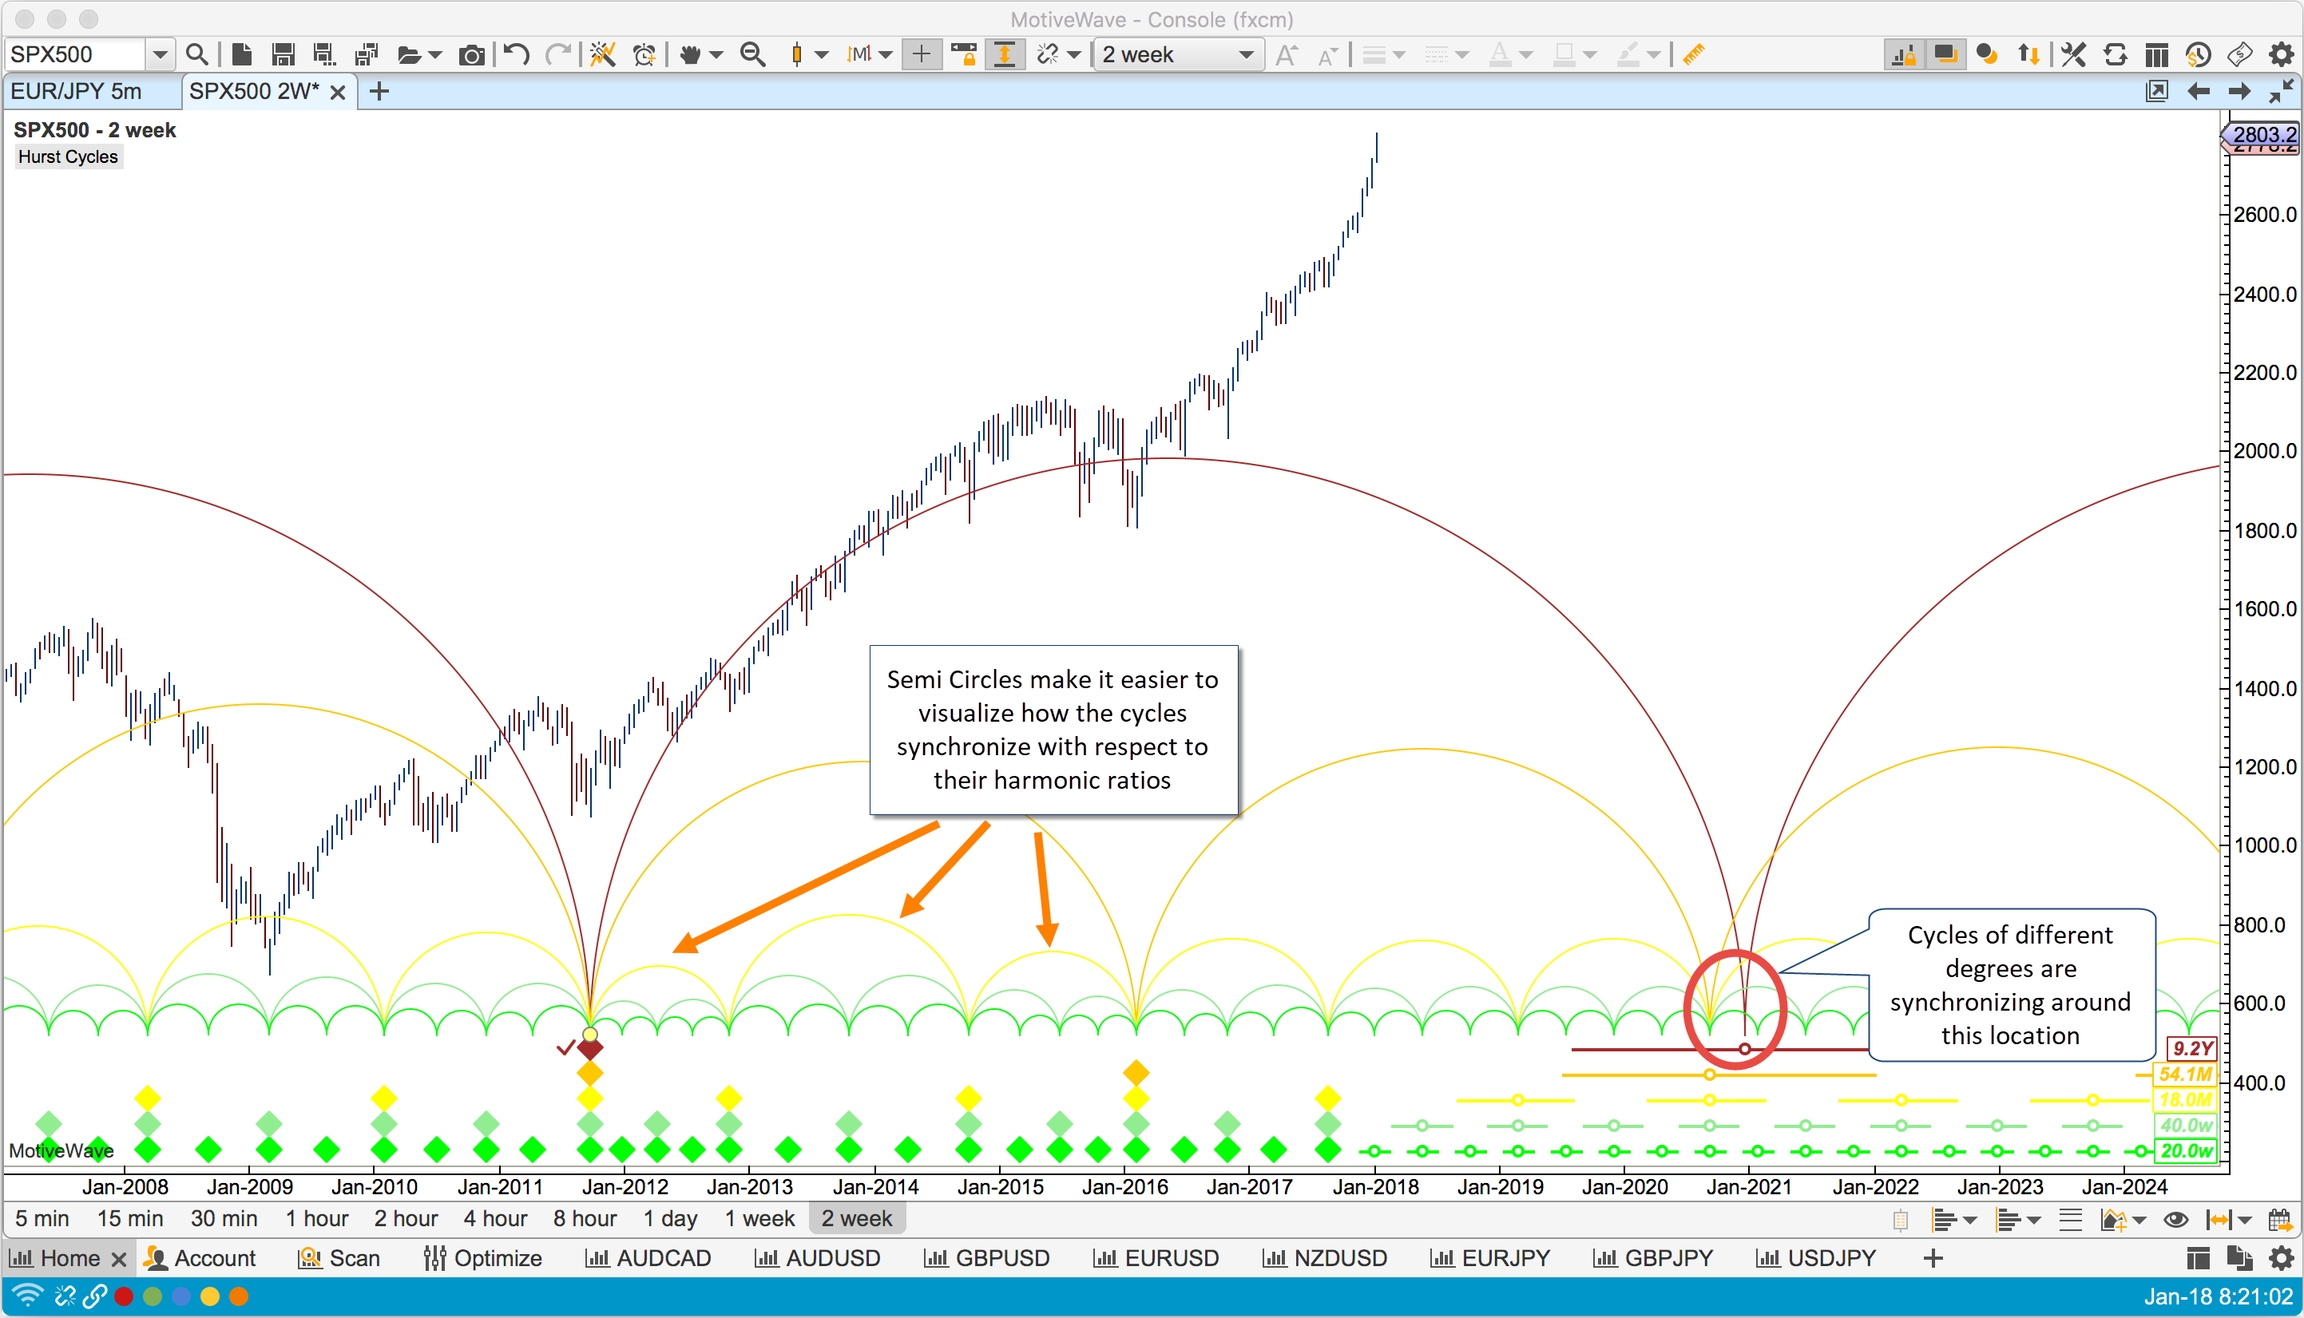
Semi-Circles and Sine Waves
Semi-Circles and Sine Waves may be used to help visualize where the cycles of different degrees align at price troughs (or peaks). Hurst’s cyclic theory states that cycles of different degrees will synchronize at certain points that are determined by their harmonic ratios.
Semi-circles in particular are good for visualizing the points where the cycles synchronize at their harmonic ratios. The higher level cycle’s circle encompasses circles from the lower cycles.
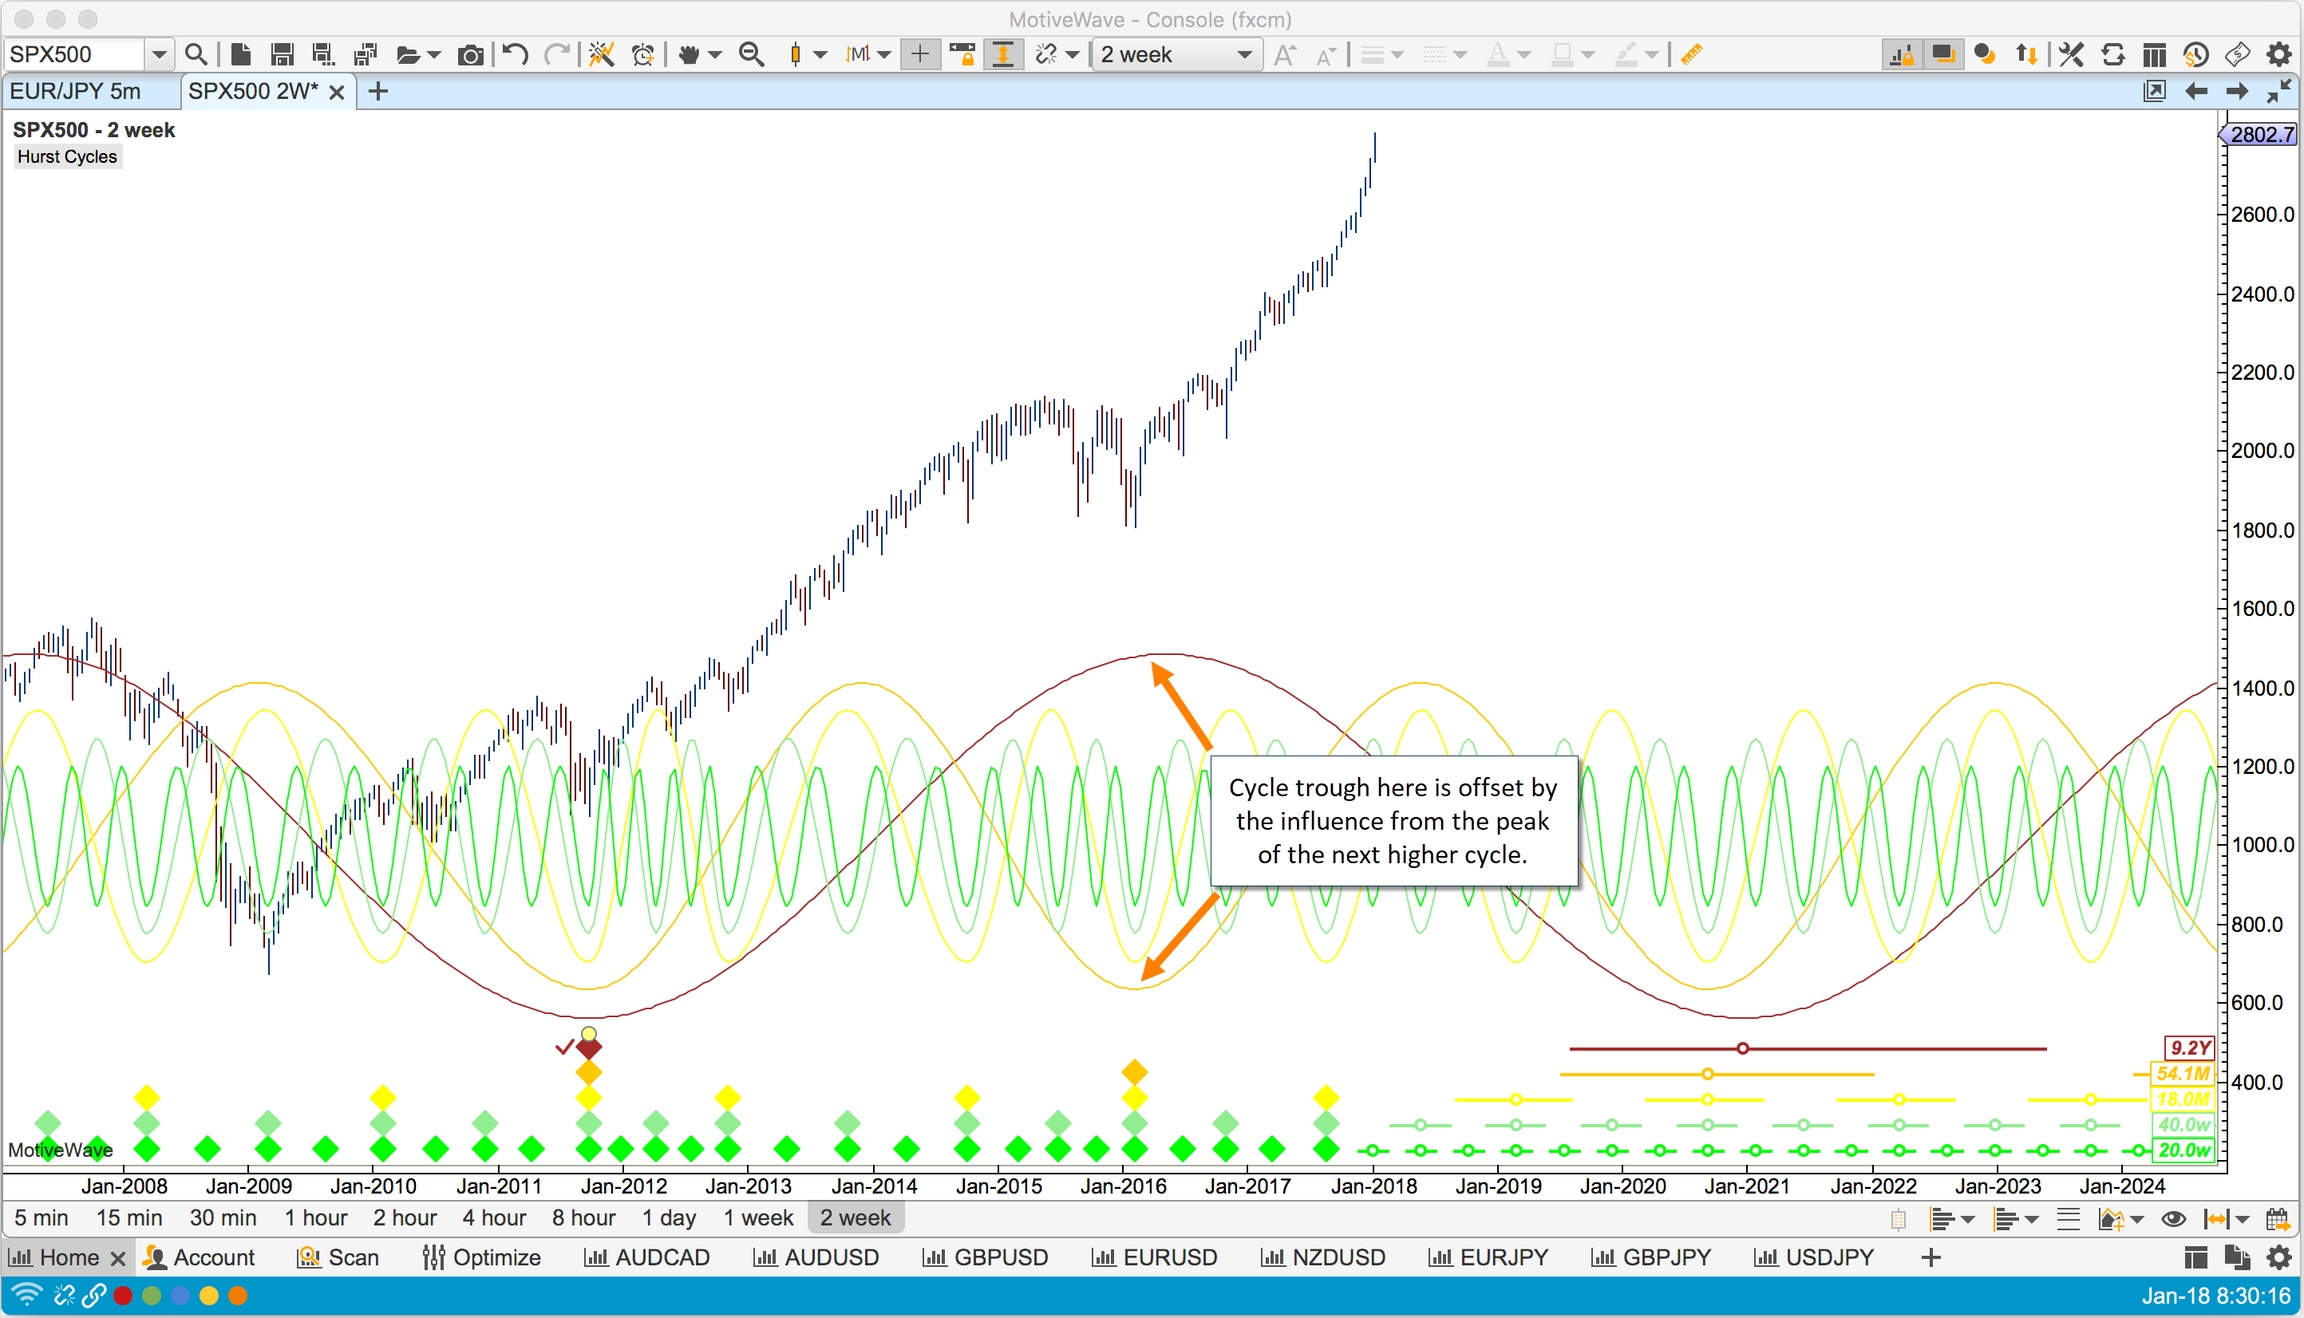
Sine waves help to visualize the influence from the higher level cycle on a price trough (or peak). Locations where the sine waves are out of sync may be muted by the impact of the higher level cycle:
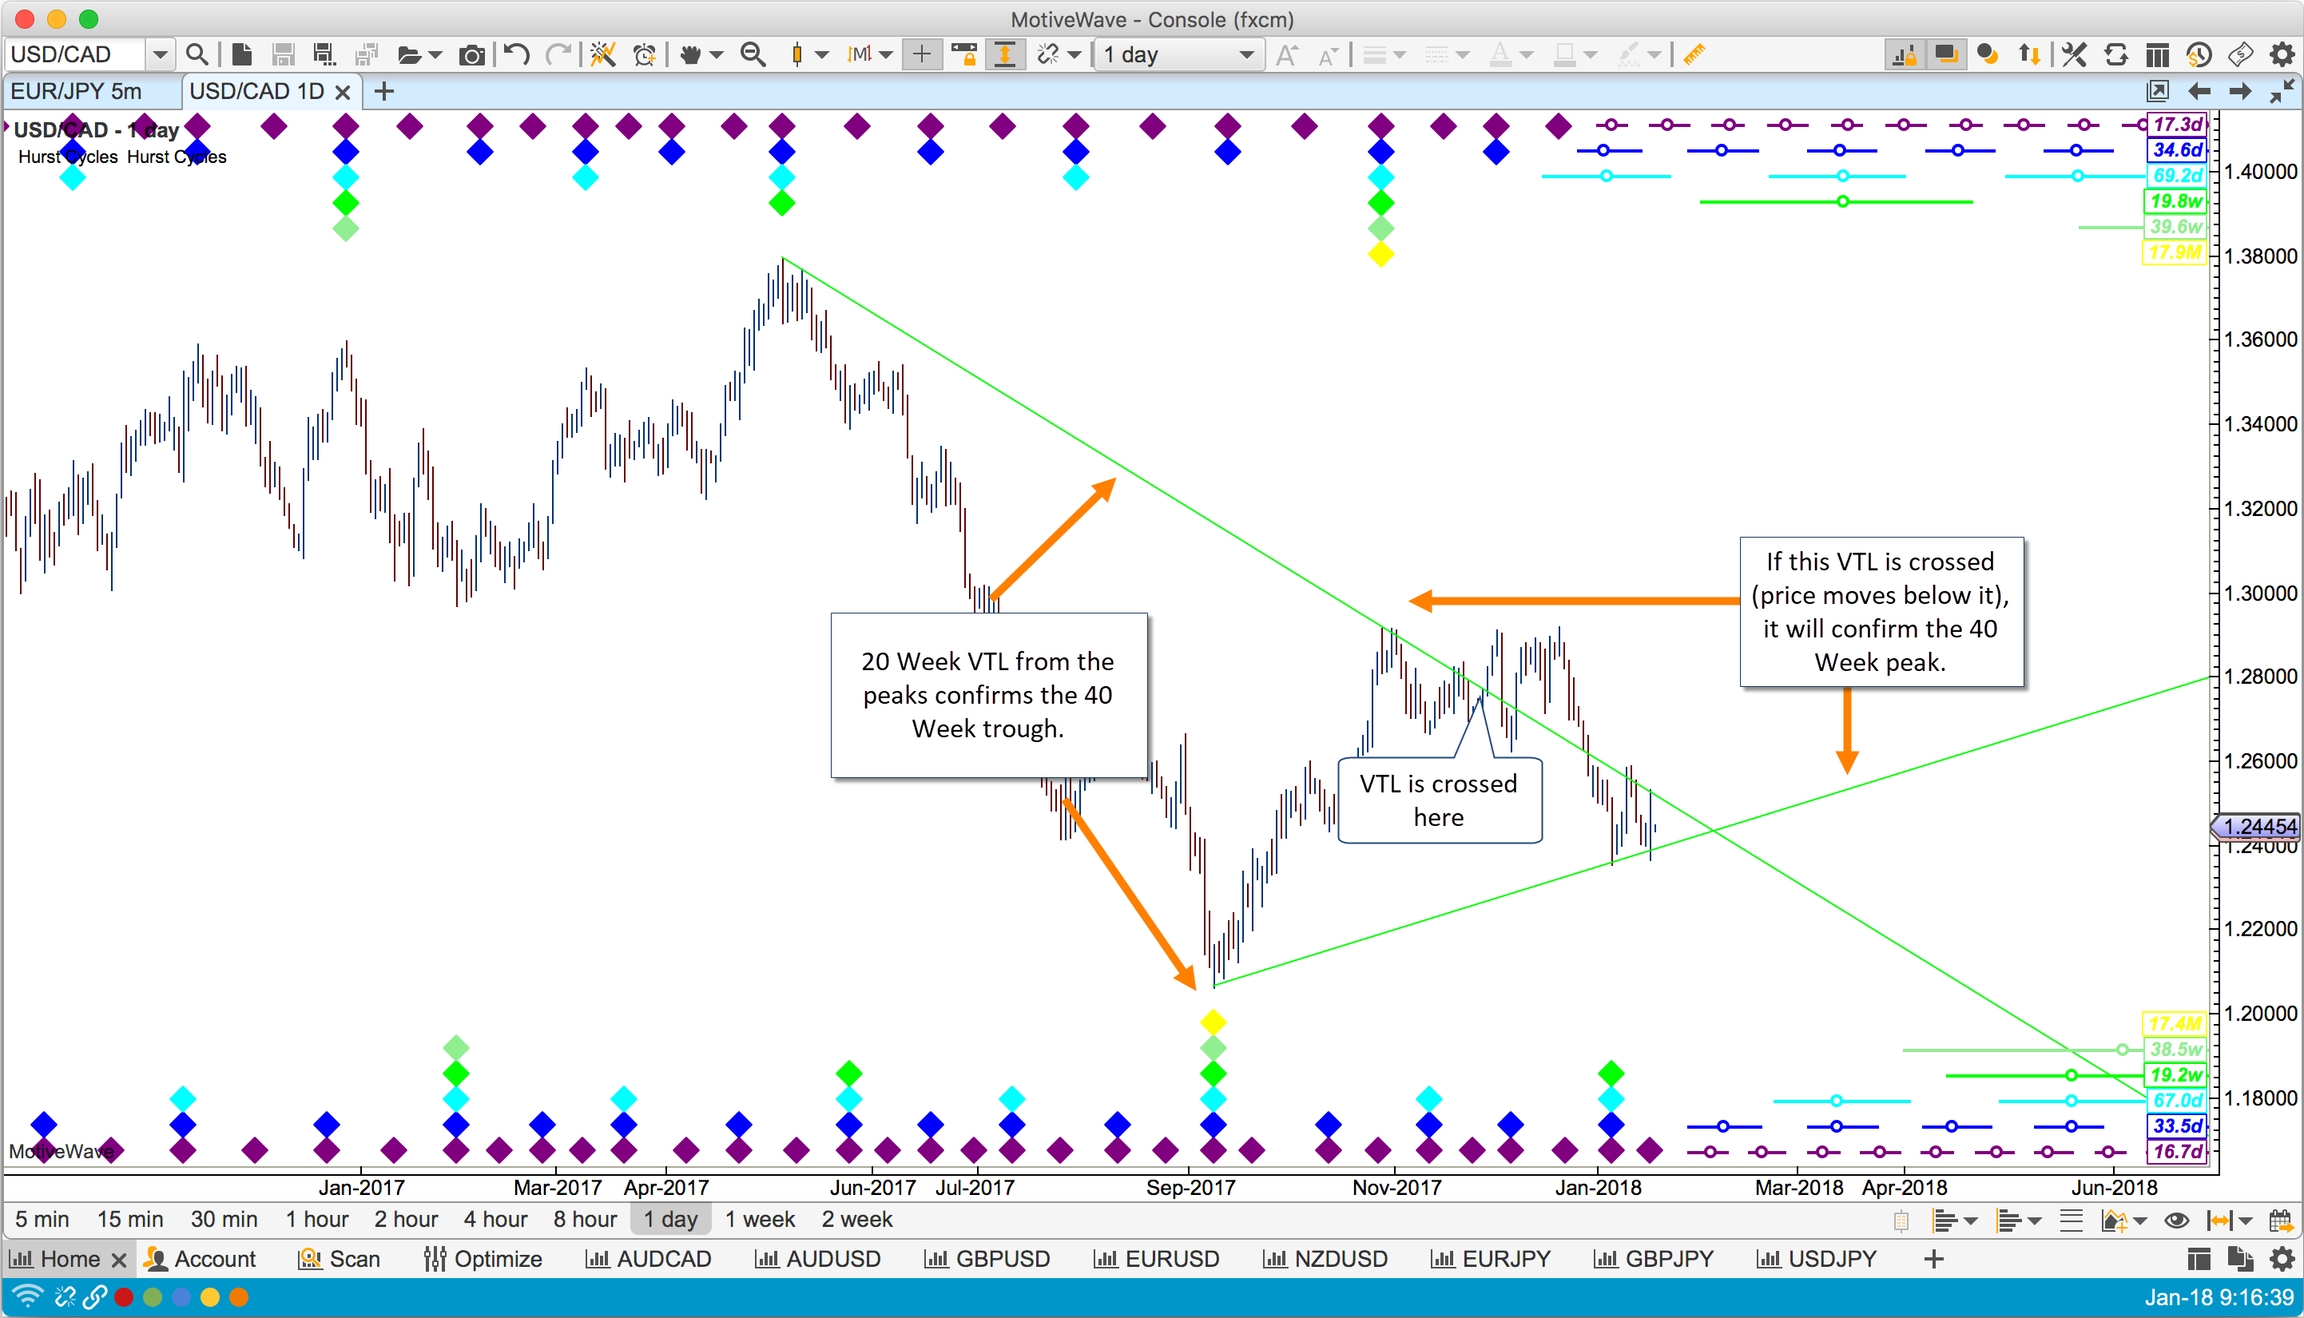
Valid Trend Lines (VTLs)
Valid Trend Lines (VTLs) are a very useful tool for confirming price peaks or troughs in your cyclic analysis. VTLs connecting price troughs will confirm price peaks when they are crossed and conversely VTLs connecting price peaks will confirm troughs when they are crossed.
The following example shows the confirmation of a 40 week price trough using the 20 week VTL for the price peaks. If the price crosses the 20 week VTL of the price troughs, it will confirm a price peak for the 40 week cycle.
Last updated