
Drawing Figures
The draw package (com.motivewave.platform.sdk.draw) contains classes for drawing figures (markers, lines etc) as part of the study. Additional classes will likely be added to this package as the SDK evolves.
All figures have one or more Coordinate values (see common package) that are used to specify the location of the figure. These coordinates are composed of a ‘real’ time and value that are translated to plot (x,y) points before they are drawn.
The following methods are available on the Study class for working with figures:
clearFigures() – clears all figures from the study
addFigure(Figure f) - adds a figure to the study
removeFigure(Figure f) – removes an existing figure
getFigures() – gets all of the figures added to the study
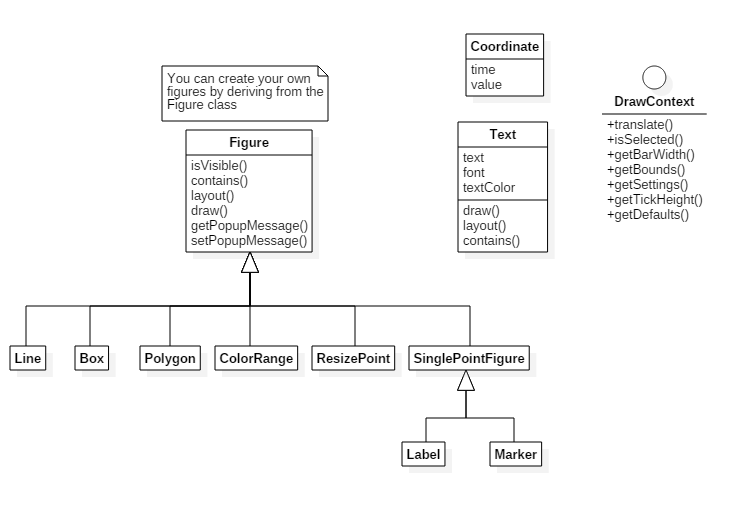
Figure Class
The Figure class is the base class for all figures that may be drawn as part of the study. You may derive from the class to create a custom figure to display as part of the study. This class consists of the following methods:
isVisible(DrawContext ctx) – returns true if this figure is currently visible in the given draw context. This is used by the study framework to improve performance by only working with figures that are currently visible.
contains(double x, double y, DrawContext ctx) – returns true if the figure contains the given (x,y) coordinates. This is used by the study framework to determine if the mouse pointer is currently above the study (and is selectable).
layout(DrawContext ctx) – This method is used to prepare the figure to be drawn. Typically coordinates are translated to plot values (x,y pixel locations) and any intermediate draw figures are created.
draw(Graphics2D gc, DrawContext ctx) – This method draws the figure on the plot.
getPopupMessage(double x, double y, DrawContext ctx) – Gets a popup message to display when the user hovers above the figure. The (x,y) parameters are the coordinates of the mouse on the chart.
setPopMessage(String msg) – Sets the message to display when the mouse is hovering over the figure. If this method is called there is no need to override the getPopupMessage(…) method above.
get/setBounds() – Use these methods to define the bounding rectangle for the figure. By default the contains(…) method will use this to test if the figure contains the given (x,y) parameters.
Box
Use this class to draw a rectangular box with an optional fill color.
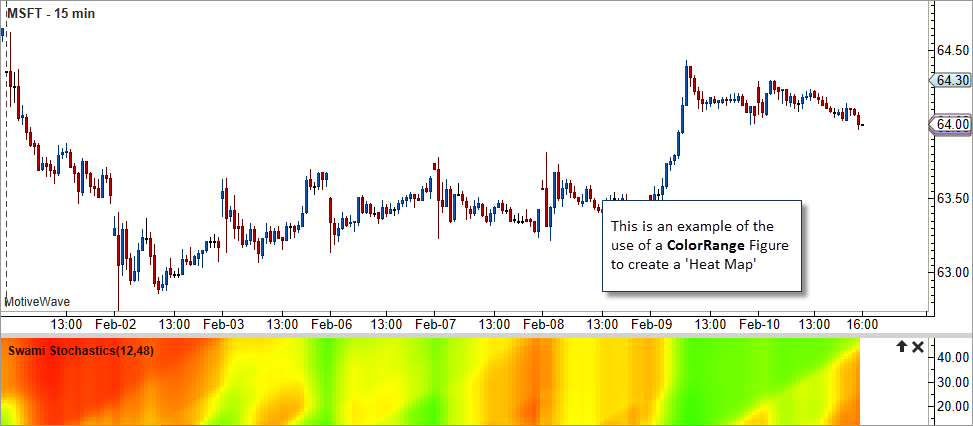
ColorRange Class
This class is convenient for creating ‘Heat Map’ studies. A good example of this is the Swami Stochastics study. Each ColorRange object is essentially a bar that has a series of colors regions defined for a range of values. The following screen shot illustrates what this looks like:
Line Class
The Line class is useful for drawing trend lines or vertical/horizontal lines. There are several convenience options in this class for extending the line, setting the color and line style. You can even have the line draw a different color above and below a given value.
Polygon
Draws a shape with 3 or more points.
ResizePoint
This is a special type of figure that enables users to interact with a study using the mouse. Users can drag a resize point to a specific location. The study will receive the following resize events:
onBeginResize(ResizePoint rp, DrawContext ctx) – This is called when the user begins a drag operation on the resize point
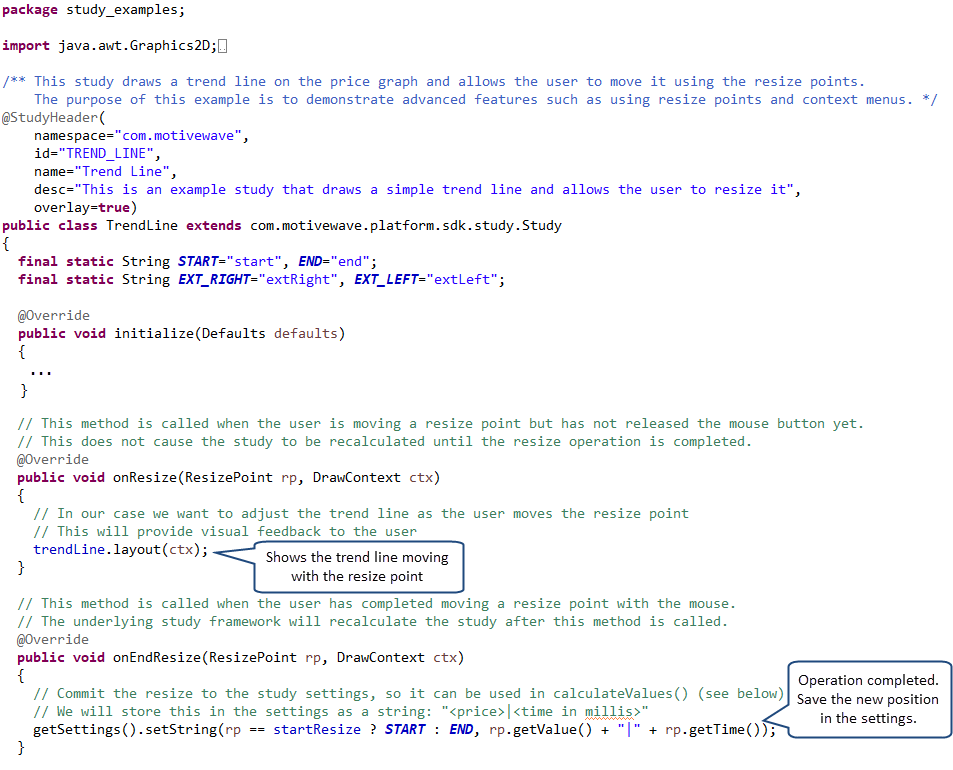
onResize(ResizePoint rp, DrawContext ctx) – This is called as the user drags the resize point. It gives the study an opportunity to provide visual feedback as the user moves the mouse.
onEndResize(ResizePoint rp, DrawContext ctx) – This is called when the drag operation is completed. Override this method to store changes in the settings. The study will be recalculated after this method is called.
The follow excerpt from the TrendLine example study (see Study Examples project) shows an example of using the onResize() and onEndResize() methods:
Resize Types
There are 3 types of resize points supported to constrain how they can be adjusted by the user. These types are defined in the enumeration ResizeType (found in the Enums interface):
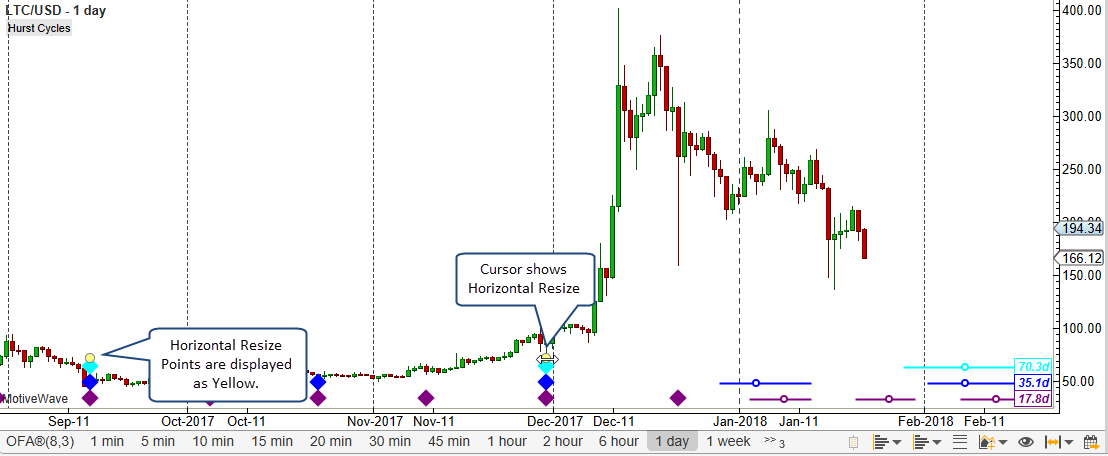
Horizontal – This type of resize point can only be moved left or right. Its vertical position will remain constant. By default, these resize points will be colored yellow.
Vertical – Only up and down movement is allowed. Its horizontal (x) position will remain constant . By default, these resize points will be colored yellow.
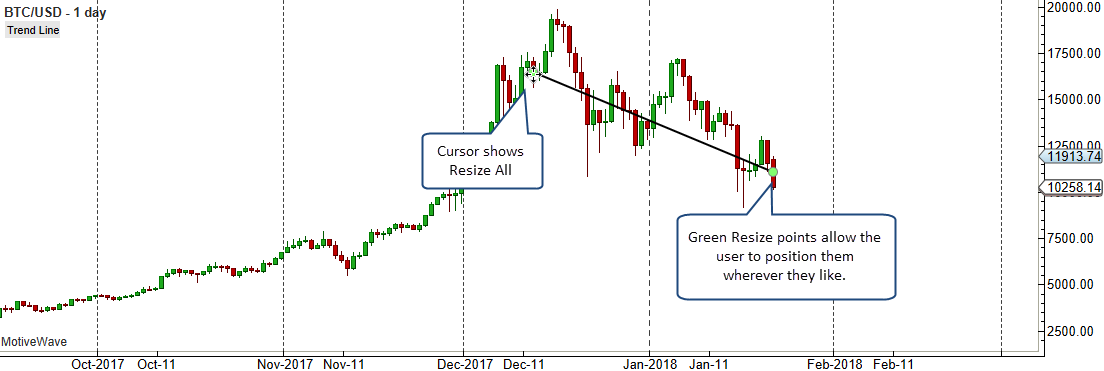
All – Unrestricted. The user can move these types of points anywhere on the screen. By default these types of resize points will be colored green.
The screen shot below shows an example of using resize points that have a type of ‘All’. This is from the example TrendLine study:
The screen shot below illustrates the use of a ‘Horizontal’ resize point to position the cycles in the Hurst Cycles study:
Absolute Positioning
The location of a resize point can be relative or absolute. If a resize point is absolute (see ‘absolute’ property on the ResizePoint class) then its position is defined by a specific time and value (usually price). If relative positioning is used then the resize point is specified using the (x,y) screen coordinates on the chart.
SinglePointFigure
A SinglePointFigure is a special type of Figure that defines figures that are located on the chart by a single point (coordinate). For convenience, multiple figures that are located at the same coordinate may be may be “stacked” above or below each other to improve readability.
This class currently has two subclasses:
Marker
Label
Marker Class
The Marker class makes it convenient to highlight points of interest on the plot. Often this class is used in conjunction with signals. There are several different types of markers (triangle, arrow, circle etc). These types are defined in the enumeration MarkerType (found in the Enums interface).
Label Class
This class makes it easy to draw text labels at specific points on the study.
Last updated