
Introduction
Welcome to the MotiveWave™ Software Development Kit (SDK)! If you are reading this document then you are interested in developing a custom study and/or strategy for use within MotiveWave™.
Knowledge of the Java™ programming language is necessary for you to implement your studies/strategies. If you are unfamiliar with this language, it is recommended that you consult a book or take a basic course on Java programming.
All of the studies and strategies that are built into MotiveWave™ were programmed using the SDK. The source code for these are freely available and may be used as examples or starting points.
Before you begin, it is important to understand studies and strategies and the difference between them.
What is a Study?
A study uses historical price and/or volume data to display new information to the user to assist them in making buying or selling decisions. There are two types of studies:
Overlays
Study Plots
It is also possible to create studies that contain multiple plots and overlays.
Overlays
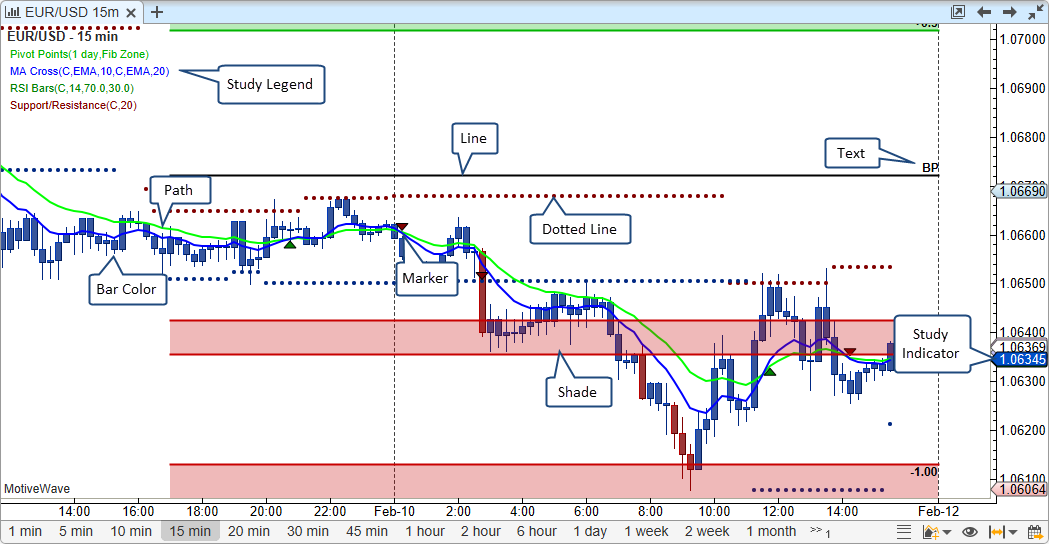
Overlays display information that is drawn on top of an existing plot (most typically the price plot). What is actually displayed depends on the study itself. Some examples of what a study may display include:
Paths – A path is a series of lines that connects data points. Examples of this include a moving average or price bands.
Markers – Markers may be used to indicate points of interest (such as buy, sell or stop loss locations). Markers come in many forms: arrows, circles, triangles, letters, numbers etc
Shades – Area of a plot may be shaded to indicate zones of interest
Lines – May include trend lines, support or resistance areas
Paint Bars – Price or volume bars may be displayed using specific colors
Text – Descriptive text may be used to explain elements of the study
Figures – any type of figure or drawing may be drawn on a plot as part of the overlay.
Indicators – Indicators may be added to the vertical axis to show the current value of a study.
The following screen shot illustrates an example of some of the elements that may be part of an overlay:
Study Plots
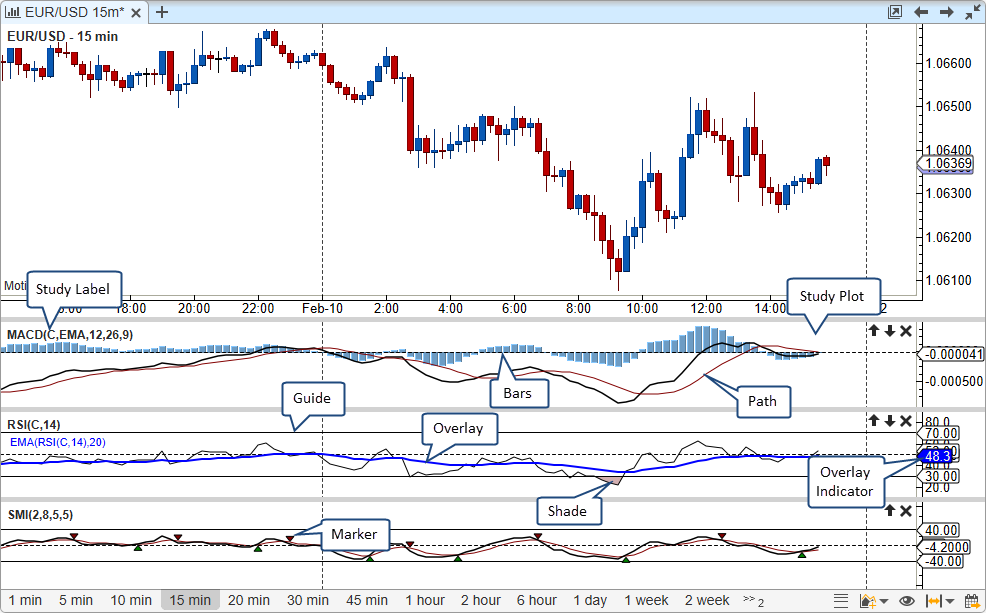
Study plots display information drawn in a plot that is separate from the price plot. The typical reason why this is displayed in a separate plot is because the values generated are independent (or outside) of the price range.
Overlays may be added to a study plot to display additional information (such as a moving average).
The following screen shot shows some examples of study plots:
What is a Strategy?
A strategy is a special type of study that may be used to automate or partially automate trading. In addition to displaying the study information, a Control Box is made available that allows the user to activate/deactivate a strategy and view important runtime information. The following screen shot shows an example of the Moving Average Cross Strategy:
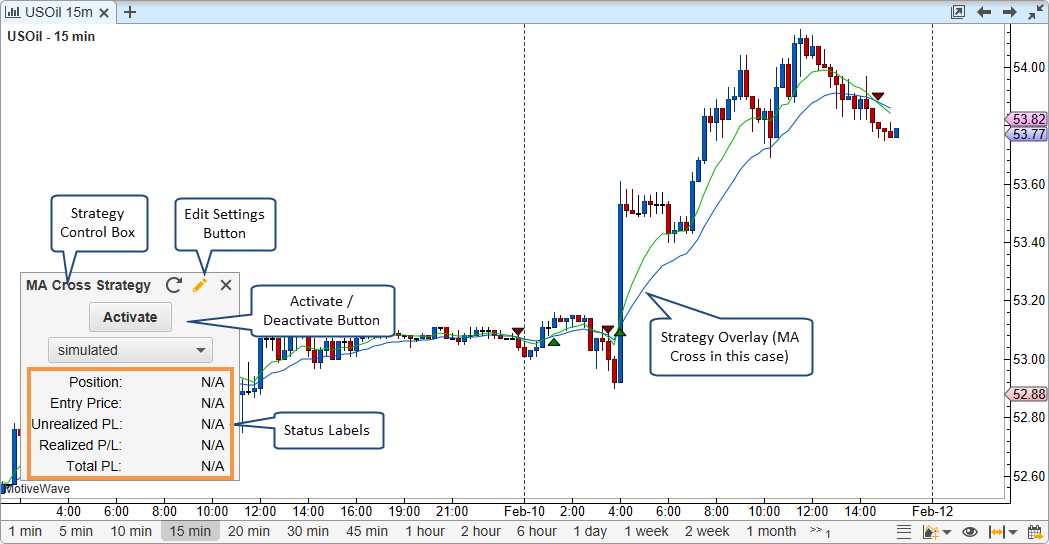
MotiveWave™ supports two modes for strategies:
Automatic – Once the user activates the strategy, it will automatically buy and sell based on the internal logic.
Manual – In this mode, the user tells the strategy when it is OK to enter.
Distribution
Studies (and strategies) may be distributed to users by packaging them together in Jar (Java™ Archive) files. If you feel the need to protect the contents of these packages you may use obfuscators (such as ProGuard) to prevent reverse engineering of the binary code.
Access Control
You can control the access to a set of studies/strategies by using the ‘secured’ attribute in the Study Header. Setting this attribute to ‘true’ will ensure that only users that you have given access will be allowed to load and execute studies and strategies in the given namespace.
Access control requires an account to be setup with MotiveWave™. If you would like to utilize this feature, send an email requesting that an account be created to: [email protected].
Last updated