
Overlay Example
package study_examples;
import com.motivewave.platform.sdk.common.*;
import com.motivewave.platform.sdk.common.desc.*;
import com.motivewave.platform.sdk.study.*;
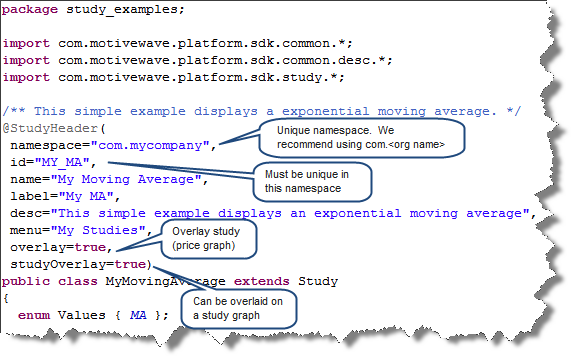
/** This simple example displays an exponential moving average. */
@StudyHeader(
namespace="com.mycompany",
id="MY_MA",
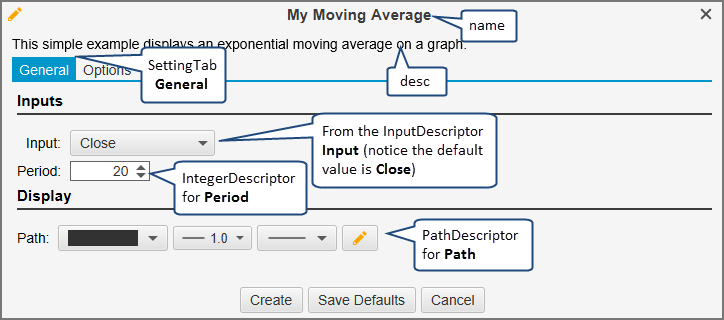
name="My Moving Average",
label="My MA",
desc="This simple example displays an exponential moving average",
menu="My Studies",
overlay=true,
studyOverlay=true)
public class MyMovingAverage extends Study
{
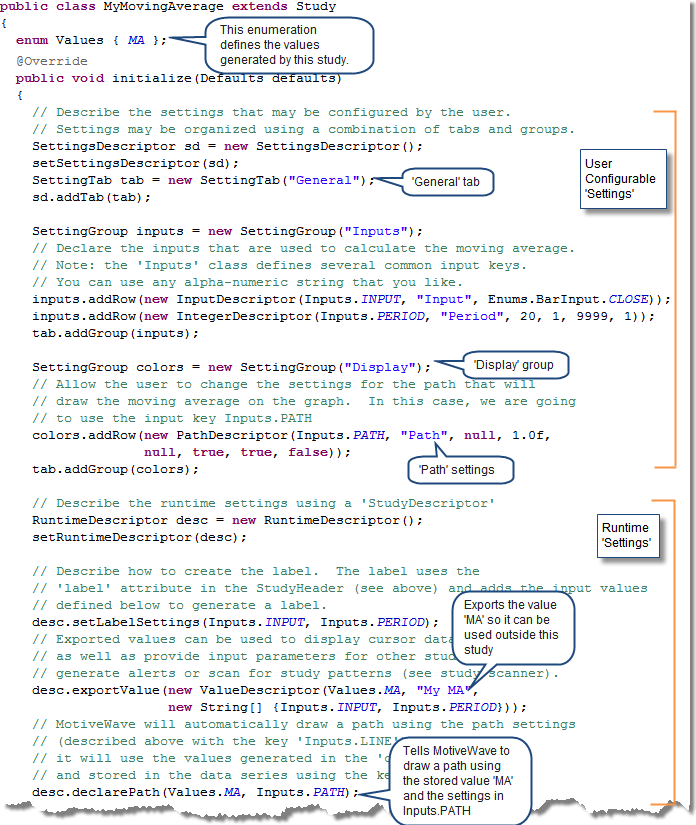
enum Values { MA };
/** This method initializes the study by doing the following:
1. Define Settings (Design Time Information)
2. Define Runtime Information (Label, Path and Exported Value) */
@Override
public void initialize(Defaults defaults)
{
// Describe the settings that may be configured by the user.
// Settings may be organized using a combination of tabs and groups.
SettingsDescriptor sd = new SettingsDescriptor();
setSettingsDescriptor(sd);
SettingTab tab = new SettingTab("General");
sd.addTab(tab);
SettingGroup inputs = new SettingGroup("Inputs");
// Declare the inputs that are used to calculate the moving average.
// Note: the 'Inputs' class defines several common input keys.
// You can use any alpha-numeric string that you like.
inputs.addRow(new InputDescriptor(Inputs.INPUT, "Input", Enums.BarInput.CLOSE));
inputs.addRow(new IntegerDescriptor(Inputs.PERIOD, "Period", 20, 1, 9999, 1));
tab.addGroup(inputs);
SettingGroup colors = new SettingGroup("Display");
// Allow the user to change the settings for the path that will
// draw the moving average on the plot. In this case, we are going
// to use the input key Inputs.PATH
colors.addRow(new PathDescriptor(Inputs.PATH, "Path", null, 1.0f, null, true, true, false));
tab.addGroup(colors);
// Describe the runtime settings using a 'StudyDescriptor'
RuntimeDescriptor desc = new RuntimeDescriptor();
setRuntimeDescriptor(desc);
// Describe how to create the label. The label uses the
// 'label' attribute in the StudyHeader (see above) and adds the input values
// defined below to generate a label.
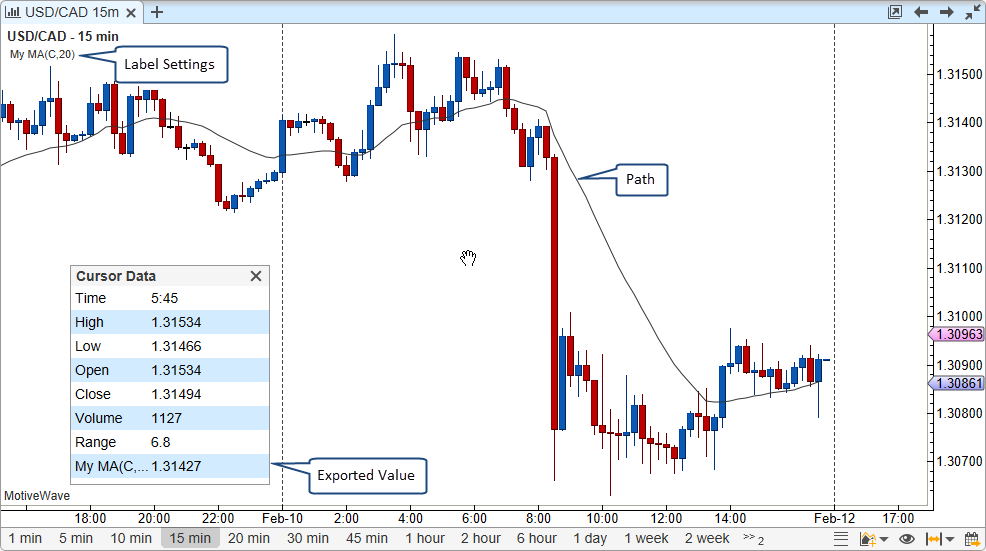
desc.setLabelSettings(Inputs.INPUT, Inputs.PERIOD);
// Exported values can be used to display cursor data
// as well as provide input parameters for other studies,
// generate alerts or scan for study patterns (see study scanner).
desc.exportValue(new ValueDescriptor(Values.MA, "My MA", new String[] {Inputs.INPUT, Inputs.PERIOD}));
// MotiveWave will automatically draw a path using the path settings
// (described above with the key 'Inputs.LINE') In this case
// it will use the values generated in the 'calculate' method
// and stored in the data series using the key 'Values.MA'
desc.declarePath(Values.MA, Inputs.PATH);
}
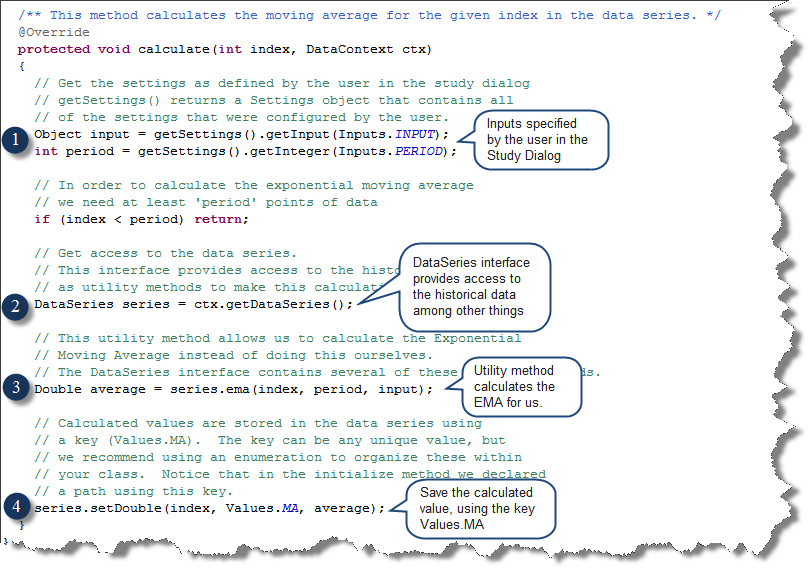
/** This method calculates the moving average for the given index in the data series. */
@Override
protected void calculate(int index, DataContext ctx)
{
// Get the settings as defined by the user in the study dialog
// getSettings() returns a Settings object that contains all
// of the settings that were configured by the user.
Object input = getSettings().getInput(Inputs.INPUT);
int period = getSettings().getInteger(Inputs.PERIOD);
// In order to calculate the exponential moving average
// we need at least 'period' points of data
if (index < period) return;
// Get access to the data series.
// This interface provides access to the historical data as well
// as utility methods to make this calculation easier.
DataSeries series = ctx.getDataSeries();
// This utility method allows us to calculate the Exponential
// Moving Average instead of doing this ourselves.
// The DataSeries interface contains several of these types of methods.
Double average = series.ema(index, period, input);
// Calculated values are stored in the data series using
// a key (Values.MA). The key can be any unique value, but
// we recommend using an enumeration to organize these within
// your class. Notice that in the initialize method we declared
// a path using this key.
series.setDouble(index, Values.MA, average);
}
}StudyHeader Annotation (@StudyHeader)
initialize method
Design Time Information
Run Time Information
calculate method
Last updated