Signals
All studies and strategies may generate signals. Signals are events that occur at points of interest in a study. Often signals are used as indicators of buy or sell points.
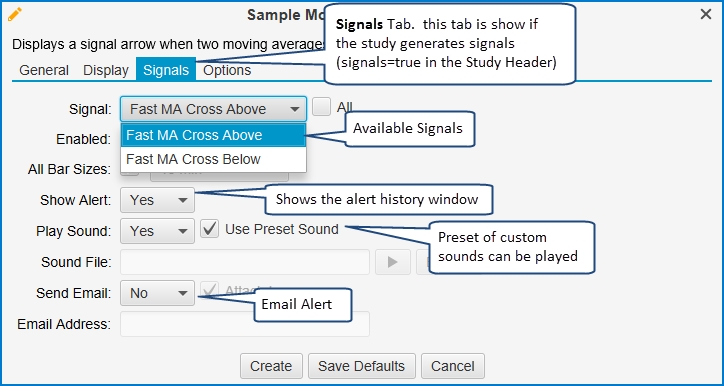
The end user may configure the study to create alerts from the signals generated by the study. To provide a high level of flexibility, the user may choose which signals they want alerts for and how the alerts behave.
The Sample Moving Average Cross (see sample project) is one example of a study that generates signals. This study generates two signals:
Fast MA Crossed Above – This occurs when the Fast MA (shorter period) crosses above the Slow MA
Fast MA Crossed Below – This occurs when the Fast MA crosses below the Slow MA
By default, these signals do not do anything other than show an up or down marker where the crosses occur on the plot. The user can configure alerts for these signals from the ‘Signals’ tab of the Study Dialog.

The following steps are required to generate signals for a study:
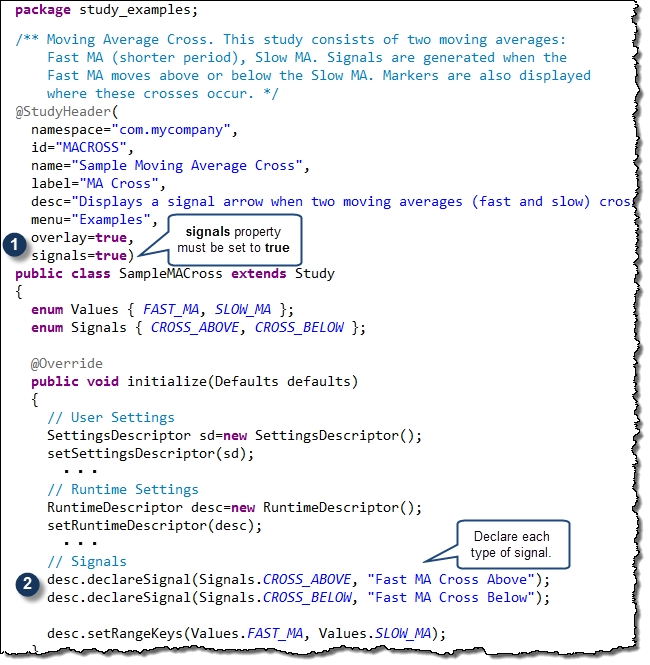
signal tag – set the ‘signal’ property in the StudyHeader to true
declare signals – There are two signals, cross above and cross below.
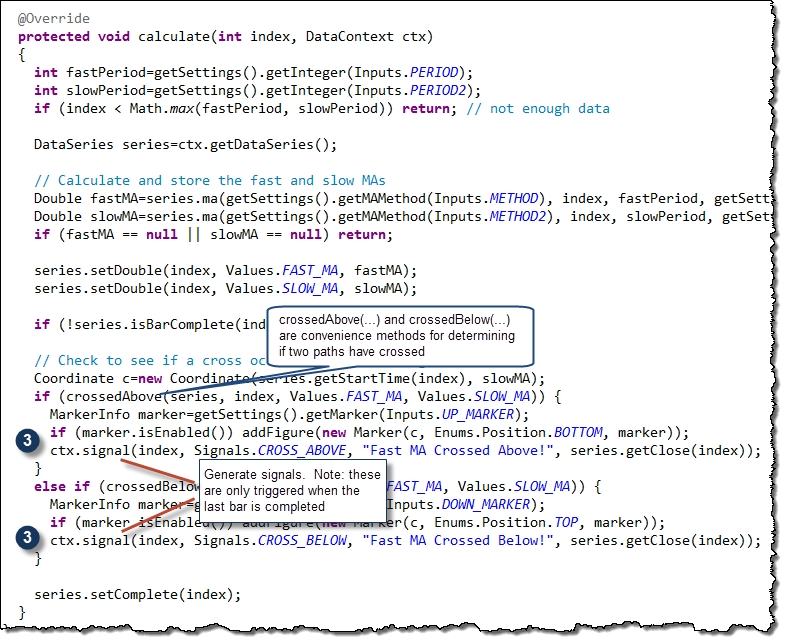
call ‘signal’ method – this generates the signals.


Last updated