Study Plot Example

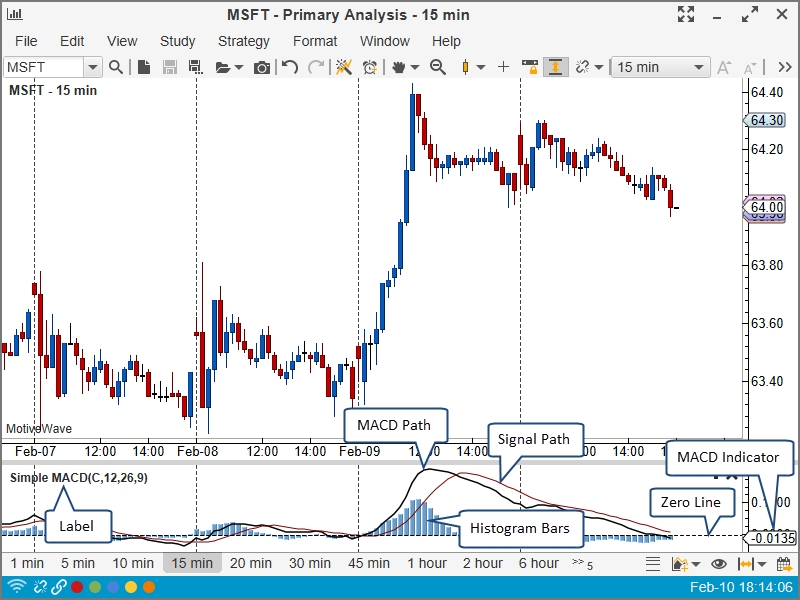
In this example we are going to create a Study Plot based on a simple MACD. Note: if you would like a more comprehensive MACD example, you can look at the source code for the MACD indicator that exists within MotiveWave™.

MACD stands for ‘Moving Average Convergence/Divergence’ and was written by Gerald Appel in the 1970s. If you would like more information on this study go to: http://en.wikipedia.org/wiki/MACD.

Here is a screen shot of what this study looks like:
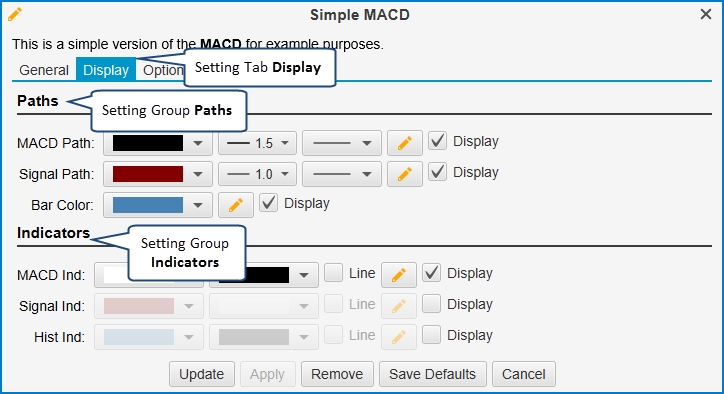
Here is a screen shot of the Study Dialog that the user will use to configure the Simple MACD:
Let us start by looking at the source code for this study:

package study_examples;

import com.motivewave.platform.sdk.common.*;
import com.motivewave.platform.sdk.common.desc.*;
import com.motivewave.platform.sdk.study.*;

/** Simple MACD example.  This example shows how to create a Study Plot
    that is based on the MACD study.  For simplicity code from the 
    MotiveWave MACD study has been removed or altered. */
@StudyHeader(
    namespace="com.mycompany", 
    id="SimpleMACD", 
    name="Simple MACD",
    desc="This is a simple version of the <b>MACD</b> for example purposes.",
    menu="My Studies",
    overlay=false)
public class SimpleMACD extends Study 
{
  // This enumeration defines the variables that we are going to store in the 
  // Data Series
	enum Values { MACD, SIGNAL, HIST };
  final static String HIST_IND = "histInd"; // Histogram Parameter 
	
  /** This method initializes the settings and defines the runtime settings. */
  @Override
  public void initialize(Defaults defaults)
  {
    // Define the settings for this study
    // We are creating 2 tabs: 'General' and 'Display'
    SettingsDescriptor settings = new SettingsDescriptor();
    setSettingsDescriptor(settings);
    SettingTab tab = new SettingTab("General");
    settings.addTab(tab);

    // Define the 'Inputs'
    SettingGroup inputs = new SettingGroup("Inputs");
    inputs.addRow(new InputDescriptor(Inputs.INPUT, "Input", Enums.BarInput.CLOSE));
    inputs.addRow(new IntegerDescriptor(Inputs.PERIOD, "Period 1", 12, 1, 9999, 1));
    inputs.addRow(new IntegerDescriptor(Inputs.PERIOD2, "Period 2", 26, 1, 9999, 1));
    inputs.addRow(new IntegerDescriptor(Inputs.SIGNAL_PERIOD, "Signal Period", 9, 1, 9999, 1));
    tab.addGroup(inputs);
    
    tab = new SettingTab("Display");
    settings.addTab(tab);
    // Allow the user to configure the settings for the paths and the histogram
    SettingGroup paths = new SettingGroup("Paths");
    tab.addGroup(paths);
    paths.addRow(new PathDescriptor(Inputs.PATH, "MACD Path", 
                 defaults.getLineColor(), 1.5f, null, true, false, true));
    paths.addRow(new PathDescriptor(Inputs.SIGNAL_PATH, "Signal Path", 
                 defaults.getRed(), 1.0f, null, true, false, true));
    paths.addRow(new BarDescriptor(Inputs.BAR, "Bar Color", defaults.getBarColor(), true, true));
    // Allow the user to display and configure indicators on the vertical axis
    SettingGroup indicators = new SettingGroup("Indicators");
    tab.addGroup(indicators);
    indicators.addRow(new IndicatorDescriptor(Inputs.IND, "MACD Ind", 
                      null, null, false, true, true));
    indicators.addRow(new IndicatorDescriptor(Inputs.SIGNAL_IND, "Signal Ind", 
                      defaults.getRed(), null, false, false, true));
    indicators.addRow(new IndicatorDescriptor(HIST_IND, "Hist Ind",
                      defaults.getBarColor(), null, false, false, true));

    RuntimeDescriptor desc = new RuntimeDescriptor();
    setRuntimeDescriptor(desc);
    desc.setLabelSettings(Inputs.INPUT, Inputs.PERIOD, Inputs.PERIOD2, Inputs.SIGNAL_PERIOD);
    // We are exporting 3 values: MACD, SIGNAL and HIST (histogram)
    desc.exportValue(new ValueDescriptor(Values.MACD, "MACD", new String[] 
                     {Inputs.INPUT, Inputs.PERIOD, Inputs.PERIOD2}));
    desc.exportValue(new ValueDescriptor(Values.SIGNAL, "MACD Signal",
                     new String[] {Inputs.SIGNAL_PERIOD}));
    desc.exportValue(new ValueDescriptor(Values.HIST, "MACD Histogram", new String[] 
                     {Inputs.PERIOD, Inputs.PERIOD2, Inputs.SIGNAL_PERIOD}));
    // There are two paths, the MACD path and the Signal path
    desc.declarePath(Values.MACD, Inputs.PATH);
    desc.declarePath(Values.SIGNAL, Inputs.SIGNAL_PATH);
    // Bars displayed as the histogram
    desc.declareBars(Values.HIST, Inputs.BAR);
    // These are the indicators that are displayed in the vertical axis
    desc.declareIndicator(Values.MACD, Inputs.IND);
    desc.declareIndicator(Values.SIGNAL, Inputs.SIGNAL_IND);
    desc.declareIndicator(Values.HIST, HIST_IND);

    // These variables are used to define the range of the vertical axis
    desc.setRangeKeys(Values.MACD, Values.SIGNAL, Values.HIST);
    // Display a 'Zero' line that is dashed.
    desc.addHorizontalLine(new LineInfo(0, null, 1.0f, new float[] {3,3}));
  }

  /** This method calculates the MACD values for the data at the given index. */
  @Override  
  protected void calculate(int index, DataContext ctx)
  {
    int period1 = getSettings().getInteger(Inputs.PERIOD);
    int period2 = getSettings().getInteger(Inputs.PERIOD2);
    int period = Util.max(period1, period2);
    if (index < period) return; // not enough data to compute the MAs

    // MACD is the difference between two moving averages.
    // In our case we are going to use an exponential moving average (EMA)
    Object input = getSettings().getInput(Inputs.INPUT);
    DataSeries series = ctx.getDataSeries();
    Double MA1 = null, MA2 = null;
    
    MA1 = series.ema(index, period1, input);
    MA2 = series.ema(index, period2, input);
    if (MA1 == null || MA2 == null) return;

    // Define the MACD value for this index
    double MACD = MA1 - MA2; 
    series.setDouble(index, Values.MACD, MACD);

    int signalPeriod = getSettings().getInteger(Inputs.SIGNAL_PERIOD);
    if (index < period + signalPeriod) return; // Not enough data yet

    // Calculate moving average of MACD (signal path)
    Double signal = series.sma(index, signalPeriod, Values.MACD);
    series.setDouble(index, Values.SIGNAL, signal);
    if (signal == null) return;

    // Histogram is the difference between the MACD and the signal path
    series.setDouble(index, Values.HIST, MACD - signal);
    series.setComplete(index);
  }  
}

StudyHeader Annotation (@StudyHeader)

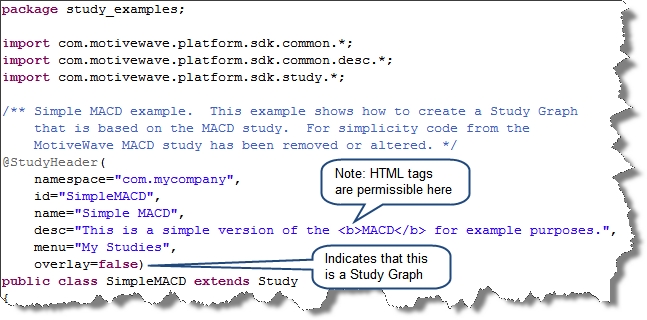
The main difference in the study header from the previous example is the ‘overlay’ tag is set to false. This indicates to MotiveWave™ that this study should be displayed in a separate study plot. You will notice here as well that we have included some HTML markup in the ‘desc’ tag. The description displayed in the Study Dialog supports HTML so you can put any valid HTML tags here (do not include JavaScript, this is not supported).
initialize method

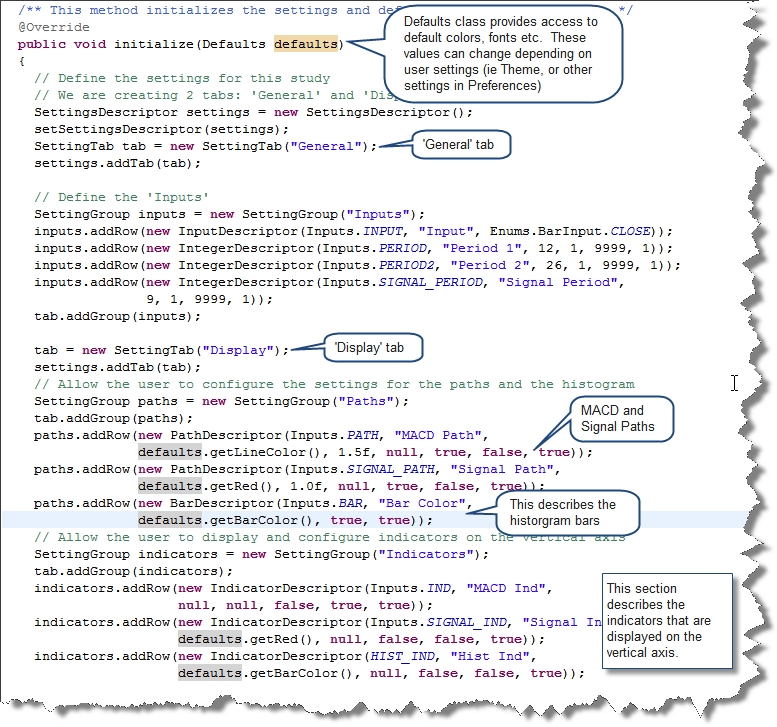
We have defined a bit more in the initialize section from the previous example. To illustrate the usage of tabs, we have created 2 tabs: ‘General’ and ‘Display’. We have also defined the bars for the histogram (see BarDescriptor).

Indicators are displayed on the vertical axis (right side of the screen). By default, we are only going to show the first indicator (MACD), but we will allow the user to show indicators for the current signal value as well as the histogram. For this we will use the IndicatorDescriptor and set the values accordingly. We have organized these into a Setting Group called ‘Indicators’

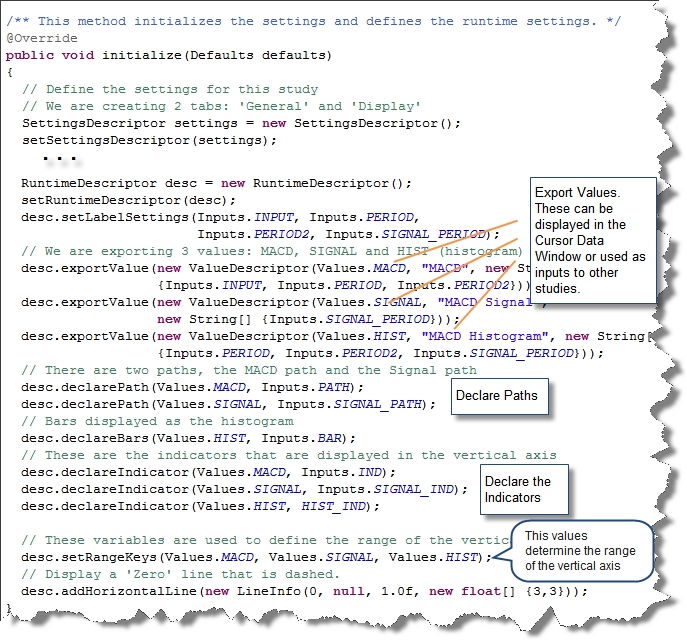
The following screen shot (with markup) shows the part of the initialize method where we are describing the settings for the study:
Next, we need to describe the runtime parameters using the RuntimeDescriptor. For the label, we want to append the input, period, period2 and the signal period.

In this case, we are going to export 3 values: MACD, SIGNAL and HIST.

In order to display the histogram as bars, we use the ‘declareBars’ method on the study descriptor. This will tell MotiveWave™ to show vertical bars using the BarDescriptor identified by Inputs.BAR.
calculate Method

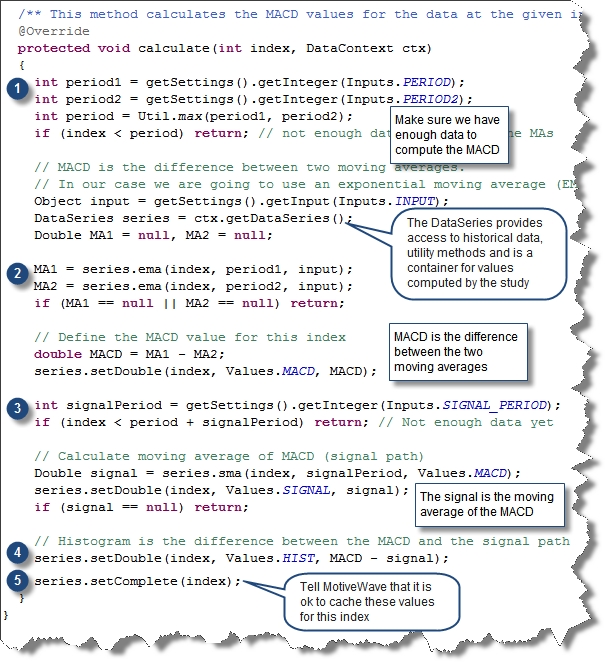
The calculate method is used to compute the values for each historical bar in the data series. In our case, we are going to do the following:

  1. Retrieve User Settings – these are accessed from the getSettings() method.

  2. Compute and Store the MACD – The DataSeries object contains the historical data as well as the utility methods for computing moving averages. The MACD value is stored in the data series at the given index using the key Values.MACD.

  3. Compute and Store the signal – The signal is a moving average of the MACD. Use the data series to compute the moving average with Values.MACD as the key. The signal value is stored in the data series at the given index using the key: Values.SIGNAL.

  4. Compute and store the histogram – The histogram is simply the difference between the MACD and the signal. This is stored in the data series at the given index using the key: Values.HIST.

  5. Mark the index as ‘Complete’ - Finally, indicate that this index is ‘complete’. This allows MotiveWave™ to cache these values (to improve performance).
Last updated