Analyses
MotiveWave™ employs the concept of an Analysis to encapsulate the work that you have done in a chart to analyze price movement. An analysis will contain the following types of information:
Components – any components that you have added to the chart including: trend lines, Elliott Waves, Gann components, Gartley patterns, commentary etc
Studies – Any studies that you have added to the chart
Time/Price Guides – These are guides that you have added to the horizontal or vertical axes.
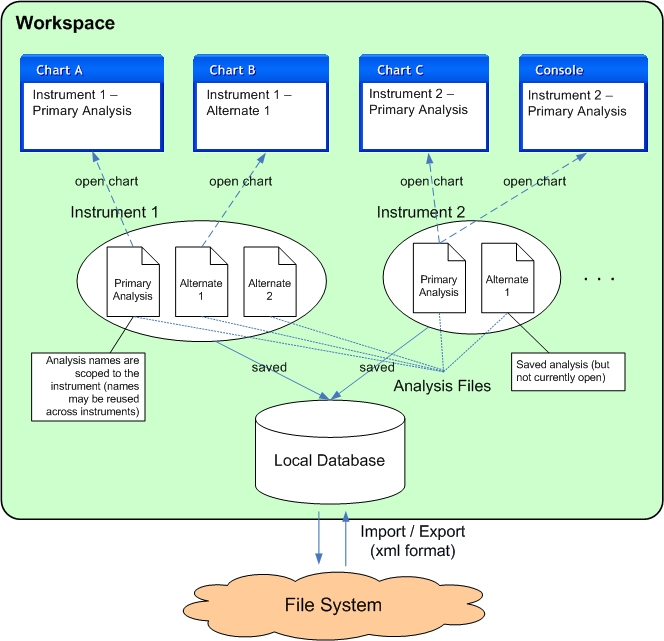
It is important to understand that an analysis is a separate entity from a chart. A chart is a view or an analysis file. This is an important distinction and is fundamental to the underlying design of MotiveWave™. While this concept may seem a little confusing at first, it has numerous advantages:
View in Multiple Time Frames – A single analysis can be viewed at multiple time frames simultaneously. You can have several open charts that reference the same analysis and edit them from each chart.
Alternate Analyses – Each instrument can have any number of analyses. The name of an analysis is scoped to the instrument so it does not have to be unique across symbols.
Saved in Repository – You can save an analysis and load it later after the chart has been closed
Share with other People – Analyses can be exported in XML format and shared with your friends. You can also share analyses using the Analysis Sources feature.
The following diagram illustrates the relationship between charts and analyses. Each instrument may have multiple analyses which are saved in the local database (repository). When you open a chart, you are opening an analysis. MotiveWave™ allows you to open an analysis from more than one chart at the same time. Changes made in either chart are synchronized between the two so you do not have to worry about overwriting you modifications.

Creating a New Analysis
The default analysis for any instrument is called the Primary Analysis. Whenever you open a chart for the first time, it will open the Primary Analysis. The net effect of this behavior is that all changes between the open charts for that instrument will be synchronized between them.
If you do not want these changes to be synchronized, you can create one or more Alternate Analyses. There are several ways to do this; perhaps the most convenient is to use the New Analysis button on the tool bar.

The following dialog will appear when you create a new analysis. Enter a name for the analysis. By default, analyses are named Alternate 1, Alternate 2 etc. You can however choose any name you like for the analysis. A new analysis may be empty (just price bars) or you can base an analysis on an existing analysis by choosing one from the Based On drop down. Check the "Untitled" button to open an untitled analysis.

Once you have created the new analysis, the chart will display a set of tabs at the top where the active tab is named with the new analysis.

Open Existing Analysis
If you want to quickly open an analysis, just click on the small black triangle next to the open folder icon on the tool bar.

Alternatively, choose Chart > Analysis > Manage Analyses from the top menu bar.

Manage Analyses
The Manage Analyses dialog allows you to open, export, rename, delete or create new analyses for the given instrument. This dialog can be access from the top menu bar: Chart > Analysis > Manage Analyses:

Import/Export Analyses
Import and export are very valuable tools for sharing your analysis with another MotiveWave™ user.
When you export an analysis file, the file will contain all of the information related to your analysis as well as information about the instrument. The exported file will be in JSON format and will have an extension of .mwml (MotiveWave Markup Language).
Choose Chart > Analysis > Export Analysis from the top menu bar to open the Export Analysis dialog. By default the analysis file will be saved on your computer desktop in the form <Symbol> – <Analysis Name>.mwml. You may change this name and location if you like. Click on the Save button to export the analysis to the selected file.

Similarly, to import an analysis file, choose Chart > Analysis > Import Analysis from the top menu bar to display the Import Analysis dialog. Locate the analysis file, select it and press the Open button. If the chart you are currently using has the same instrument as the imported analysis file, it will be opened in another analysis tab. If the instrument does not match the chart, a message dialog will be displayed indicating that the import was successful and how to open the imported file.

Last updated