
Strategy Back Testing
Professional / Ultimate
Strategy back testing is a special type of historical testing that allows you to determine how a strategy would have performed if it had actually been run during past historical time periods and market conditions. It does not guarantee how your strategy will perform in future market conditions, but will allow you to identify any potential issues or vulnerabilities against past market conditions. This allows you to ‘test’ and tweak your strategy without having to place actual trades. See the Wikipedia page on strategy back testing for more information.
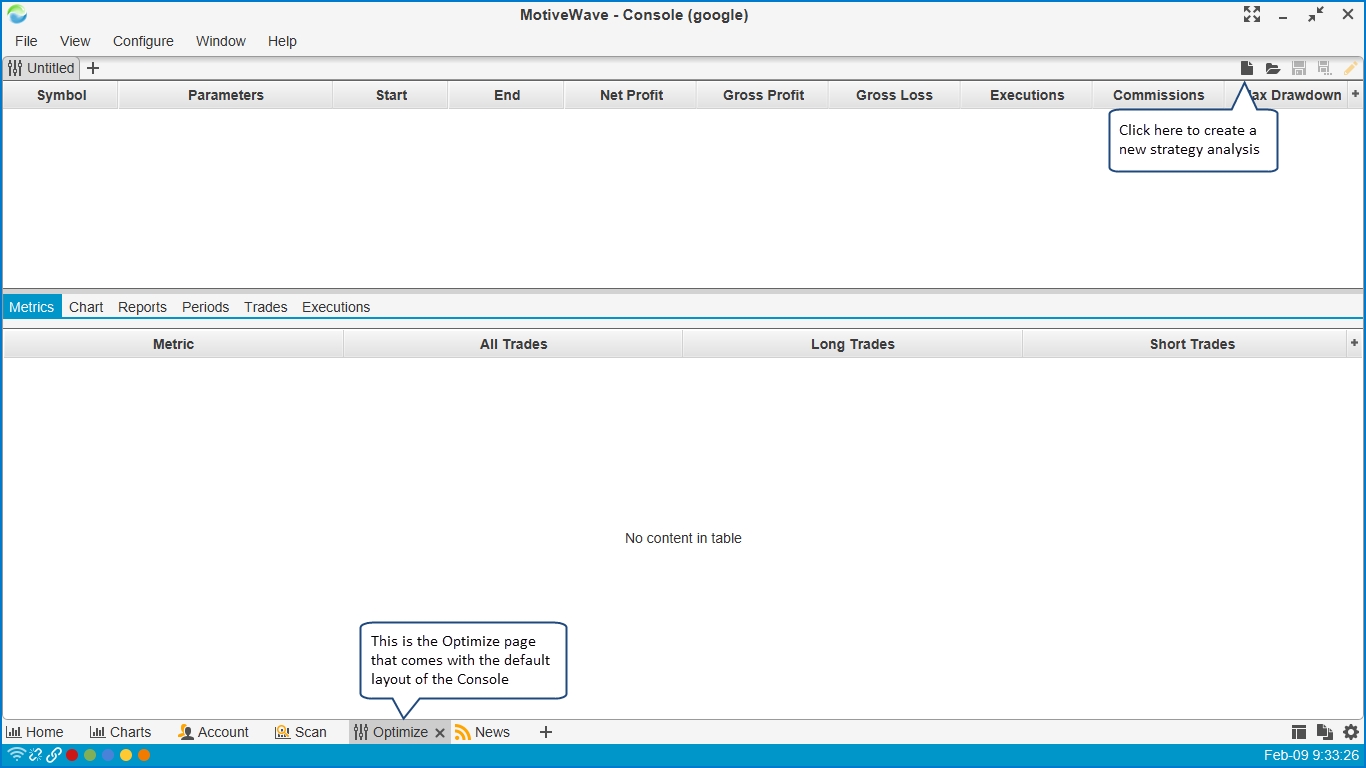
MotiveWave™ has highly advanced strategy back testing options through our Strategy Optimizer. The default layout of the MotiveWave™ Console has a page called Optimize (see bottom of the console window). Click this tab to show the strategy optimizer page.
Creating a Strategy Analysis
From the Optimize tab of the Console, click on the New Analysis button (see screen shot above). This will launch a wizard that will walk you through the process of creating an analysis of your selected strategy.
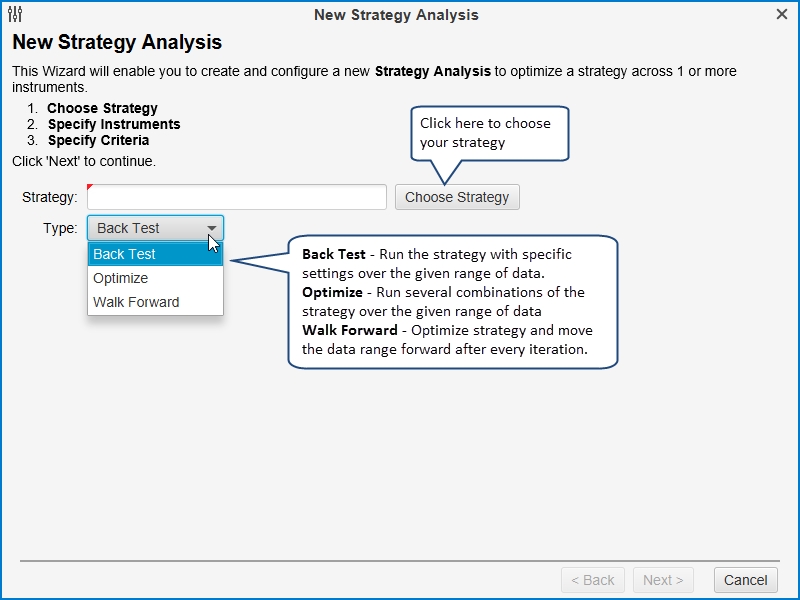
MotiveWave supports 3 types of Strategy Analysis:
Back Test - This option enables you to execute your strategy with specific settings over a given set of instruments and a specific bar size/time frame. This can be useful to determine how your strategy may have performed with past data and specific settings.
Optimize - The profitability of a strategy will vary depending on how it is configured. This option will enable you to specify a range of settings for the strategy and test many different combinations of these settings to determine which combination is "optimal".
Walk Forward - Sometimes knowing the optimal settings for a specific range of data is not enough. Just because a strategy performed well for a specific bar size and time frame does not guarantee that it will continue to perform well in the future. Walk forward testing helps to mitigate this problem by stepping forward in time after every iteration of a time frame.
The following screen shot shows the first panel of the New Strategy Analysis wizard. From here you can choose your strategy and specify the type of analysis you wish to perform.
Strategy Settings Panel
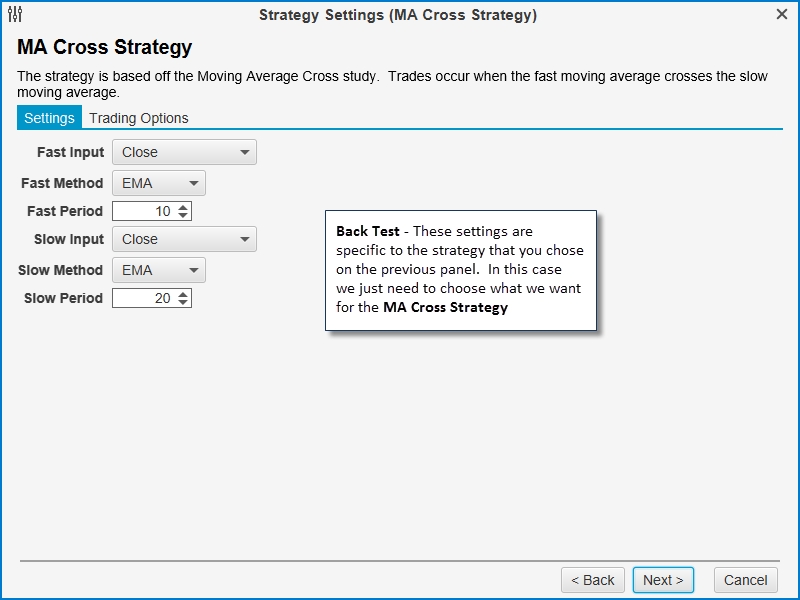
Once you have chosen the strategy and analysis type, click on the Next button to specify the settings for the strategy. If you chose Back Test, then you will just need to specify the specific settings for this strategy (see below). In this case we have chosen the "MA Cross Strategy":
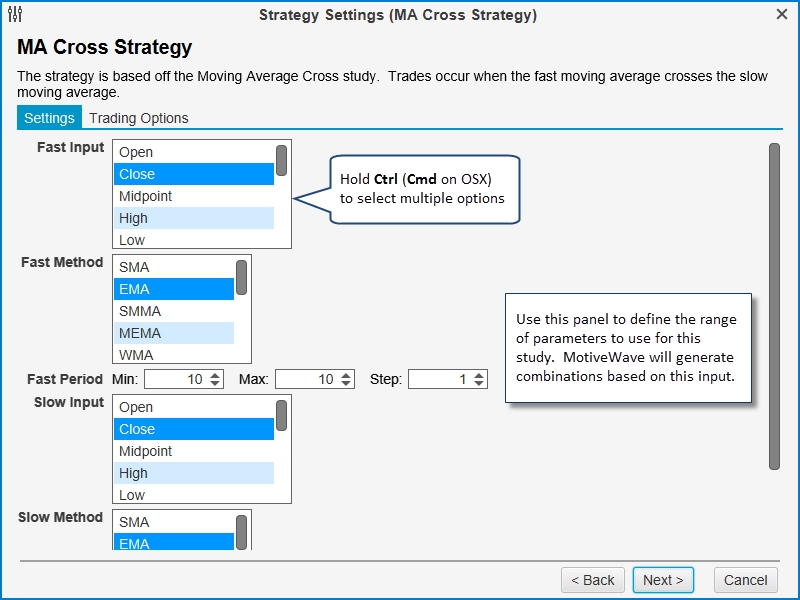
Alternatively, if you chose Optimize or Walk Forward as the type, the next page of the wizard will look more like the following screen shot. This panel will enable you to specify the range of possibilities for the configuration of the strategy. MotiveWave™ will build combinations of the strategy settings based on this input.
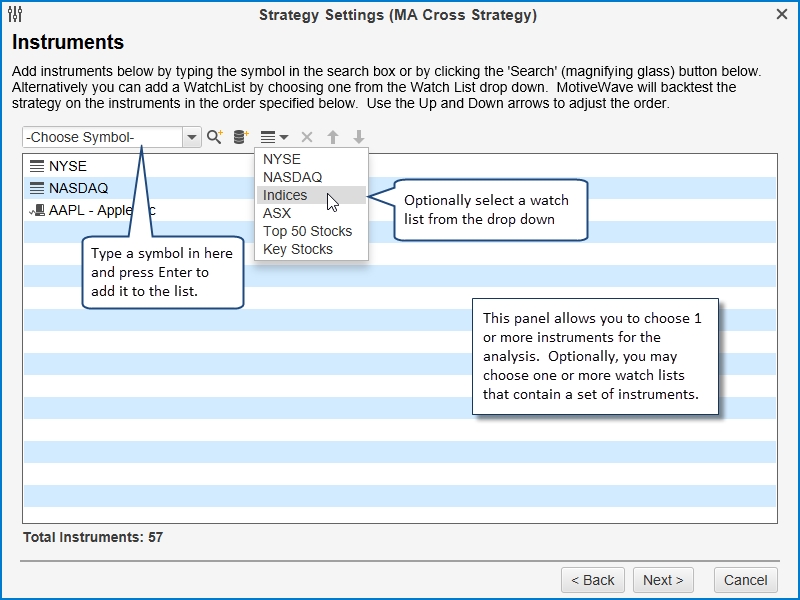
Choose Instruments Panel
The next page of the wizard allows you to choose the set of instruments (symbols) for the analysis. A specific set of instruments may be chosen by clicking on the Add Instrument button or the Search Instrument button. Additionally, you may specify one or more watch lists to specify a group of instruments.
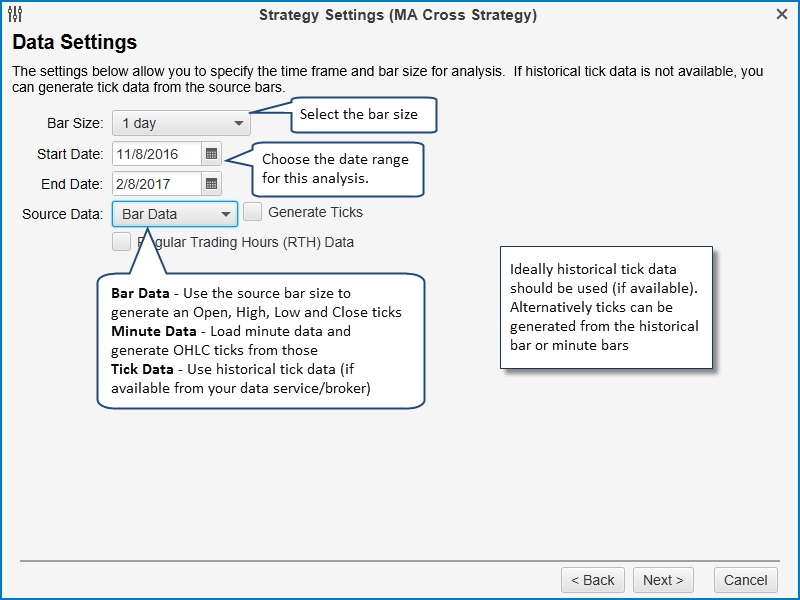
Data Settings Panel
If you choose Back Test or Optimize as the analysis type, then your data settings panel will look like the following. This panel allows you to choose the range of data and bar size for the analysis. Ideally you should use historical tick data (see Source Data field) for the analysis since will give the closest approximation of a real world test. Unfortunately not all brokers or data services provide this data (or enough of it). In these cases you can generate ticks from either the source data or 1 minute bars.
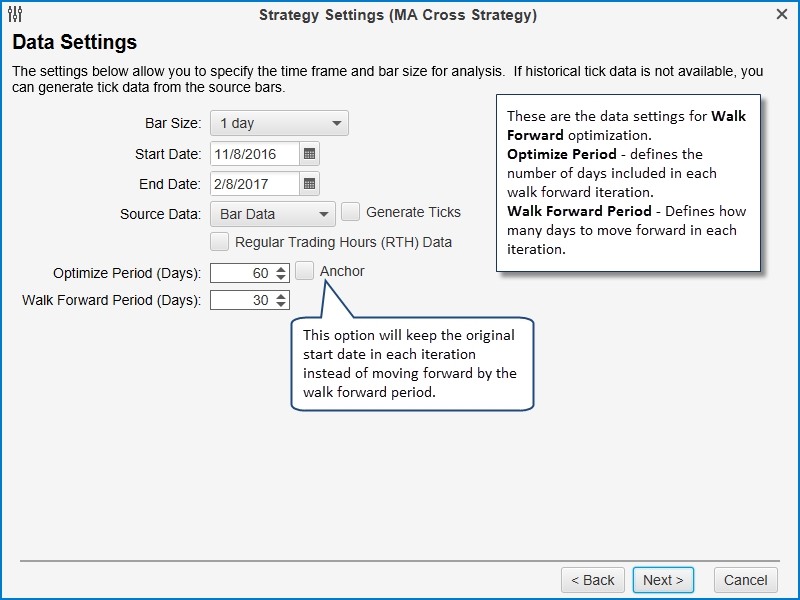
The walk forward data settings are a little bit different. Two more parameters are available to define the Optimize Period and Walk Forward Period. Optimize Period defines the size of the optimization window (the number of days to include in each walk forward iteration). If the Anchor option is enabled, the Start Date will remain fixed for each iteration. Effectively, this means that the optimize period will increase by the walk forward period each walk forward iteration (ie: 60, 90, 120 etc days in this example).
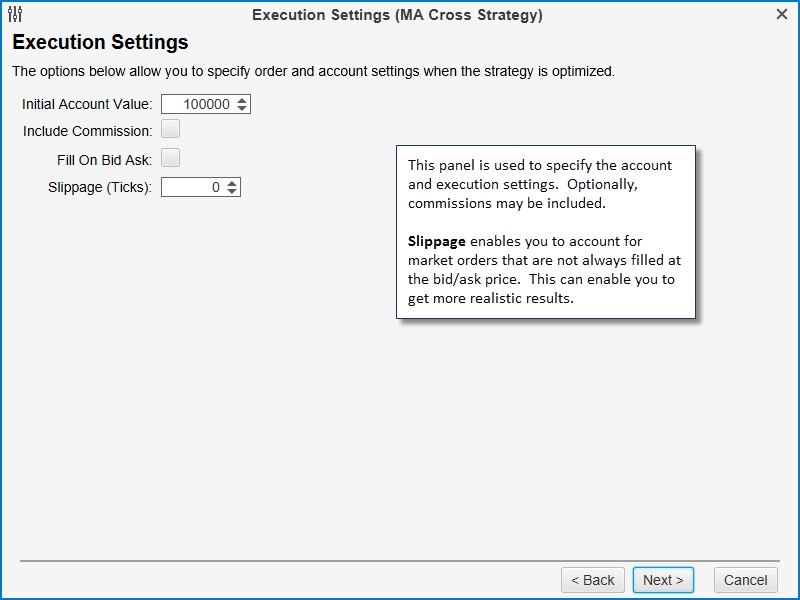
Execution Settings Panel
Execution settings specify the runtime behavior for the analysis. Commissions can be included in the profit/loss calculation and can be configured from the Console menu bar (Configure -> Commissions). Slippage can also be enabled to account for market orders. During periods of lower volume market orders may not be filled at the current bid/ask prices. This parameter assumes that the order will be filled the given number of ticks away from the bid/ask price.
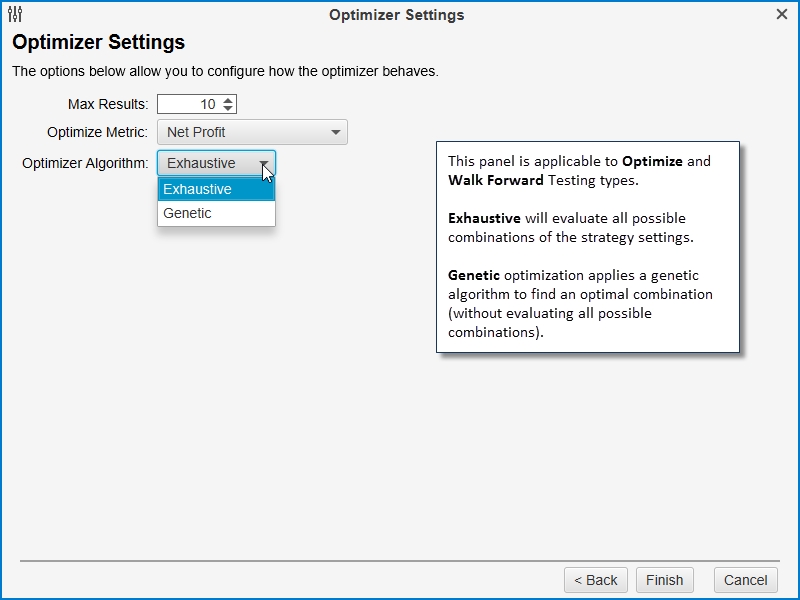
Optimizer Settings Panel
If you chose Optimize or Walk Forward as the analysis type, then you will see the Optimizer Settings panel as the last panel in the wizard. MotiveWave currently supports two types of optimizer algorithms:
Exhaustive - this algorithm will evaluate all combinations of the strategy settings to find the optimal result. This algorithm will find the optimal settings for the strategy. This is a good option if the number of combinations is relatively low.
Genetic - employs a natural selection approach to find an optimal combination without having to evaluate all possible combinations of the strategy settings. For more details on how this works see Wikipedia: Genetic Algorithm.
Exhaustive Optimization vs. Genetic Optimization
There are many types of optimization. The most common types used for strategy optimization are Exhaustive Optimization and Genetic Optimization. Both types of optimization have benefits. It’s just a matter of figuring out which type of optimization is most appropriate for the results you’re looking for.
Exhaustive Optimization
Exhaustive Optimization will run through and test every possible combination of inputs to determine the absolute best possible performance solution. But, because it will run through every possible combination, running an exhaustive optimization can take a very long time. The time required to run an exhaustive optimization is dramatically increased when a large number of inputs or parameters are used in the search.
To reduce the amount of time required to run the exhaustive optimization, you can limit the number of inputs or parameters used to a small number, or use genetic optimization instead.
Genetic Optimization
Genetic Optimization (or Genetic Algorithm Optimization) is based on the concept of biological evolution, or natural selection. In relation to trading strategy optimization, genetic optimization will start by randomly selecting a number of combinations to test. From those selected, it will determine which of those combinations have the best potential and discard the rest. Then it will continue to test the remaining ‘best potential’ combination candidates until it arrives at the close-to-best input or parameter performance solution.
Because genetic optimization does not test every possible combination, it will not arrive at the absolute best possible performance solution, like with exhaustive optimization, but the time it takes to arrive at a close-to-absolute best performance solution is dramatically shorter.
Genetic Optimization is best suited for running an optimization with many inputs or parameters. The larger the sample size is, the longer it will take to complete the optimization, but if the sample size is too small, the genetic optimization results may be less accurate.
Strategy Analysis
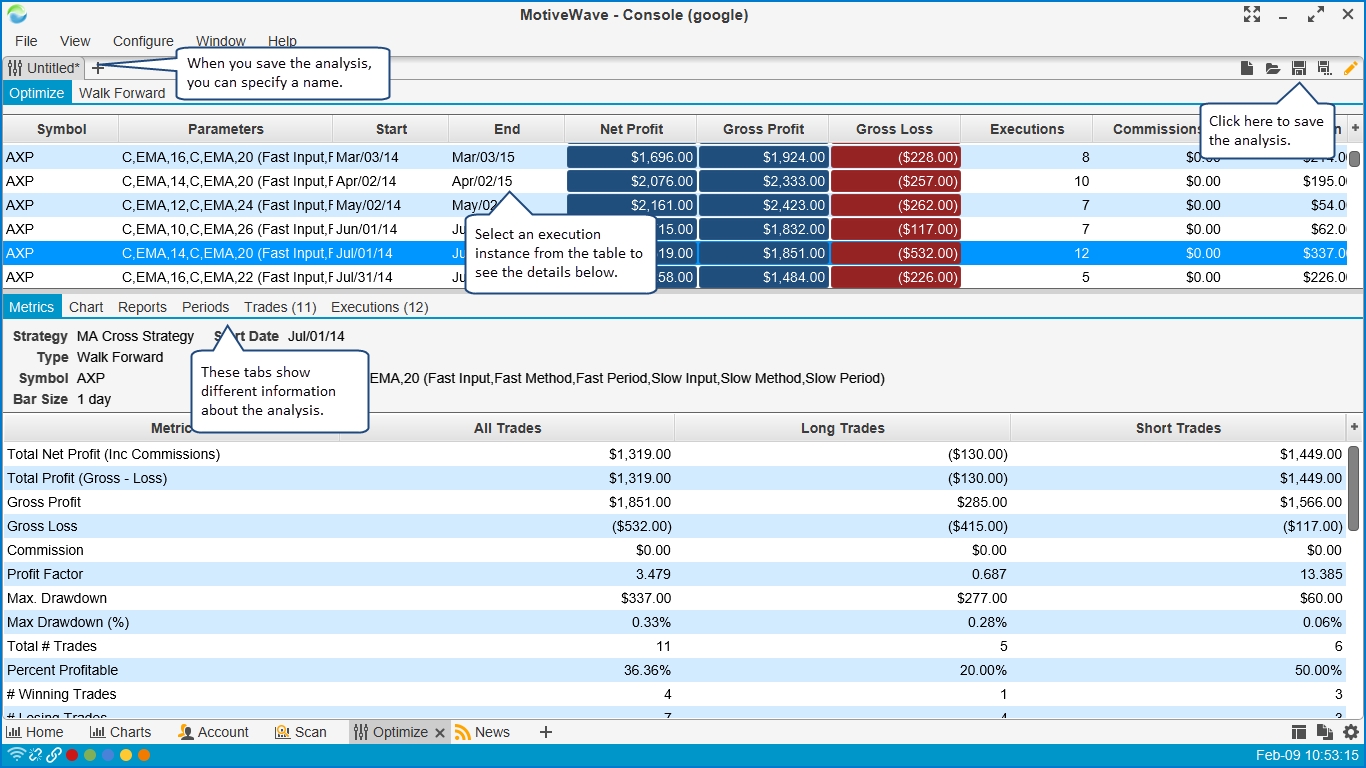
Once you have created and executed a strategy analysis, you can look at the results in the strategy optimizer (see below). The analysis will contain one or more execution instances in the summary table at the top of the window. Select the instance that you want to view and it will be displayed in the panel below the table.
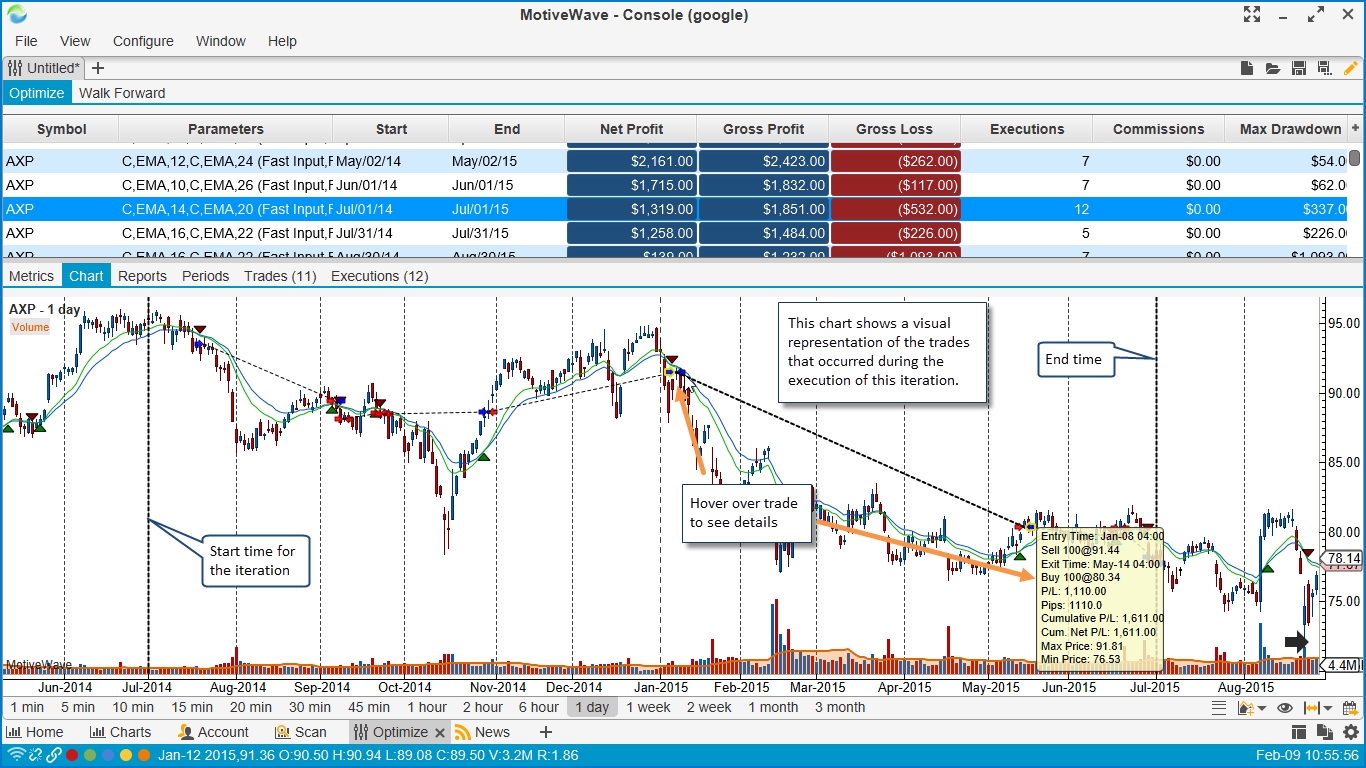
The following screen shot shows an example of the Chart tab of the strategy analysis. This tab displays a visual representation of the executed trades that occurred for the selected execution instance.
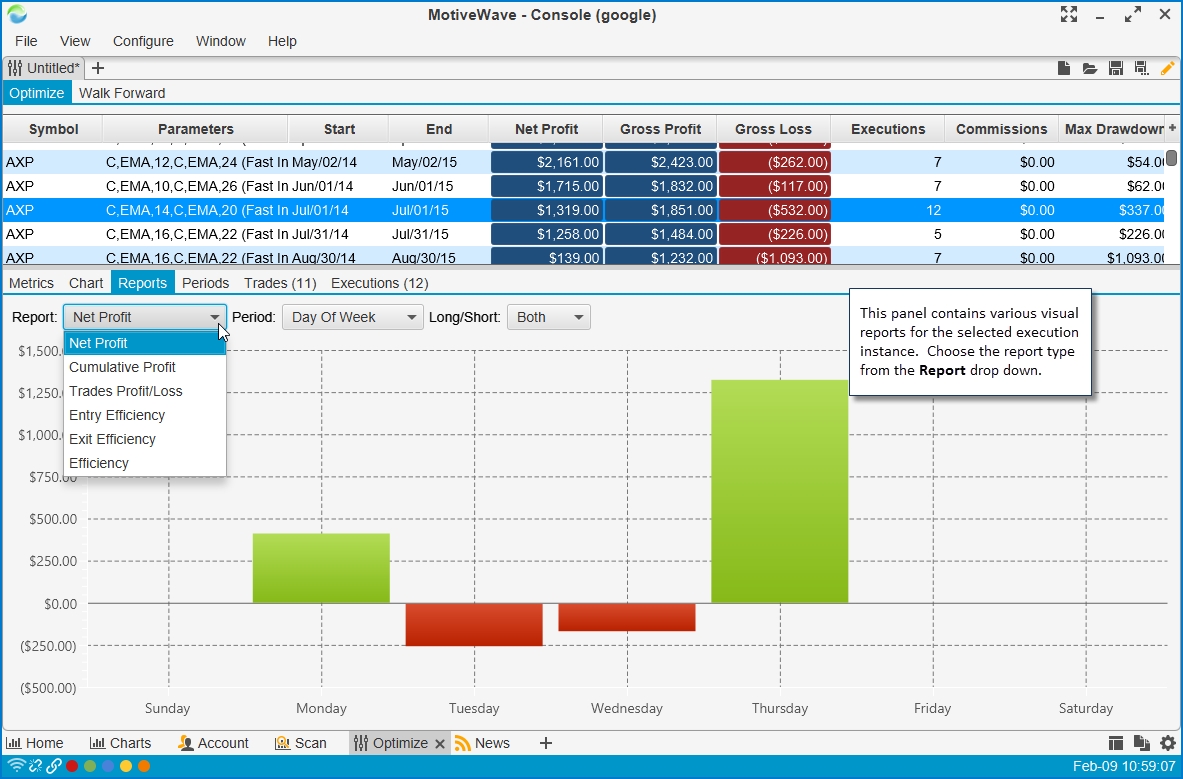
Several visual reports are available under the Reports tab. The available report types can be found in the Report dropdown.
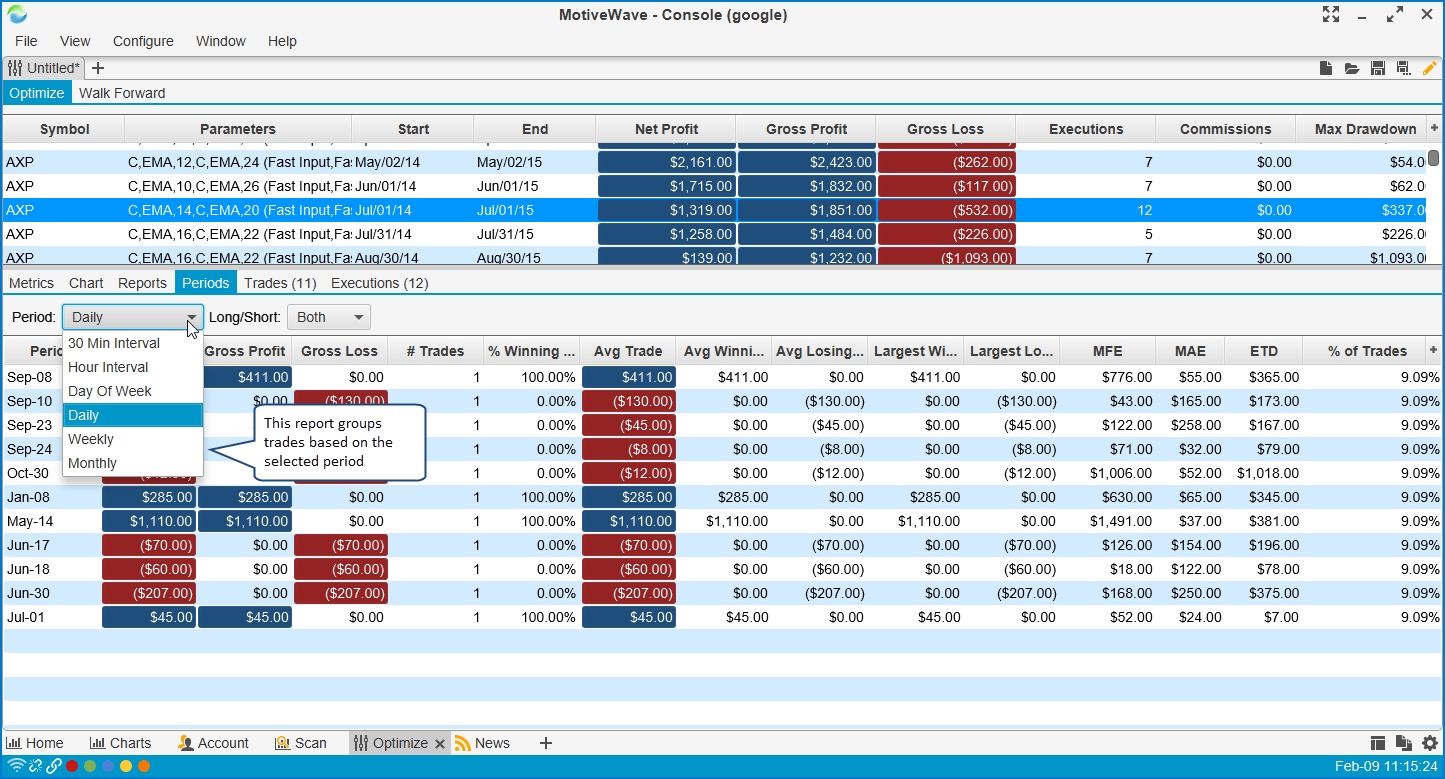
The Periods tab groups trades together based on the selected period (hourly, daily weekly etc). Each row in this table displays summary information.
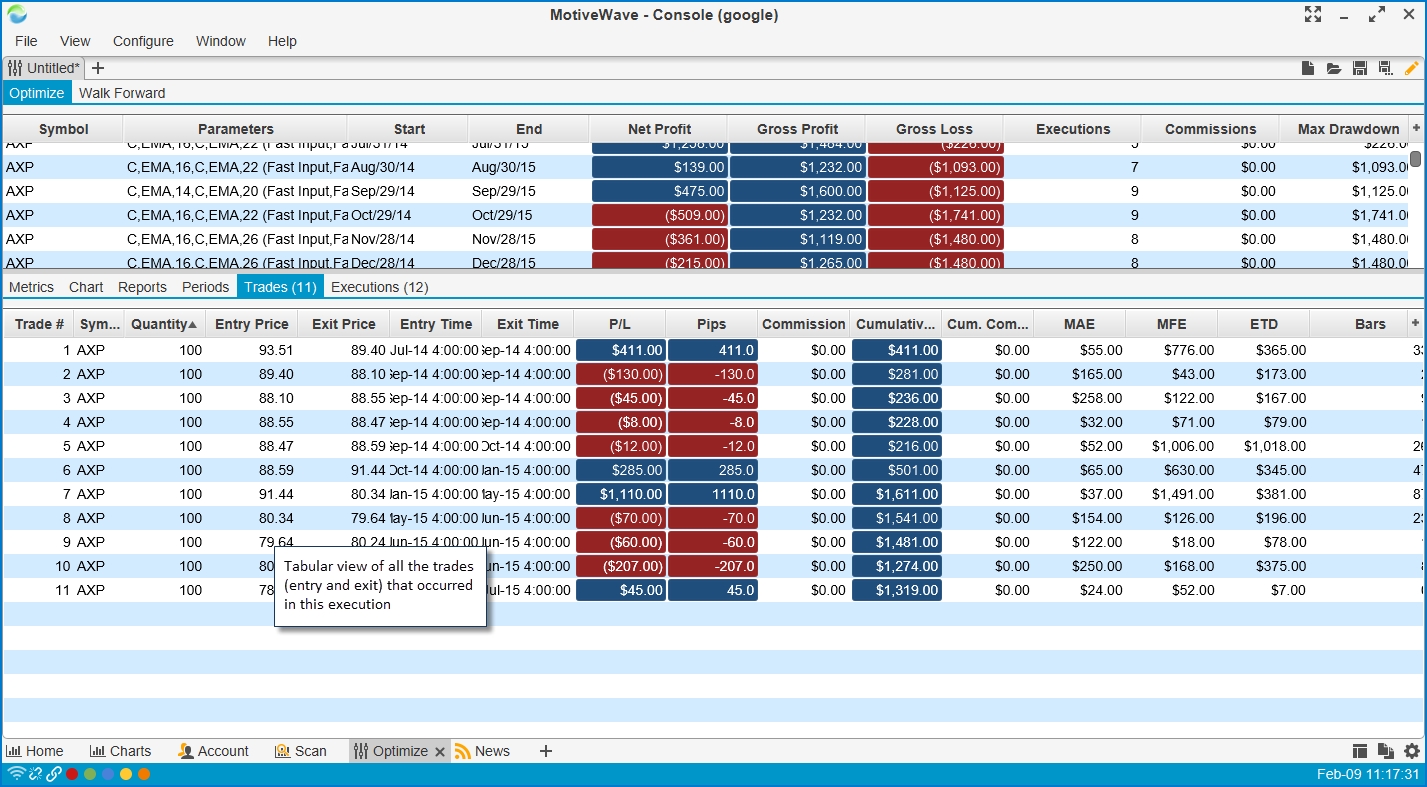
The Trades tab shows all of the trades that occurred. A trade includes the entry into the trade as well as the exit out of the trade. This allows you to see the profit/loss that occurred with each trade.
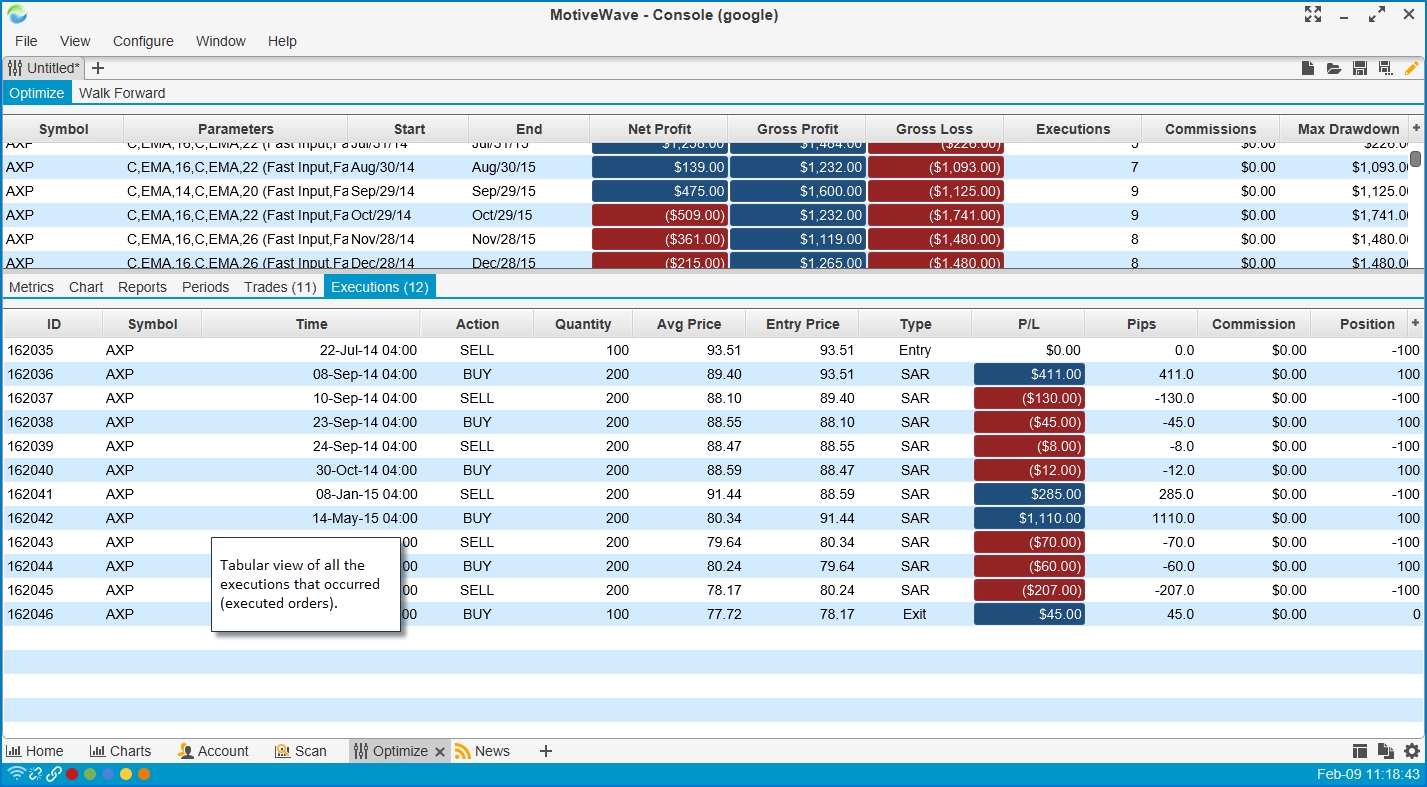
The Executions tab displays all of the filled orders.
Last updated