
Bid/Ask Volume
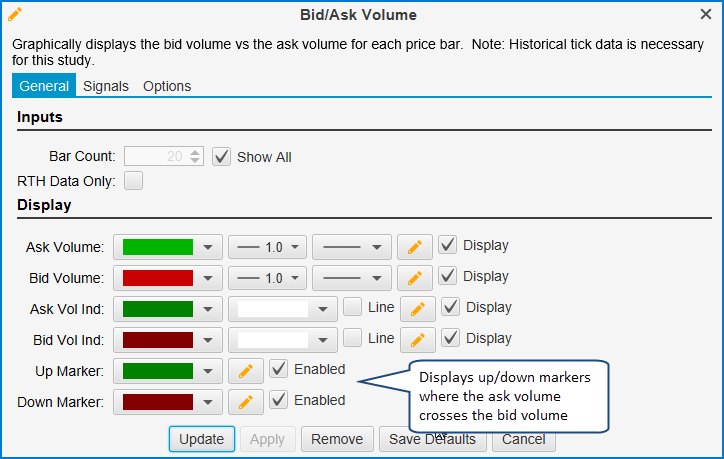
Plots the bid volume and ask volume as separate paths and optionally shows where these paths cross (generating signals). This study can be accessed from the top menu bar: Study -> Volume Based -> Bid/Ask Volume. The following screen shot shows the general settings for this study:
Bar Count - Optionally limits the number of bars that are displayed. This is useful if you want to avoid loading a large amount of historical tick data. Check “Show All” to show for all bars.
RTH Data only – Check this box to only show data that occurred during regular trading hours.
Ask Volume – Settings for the ask volume path.
Bid Volume – Settings for the bid volume path.
Ask Vol Ind - Settings for the latest ask volume indicator in the vertical axis.
Bid Vol Ind - Settings for the latest bid volume indicator in the vertical axis.
Up Marker – Displays an up marker where the ask volume crosses above the bid volume.
Down Marker - Displays a down marker where the ask volume crosses below the bid volume.
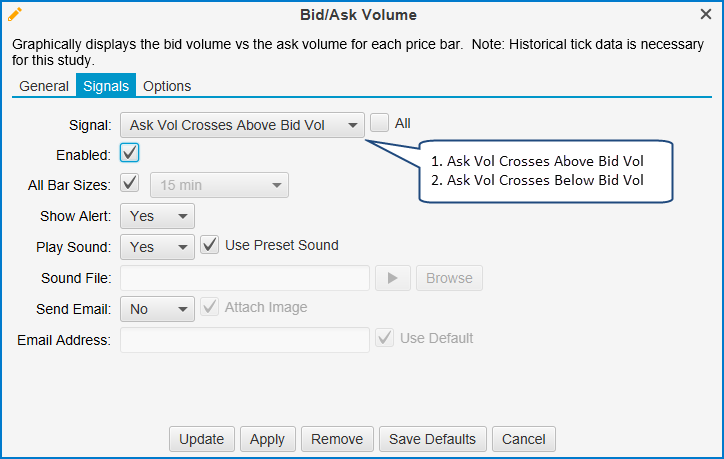
This study generates signals when the ask volume crosses above or below the bid volume. These signals can be configured to generate alerts:
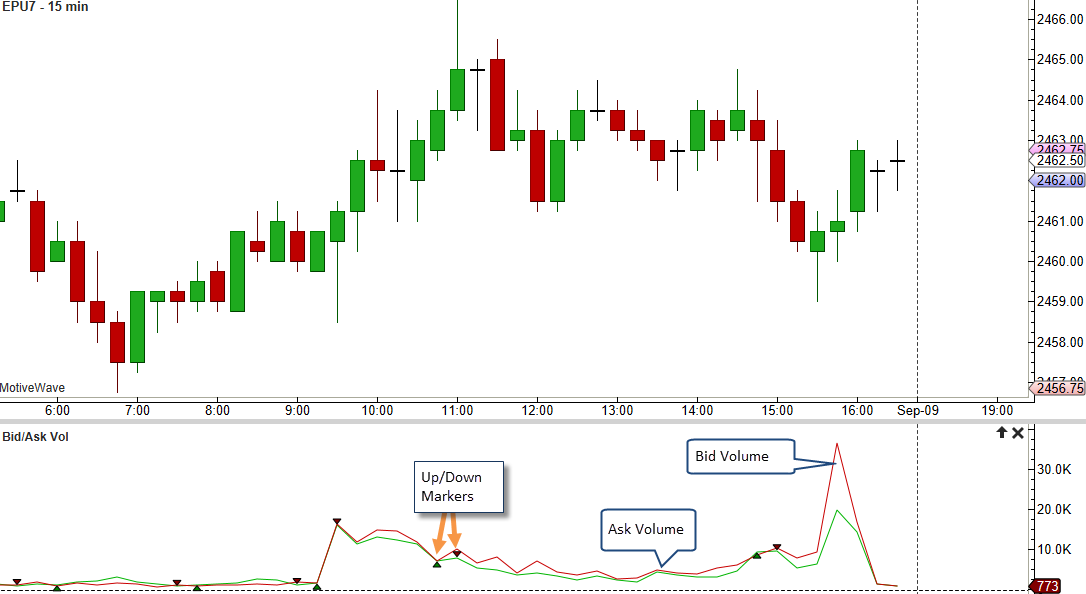
The following screen shot shows an example of the Bid/Ask Volume study. Markers are enabled to indicate where the ask volume path crosses the bid volume path.
Last updated