Big Trades
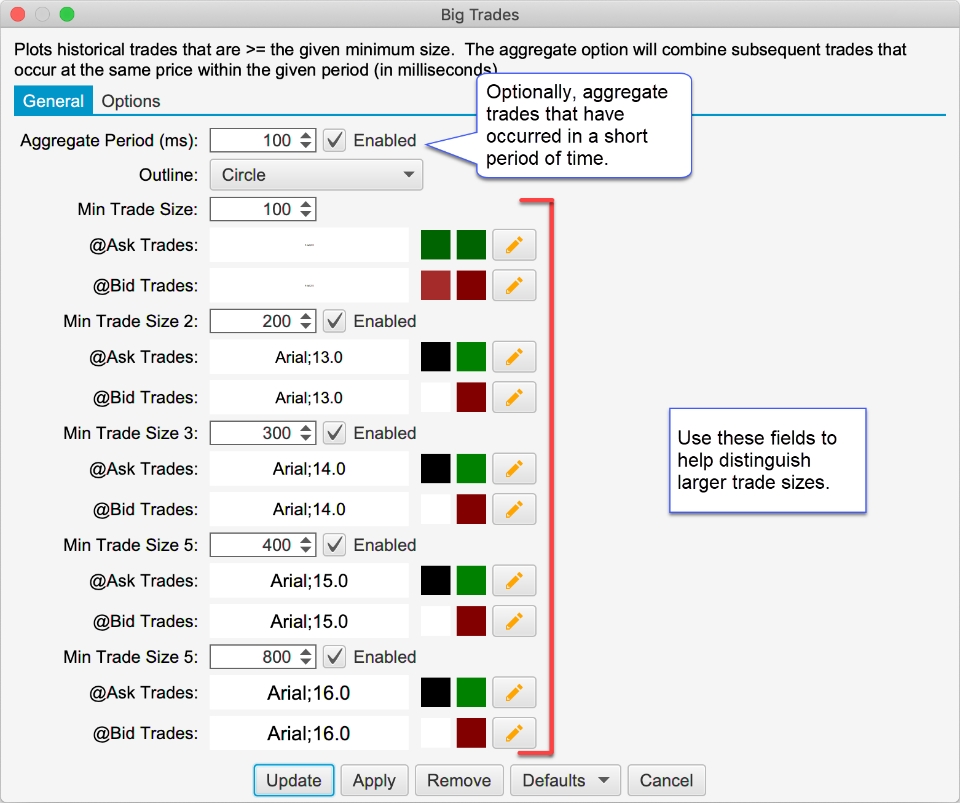
This study shows historical trades on the chart. These are computed using historical tick data. This study has the following options:
Aggregate Period (ms) – Optionally aggregates trades that have occurred within the aggregate period (milliseconds). These trades must occur at the same price and the @Ask flag must be the same.
Outline – Options include:
Circle (default)
Rectangle
Rounded Rectangle
None (text only)
Min Trade Size – Up to 5 trade sizes can be defined to distinguish between smaller and larger trades. Use the Min Trade Size for each level to define the tiers.
@Ask Trades – These fields define the font, font color and background color for trades that occurred at the ask price. The size of the trade can be modified by changing the size of the font. Text can be hidden by choosing the same font color as the background color.
@Bid Trades – Same as @Ask trades, but applies to trades that occurred at the bid price.

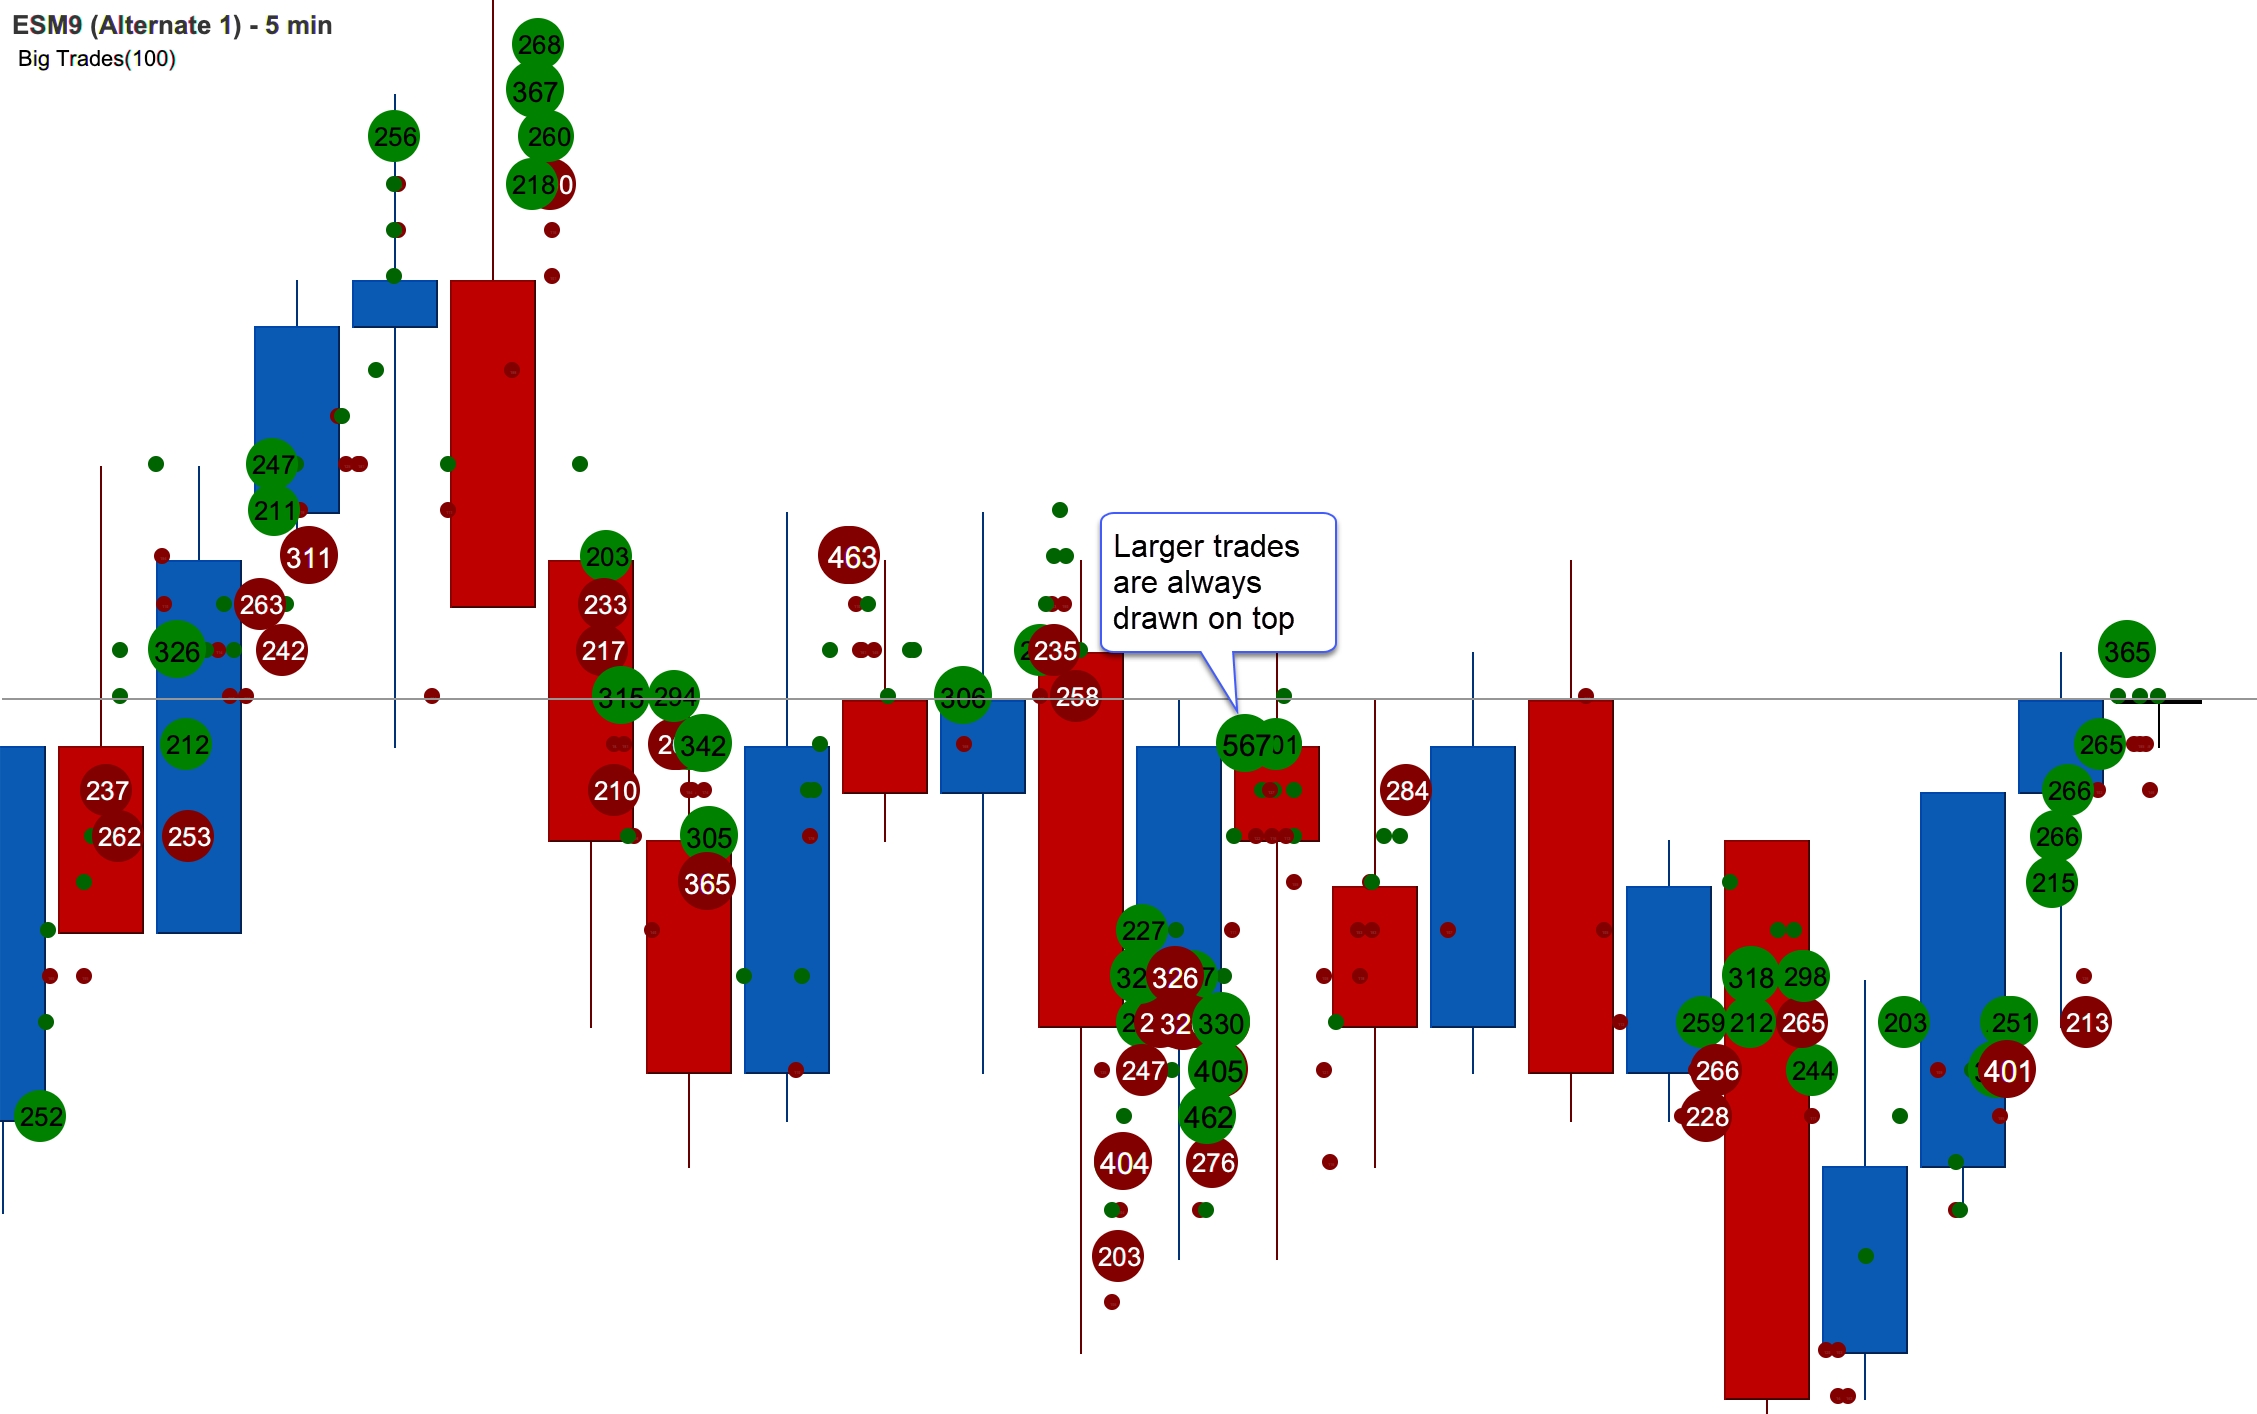
The screen shot below shows the Big Trades study with the settings from above. For convenience larger trades are drawn on top (potentially hiding smaller trades underneath). The following limitations are imposed to avoid performance issues with the study:
Max 25000 Trades – The study will only compute a maximum of 25000 trades that meet the given criteria.
Max 500 Visible – A maximum of 500 trades will be drawn on the chart at one time.

Last updated