
Components
These components offer a convenient way to drag/drop a TPO or Volume Profile on a chart and dynamically adjust the range using the resize points.
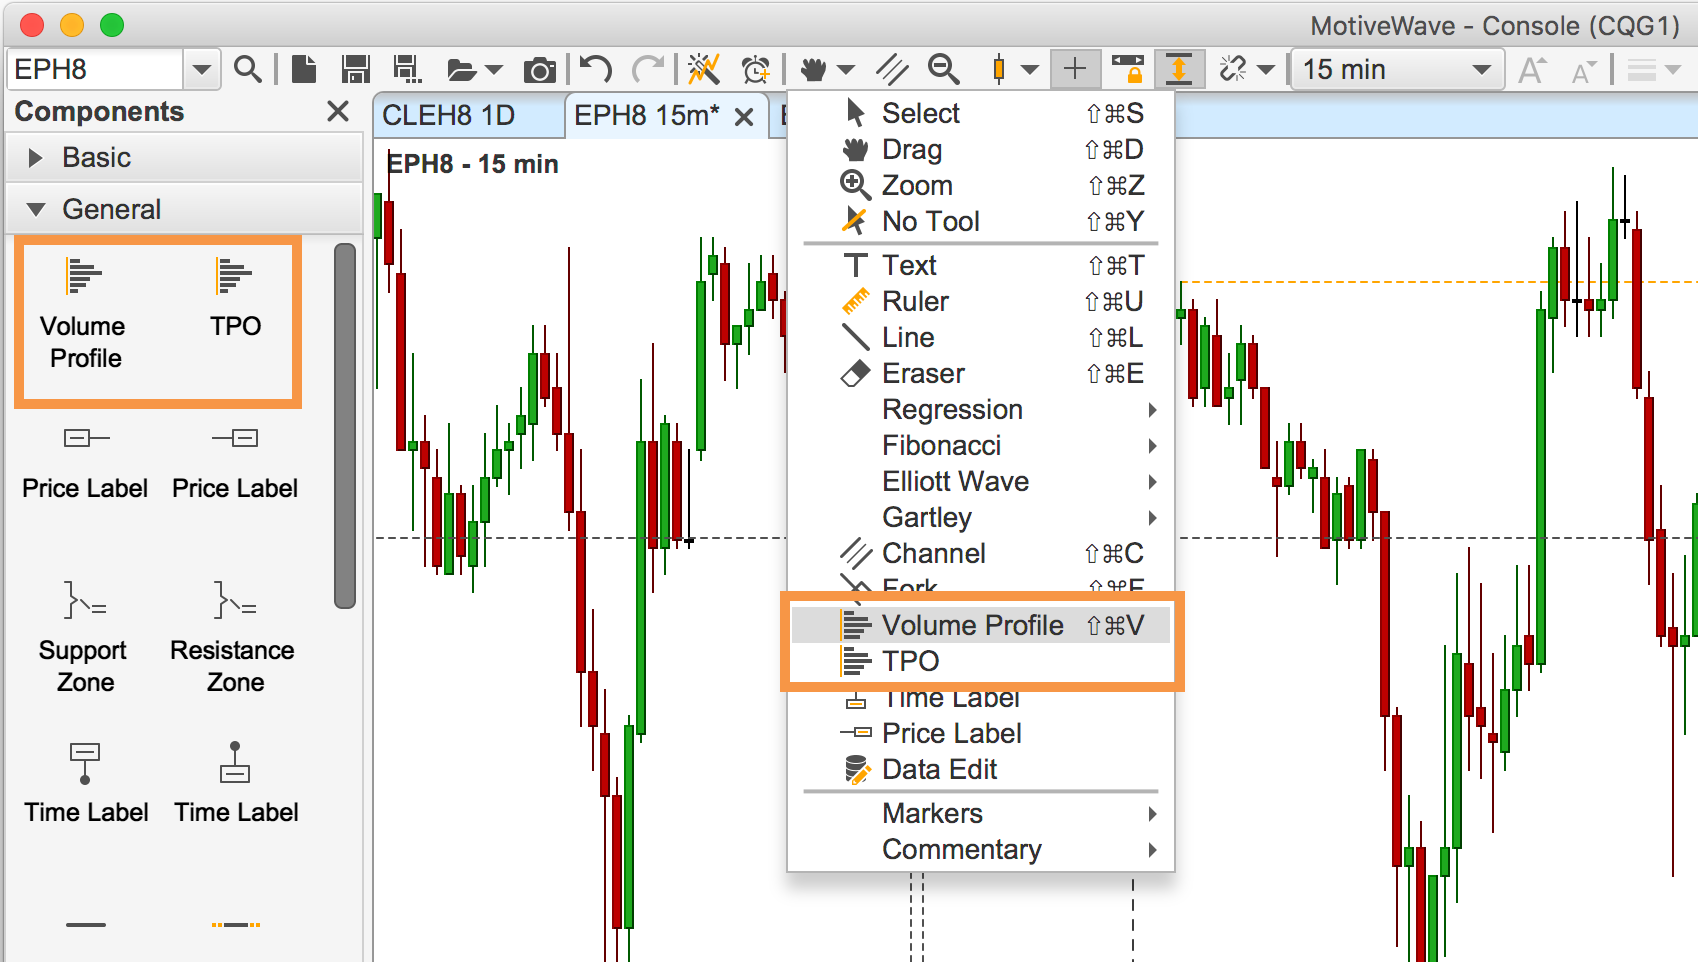
Volume Profile Component
The Volume Profile component uses tick data to display a histogram of volume at each price level for the given range of price bars. The volume profile will optionally compute common information such as:
Value Area.
Point of Control.
Bid vs Ask Volume and Deltas.
Midpoint, High/Low values.
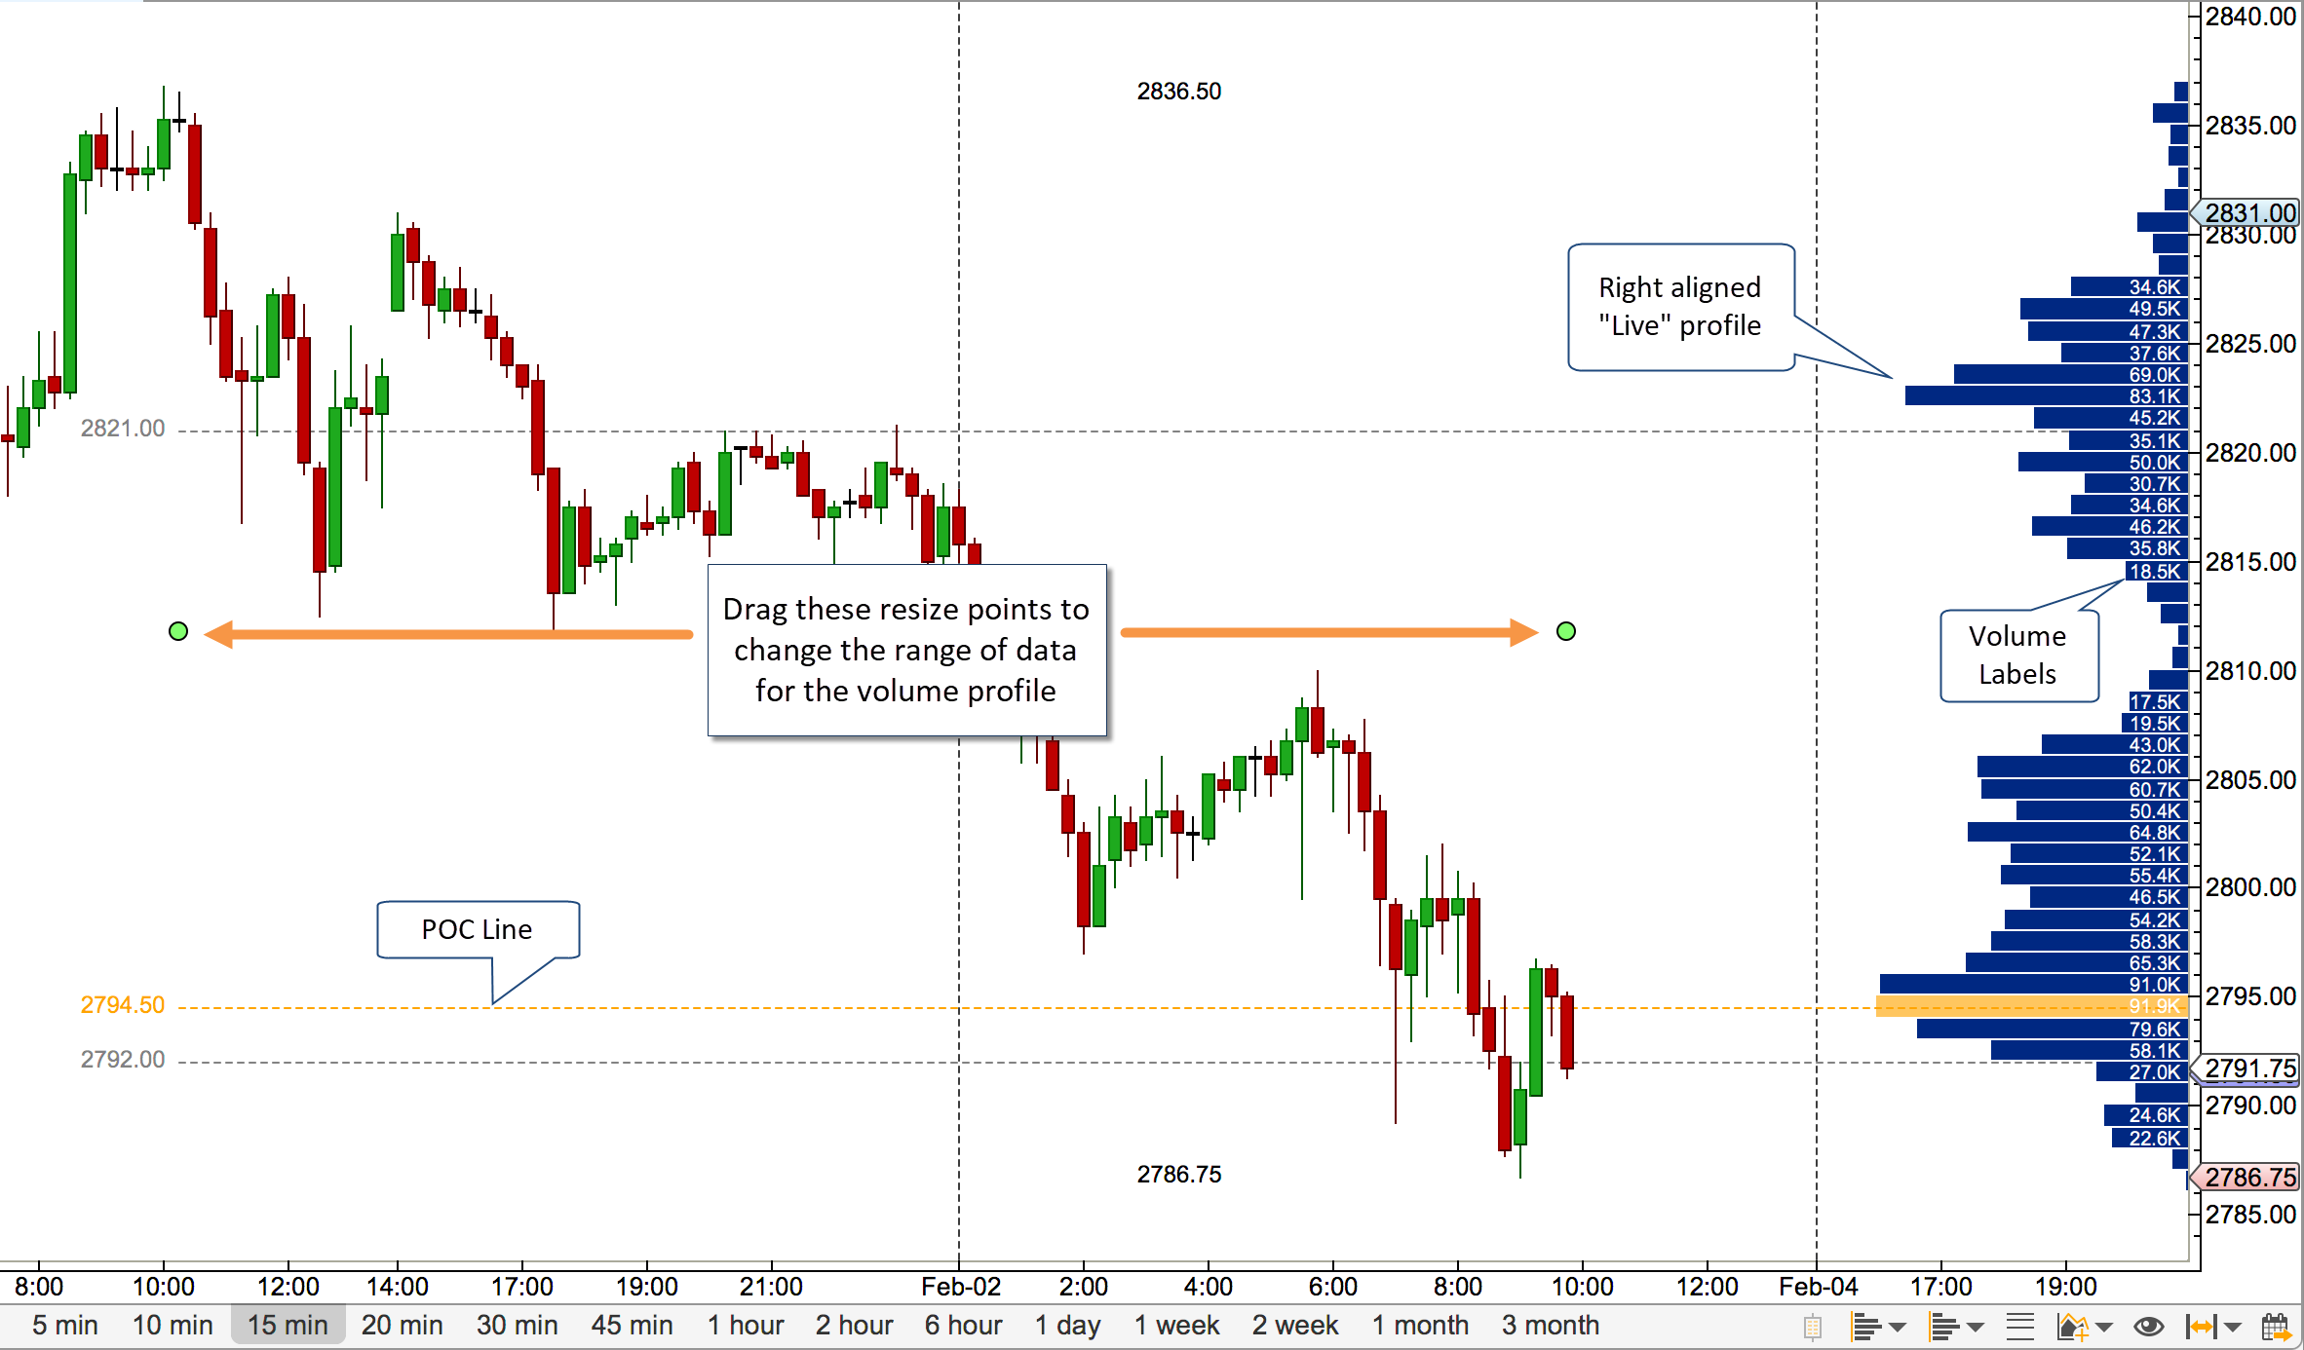
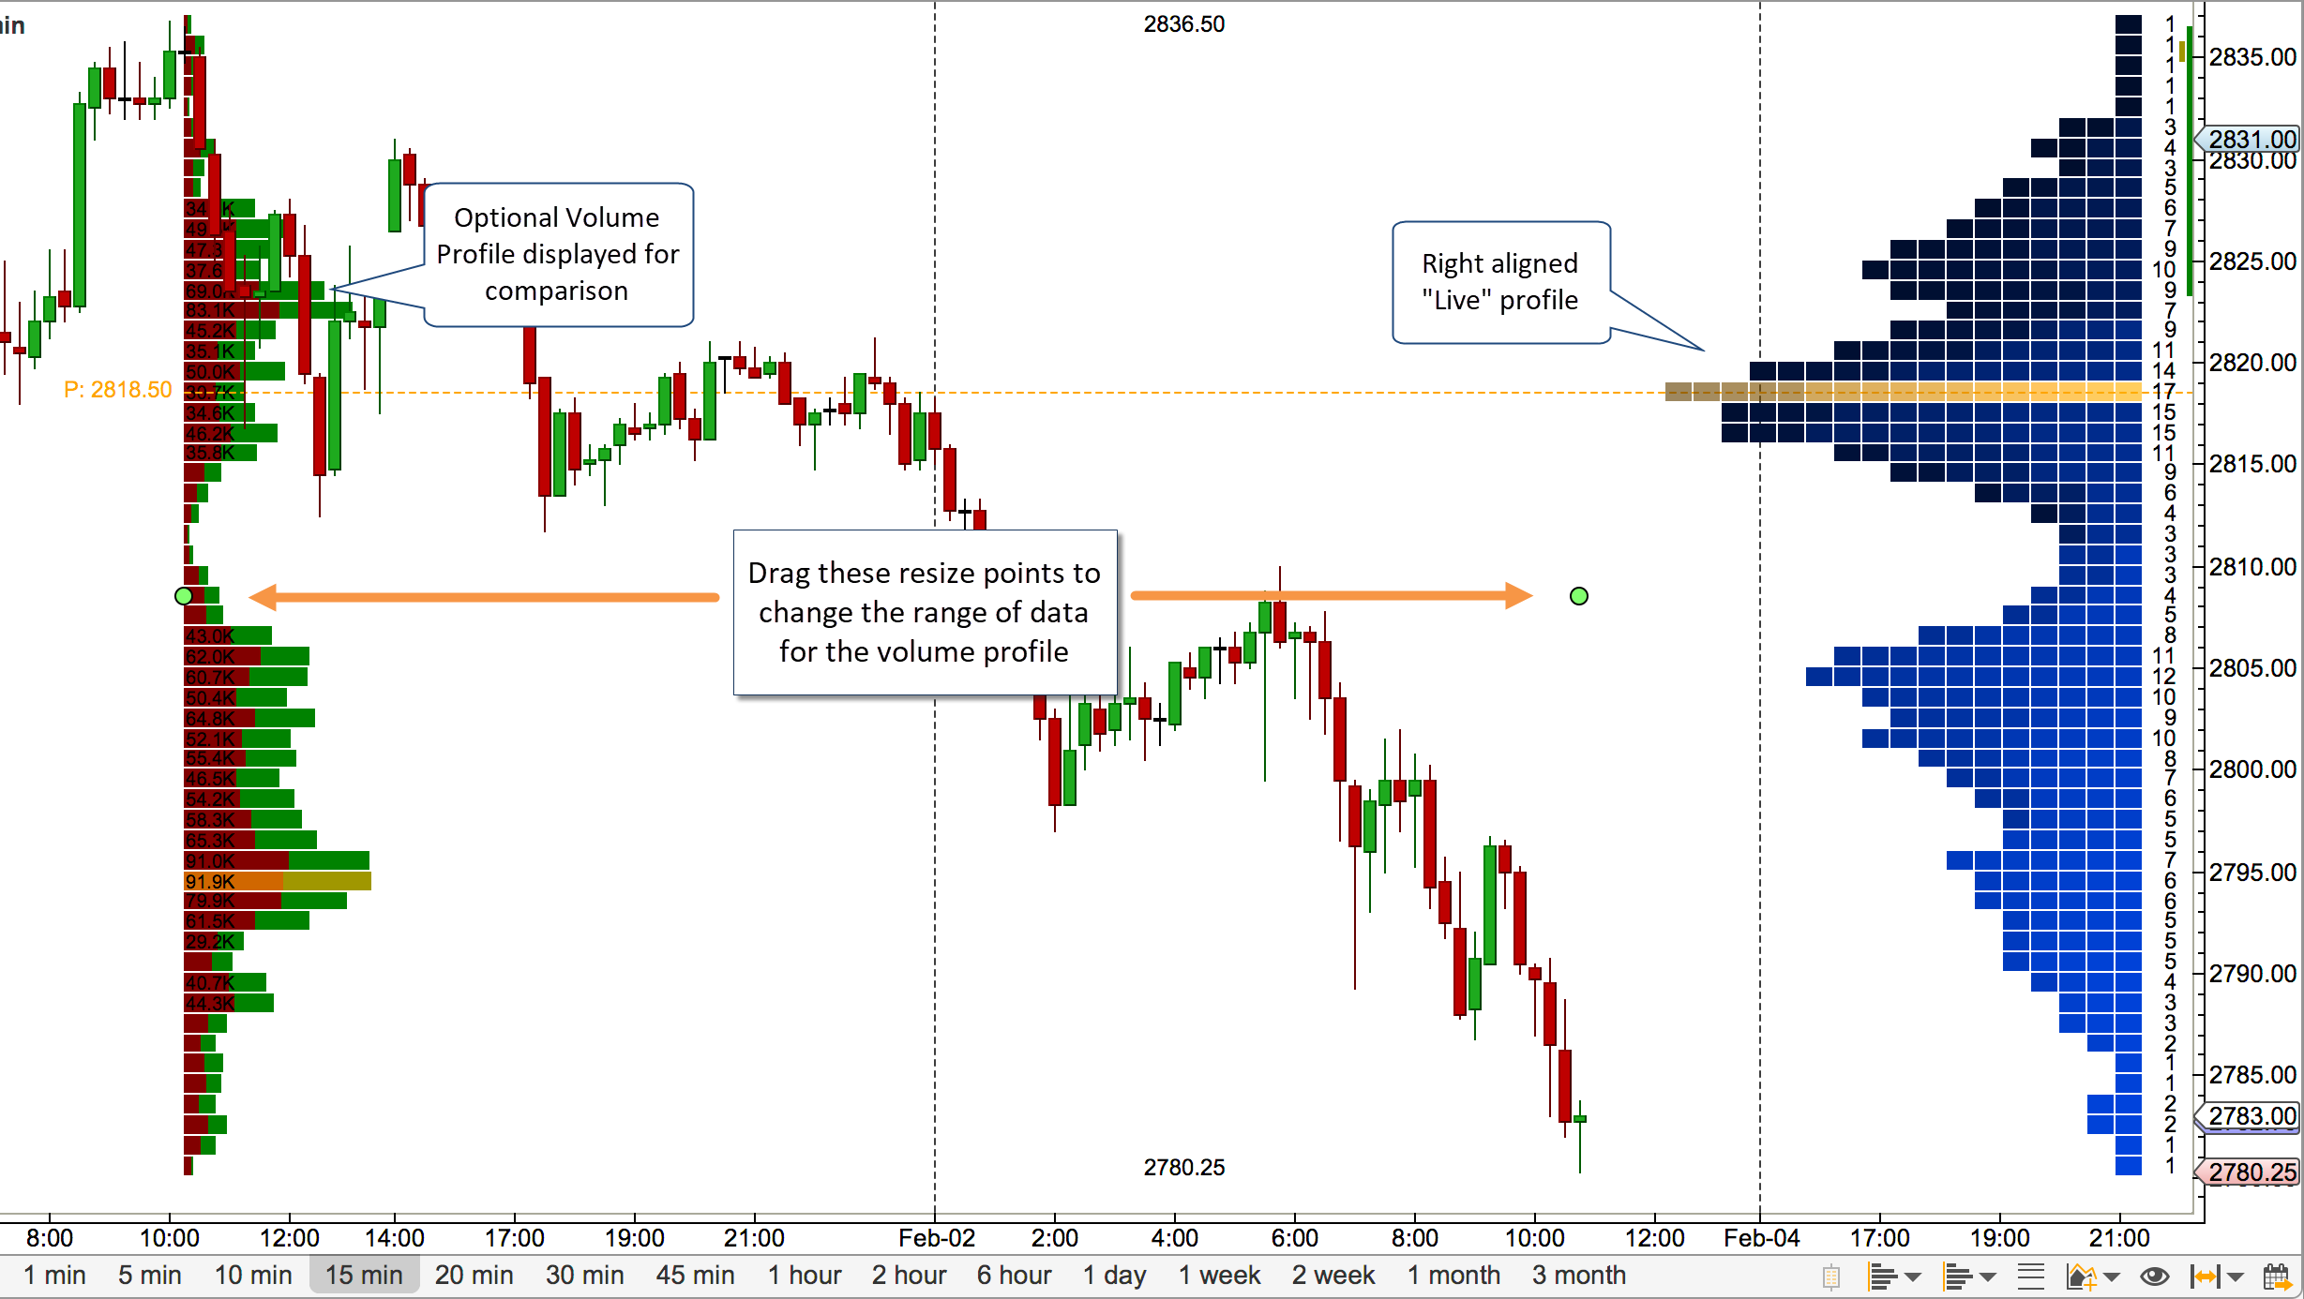
The screen shot below shows an example of a live volume profile (updates in real time) that is aligned to the right. A profile can be made “live” by dragging the right resize point to the latest price bar.
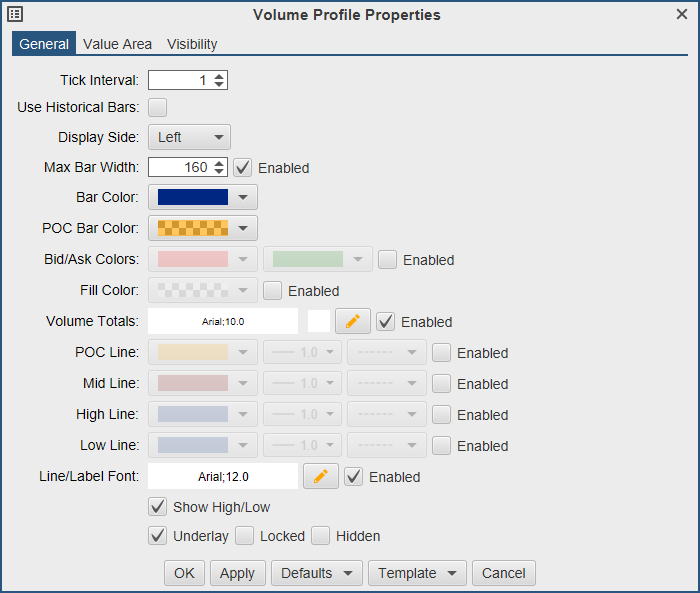
The screen shots below show the configuration options available from the properties dialog (double click on the volume profile object to display). Some of the notable options include:
Tick Interval – Use this option to specify the number of ticks that make up each volume bar. In the example below 4 ticks are used (for the S&P mini futures contract this represents a single point (min tick is 0.25)).
Use Historical Bars – Enable the use of minute bars instead of tick data.
Display Side – Options include Left and Right. If displaying a “Live” profile the “Right” option will right justify the profile next to the price axis.
Max Bar Width – Maximum width in pixels of the volume profile.
Bar Color – Color for the volume profile bars.
POC Bar Color – Use this to highlight the “point of control” volume bar.
Bid/Ask Colors – Enable this option to display the bid vs ask volume in the volume bars. (Note: this will override the bar color option).
Fill Color – This will display a background fill color for the entire range of the volume profile component.
Volume Totals – Displays the total volume for each bar using the given font. The label will not be displayed if there is not enough room.
POC/Mid/High/Low Lines – Optionally draws lines for these values.
Line/Label Font – Font for price values on the lines above. If not enabled, the price labels will not be displayed.
Show High/Low – Displays text with the high and low values.
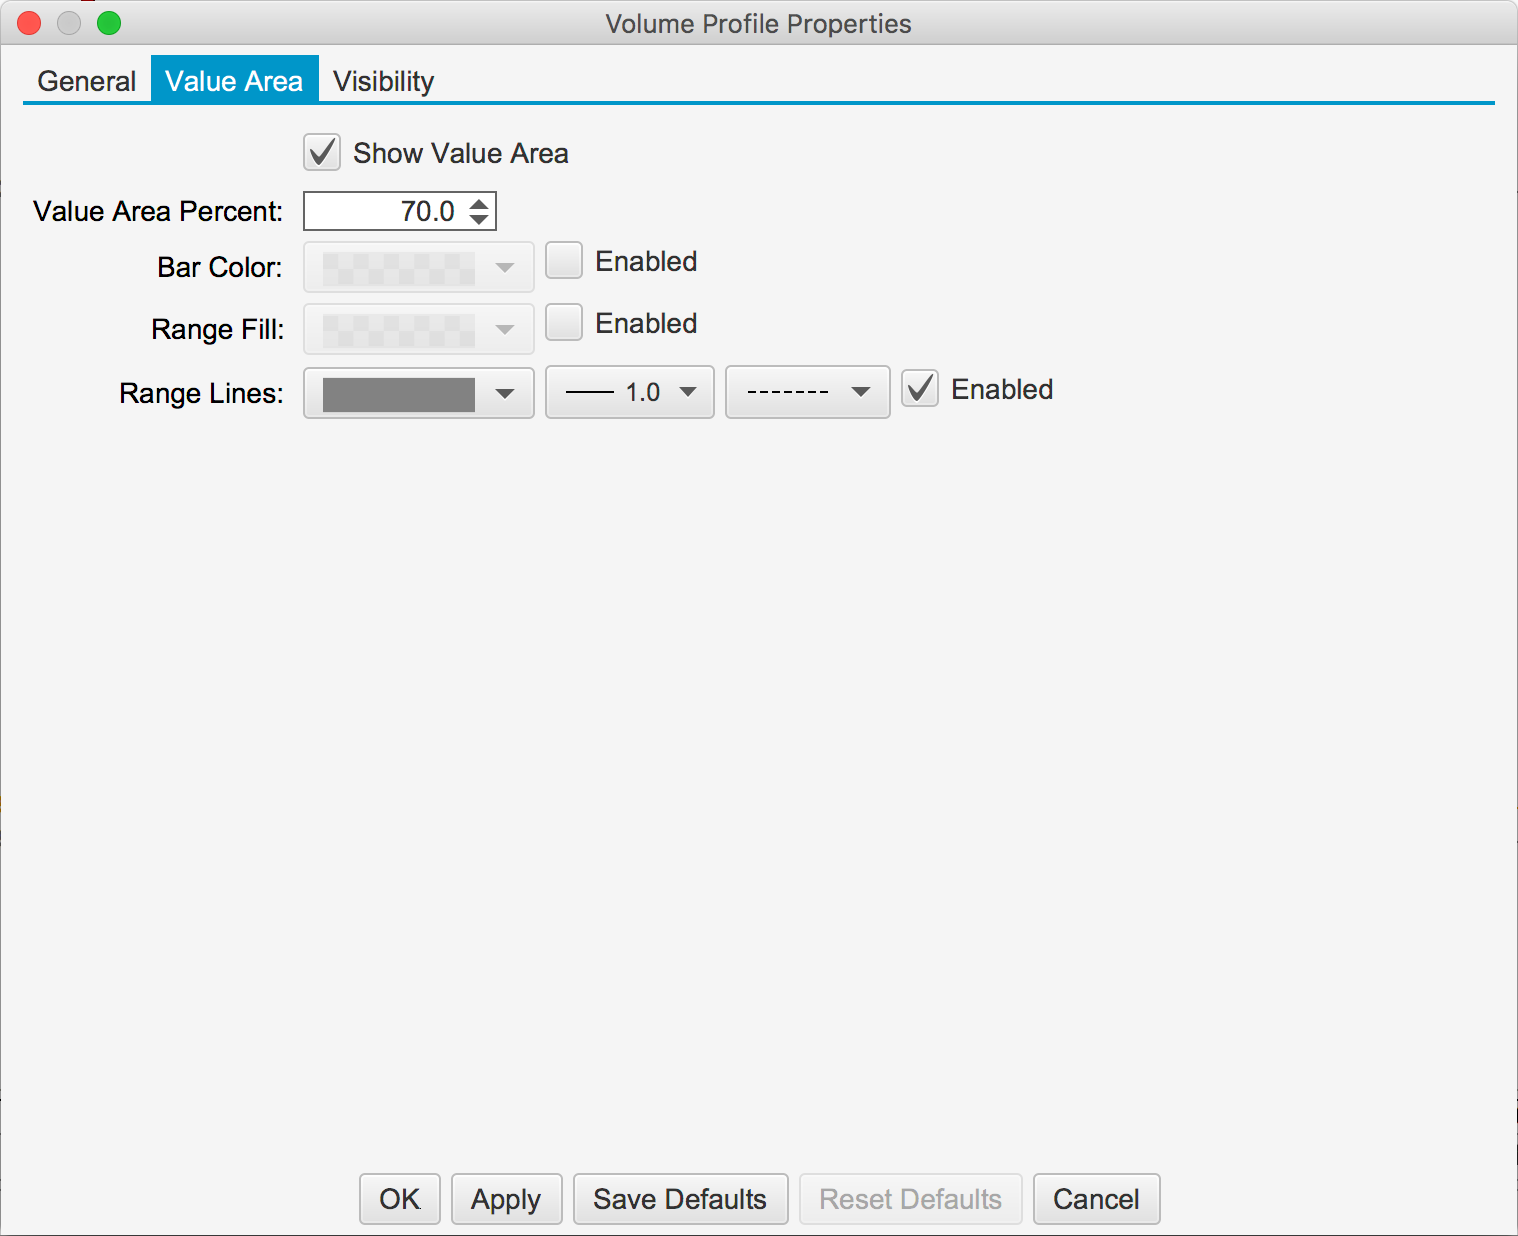
The value area for the profile may optionally be displayed from the “Value Area” tab (see below):
Value Area Percent – Percentage of volume to be included in the value area. The value area will always include the point of control (POC).
Bar Color – Optionally change the bar color for bars included in the value area.
Range Fill – Fill color to use as a background color for the value area.
Range Lines – Displays horizontal lines at the top and bottom of the value area. Price labels are controlled using the “Line/Label Font” option in the “General” tab.
Delta Profile Component
TPO Component
The Time Price Opportunity (TPO) component displays a histogram that represents the amount of time spent at each price range.
The component is effectively the same as the TPO Study (see section above for details) except that only one TPO is displayed and you can configure the data range by moving the resize points (see graph below).
Last updated