
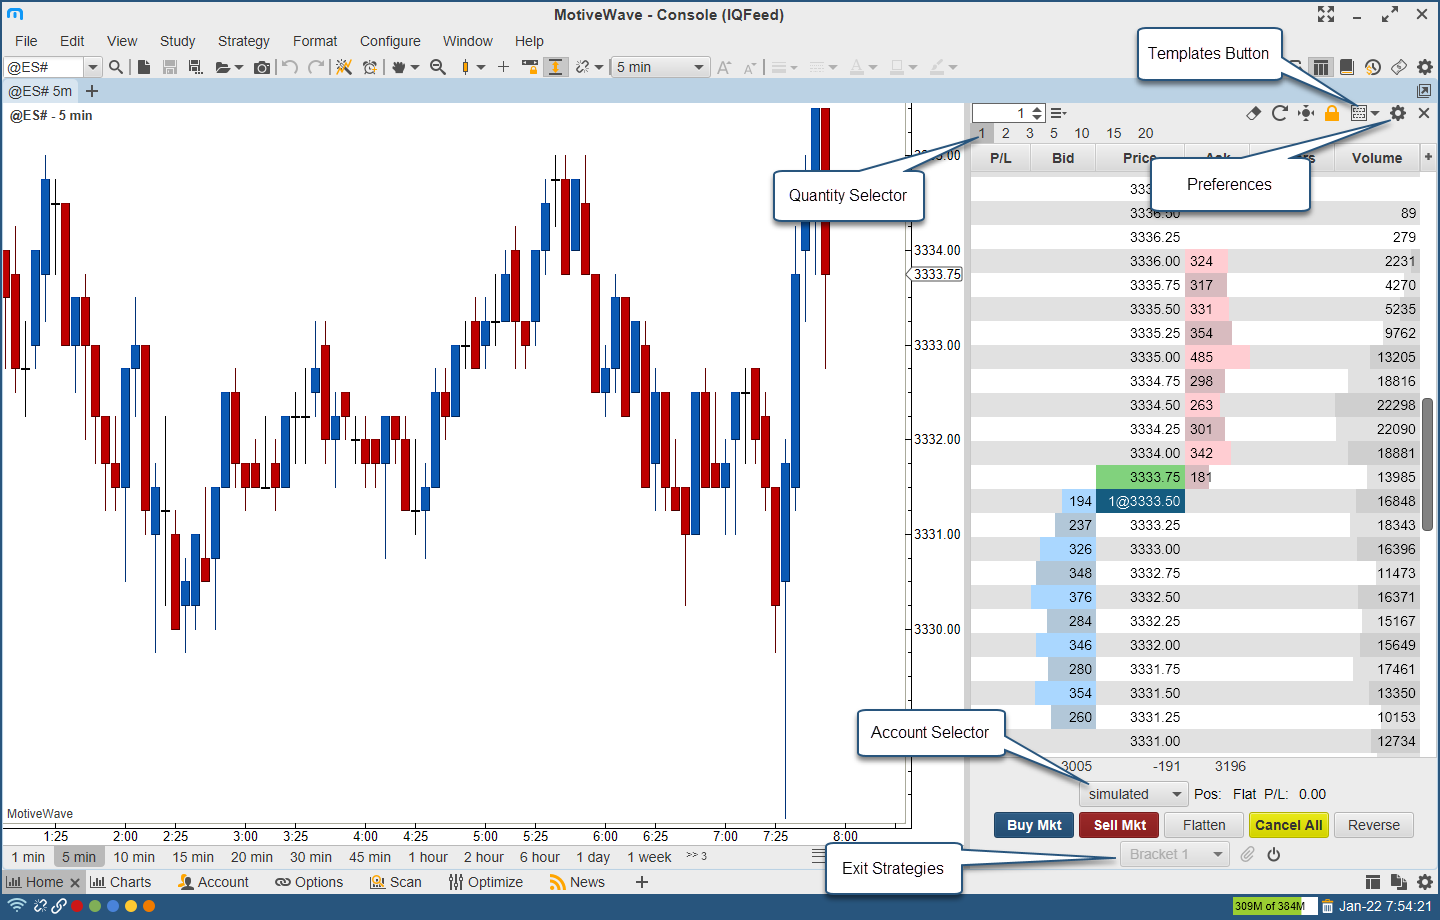
Depth of Market
The Depth of Market (DOM) panel shows the number of resting (limit) buy and sell orders for the given instrument. The DOM can also be used to display other columns such as trades recently executed on the bid or ask, orders being added or pulled and volume traded at each price level.
DOM Columns
Columns may be added/removed from the DOM table by click on the ‘+’ button in the top right corner of the table (to the right of the column headers).
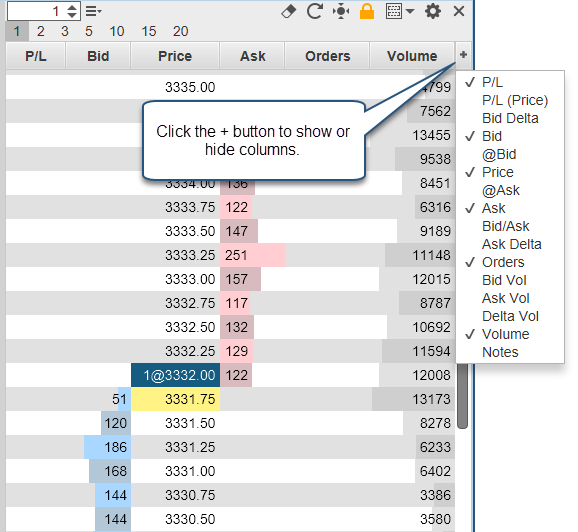
The following columns are available:
P/L – Profit/Loss calculated for each price level using the current open position.
P/L (Price) – Profit/Loss displayed in the instrument price versus dollar value.
Bid Delta – Tracks the difference in contracts added/removed from the current bid size (see Bid column) for all depth levels in the DOM book (see bid column). These values are calculated on every DOM book update and are reset when the last price changes.
Bid – Displays the quantities of the current buy orders at the given price.
@Bid – Tracks the contracts traded at the bid price since that last reset (see reset button on the tool bar).
Price – Displays the price level for the row.
@Ask - Tracks the contracts traded at the ask price since that last reset (see reset button on the tool bar).
Ask – Displays the quantities of the current sell orders at the given price.
Bid/Ask – Bid and Ask columns combined into a single column.
Ask Delta - Tracks the difference in contracts added/removed from the current ask size (see Ask column) for all depth levels in the DOM book (see bid column). These values are calculated on every DOM book update and are reset when the last price changes.
Orders – Displays active orders at each price level. If “Single Order Column” is unchecked (see General tab of the Properties dialog below), then there will be two of these columns (buy and sell orders).
Bid Vol – Daily volume traded at the bid price.
Ask Vol – Daily volume traded at the ask price
Delta Vol – Difference between the ask and bid volume at the given price.
Volume – Daily volume traded at the given price.
Notes – Displays a text note that you can add to each price level (click on the field and type). All notes can be removed by pressing the eraser button on the tool bar.
Preferences
Configuration information for the DOM panel can be found in the DOM Preferences dialog (click on the gear icon in the toolbar). The dialog contains several tabs which are described in the following sections.
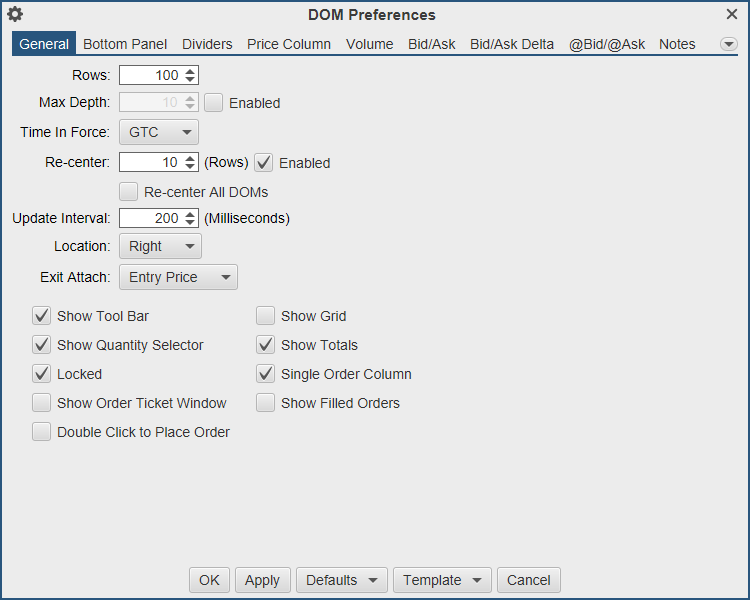
General Preferences
The following configuration options are available from the General tab:
Rows – Number of rows to display in the DOM (default 100).
Max Depth – Limit the number of rows that display depth for performance reasons.
Time in Force – Time in force setting for orders placed from the DOM.
Re-center – Defines the range (number of rows above/below the current center) for resetting the center point for the DOM. When the last price (or midpoint) crosses the top or bottom of the range the DOM will be centered on the current price.
Re-center All DOMs – If one DOM is re-centered, the other will be as well.
Update Interval – Sets the update threshold for depth of market updates (bid/ask quantities). By default, the table will be updated a maximum of once every 200 milliseconds.
Location – Select the location of the DOM. Options are right or left of the chart.
Exit Attach – When using an exit strategy and click attach (paper clip button) to attach an exit strategy to an existing position. You can attach based on average entry price or the last price.
Show Tool Bar – Toggles the display of the tool bar at the top of the DOM panel. If this is turned off, the preferences button (gear icon) will display in the button bar at the bottom.
Show Quantity Selector – Toggles the display of the preset order quantities.
Locked – If the DOM is locked, you cannot place or modify orders. Uncheck this option if you want to manage orders in the DOM.
Show Order Ticket Window – Displays the order ticket window when placing an order from the DOM.
Double Click to Place Order – Place orders on double click (as opposed to single click).
Show Grid – Toggles the display of the grid in the DOM table.
Show Totals – Toggles the display of the totals for Bid/Ask Sizes and the delta at the bottom of the DOM table.
Single Order Column – Displays all orders in a single column (instead of having separate buy and sell order columns).
Show Filled Orders – Displays filled orders in the order column(s).
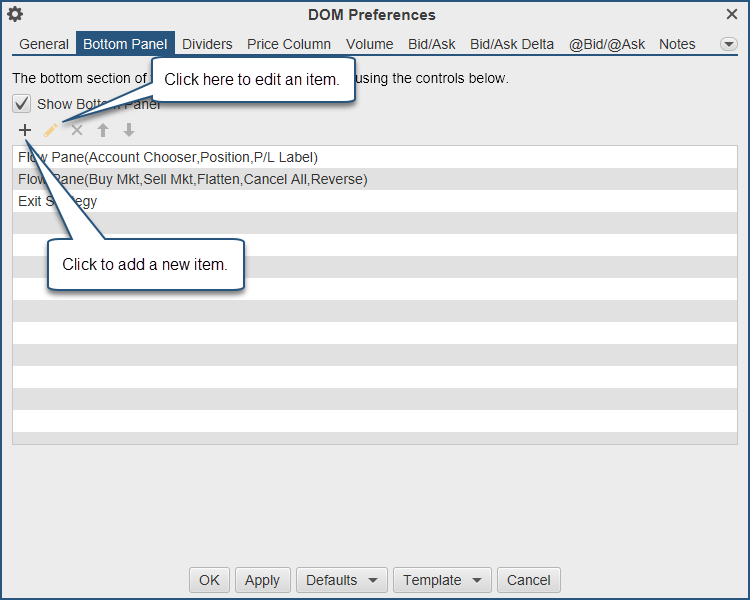
Bottom Panel
The bottom panel in the DOM can be configured to add and remove buttons including the creating of custom buttons. Configuring the bottom panel is only available in the Professional and Ultimate Editions.
Show Bottom Panel – Toggles the display of the bottom panel.
+ Icon – Click to add a new item.
Pencil Icon – Click here to edit the selected item.
X Icon – Delete the selected item.
Up/Down Icons – Move the items up or down in the panel.
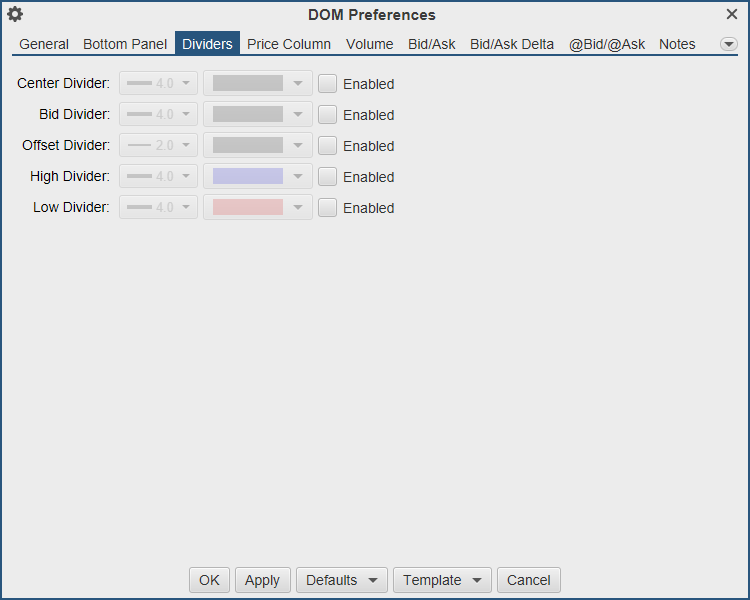
Dividers
Dividers may be used to highlight key price levels in the DOM table. The divider is placed between the rows and can be assigned a thickness and color:
Center – Center of the DOM. This will change when the DOM is re-centered.
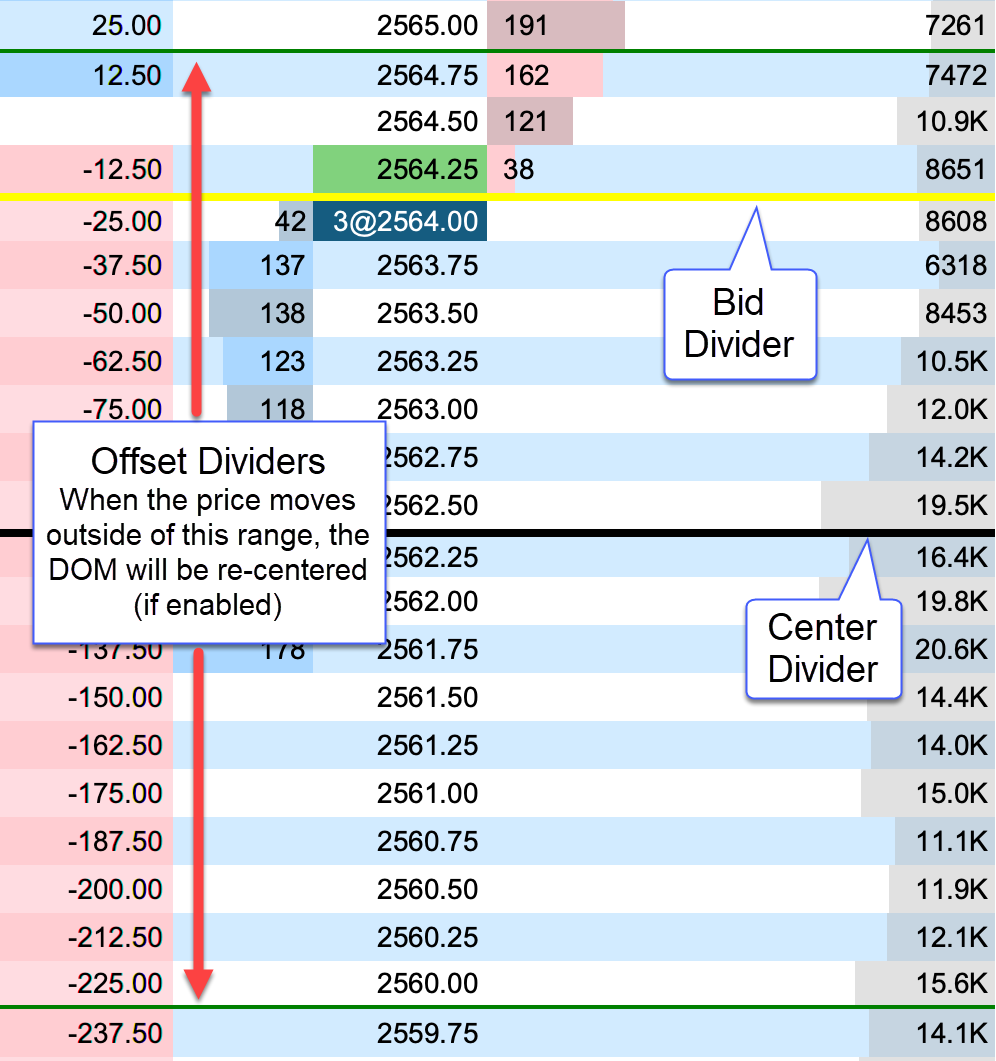
Bid – Divider is placed just above the current bid price.
Offset – Shows the re-center threshold above and below the center price (see re-center option in General tab).
High – Daily high price. The divider is placed above this row.
Low – Daily low price. The divider is placed below this row.
The example below shows the bid, center and offset dividers enabled in the DOM. The offset dividers indicate when a re-center will occur (green dividers below).
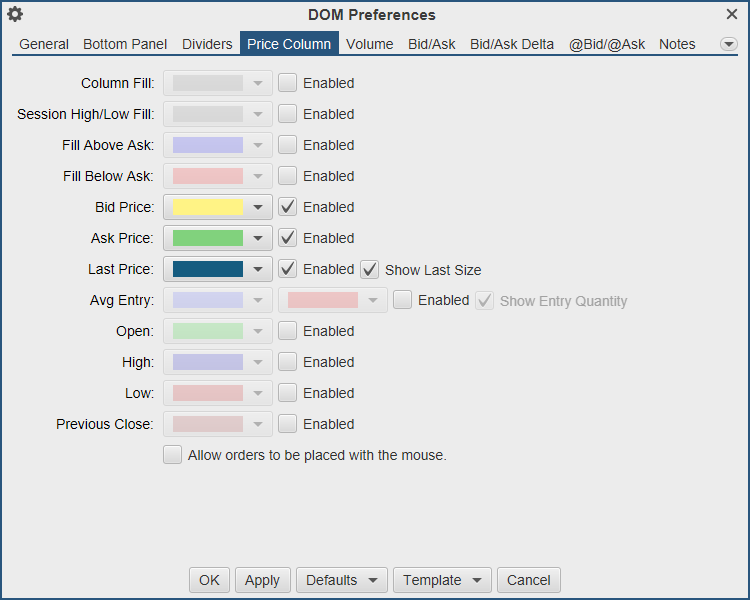
Price Column
Below are the options available for configuring the price column. Note: background fills that span several rows will use striping to help visualize the distinction between rows in the table:
Column Fill – Default background fill for price column. This is the color used to fill the price cells unless they are overridden by another setting.
Session High/Low Fill – Fill for the price rows that are between the high and low for the day’s trading session.
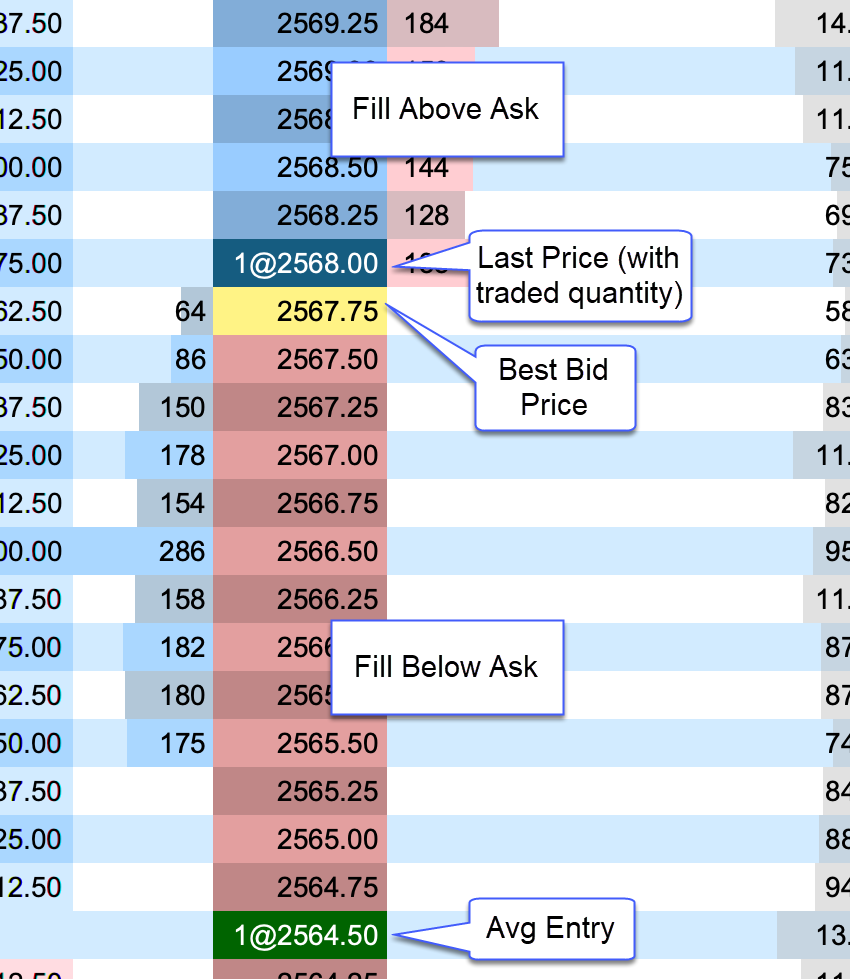
Fill Above Ask – Fill for the prices above the current ask price.
Fill Below Ask – Fill for the prices below the current bid price.
Bid Price – Fill for the cell that contains the current bid price.
Ask Price – Fill for the cell that contains the current ask price.
Last Price – Fill for the cell that contains the last traded price. If “Show Last Size” is enabled, it will be added to the price cell. For example, [email protected].
Avg Entry – Highlight for the price cell that contains the avg entry price for your open position. There are two color options. The first is for a long position and the second is for a short position. If “Show Entry Quantity” is enabled, it will be added to the price cell. For example, [email protected]
Open – Fill for the opening price for the day.
High – Fill for the highest traded price for the day.
Low – Fill for the lowest traded price for the day.
Previous Close – Fill for the closing price from the previous day.
Allow orders to be placed with the mouse – Select this to place orders from the price column.
The example below shows some shading options for the price column:
Volume
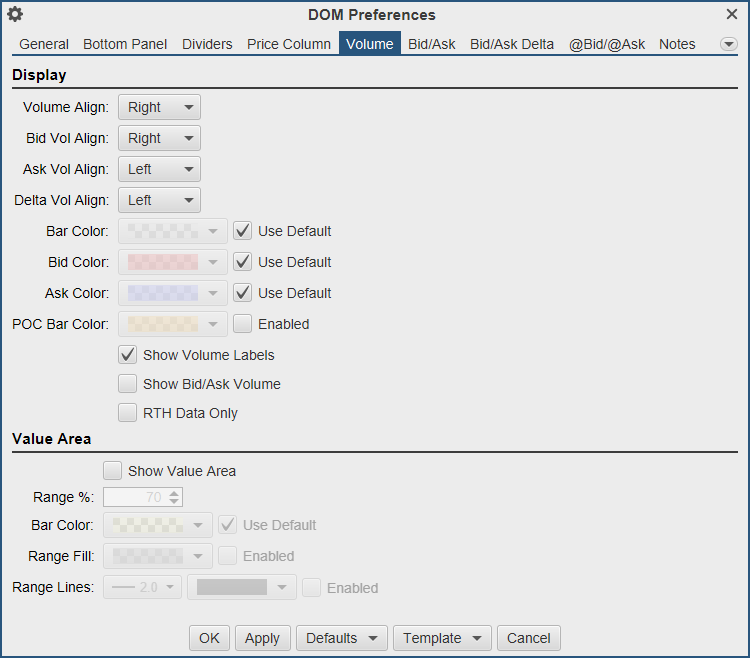
The volume-based columns (Volume, Bid Vol, Ask Vol and Delta Vol) may be customized from the Volume tab:
Display Section:
Volume Align – Cell alignment for the Volume column.
Bid Vol Align – Cell alignment for the Bid Vol column.
Ask Vol Align – Cell alignment for the Ask Vol column.
Delta Vol Align – Cell alignment for the Delta Vol column.
Bar Color – Bar color for the Volume column. This is not used if Show Bid/Ask Volume is checked
Bid Color – Bar color for the Bid Vol column. If Show Bid/Ask Volume is checked, this will be the fill for the bid volume portion in the Volume column.
Ask Color – Bar color for the Ask Vol column. If Show Bid/Ask Volume is checked, this will be the fill for the ask volume portion in the Volume column.
POC Bar Color – Color for the Point of Control cell (highest volume) in the DOM Table.
Show Volume Labels – Toggles the display of the text labels in the volume columns.
Show Bid/Ask Volume – Toggles the display of bid/ask volume for the Volume column. If this is selected each bar in the Volume column will be divided into bid and ask volume.
RTH Data Only – Only display volume profile for the RTH session.
Value Area Section:
The value area identifies the rows surrounding the Point of Control (POC) (row with the highest volume) that encompass X% (typically 70%) of the total trading volume (for the day).
Show Value Area – Toggles the display of the value area.
Range % - Percentage of the volume to include in the value area.
Bar Color – Shade color for the bars that are part of the value area. Typically, this is a semi-transparent color if you want to highlight bid/ask volume at the same time.
Range Fill – Background fill for the cells that are part of the value area.
Range Lines – Displays dividers at the top and bottom of the value area.
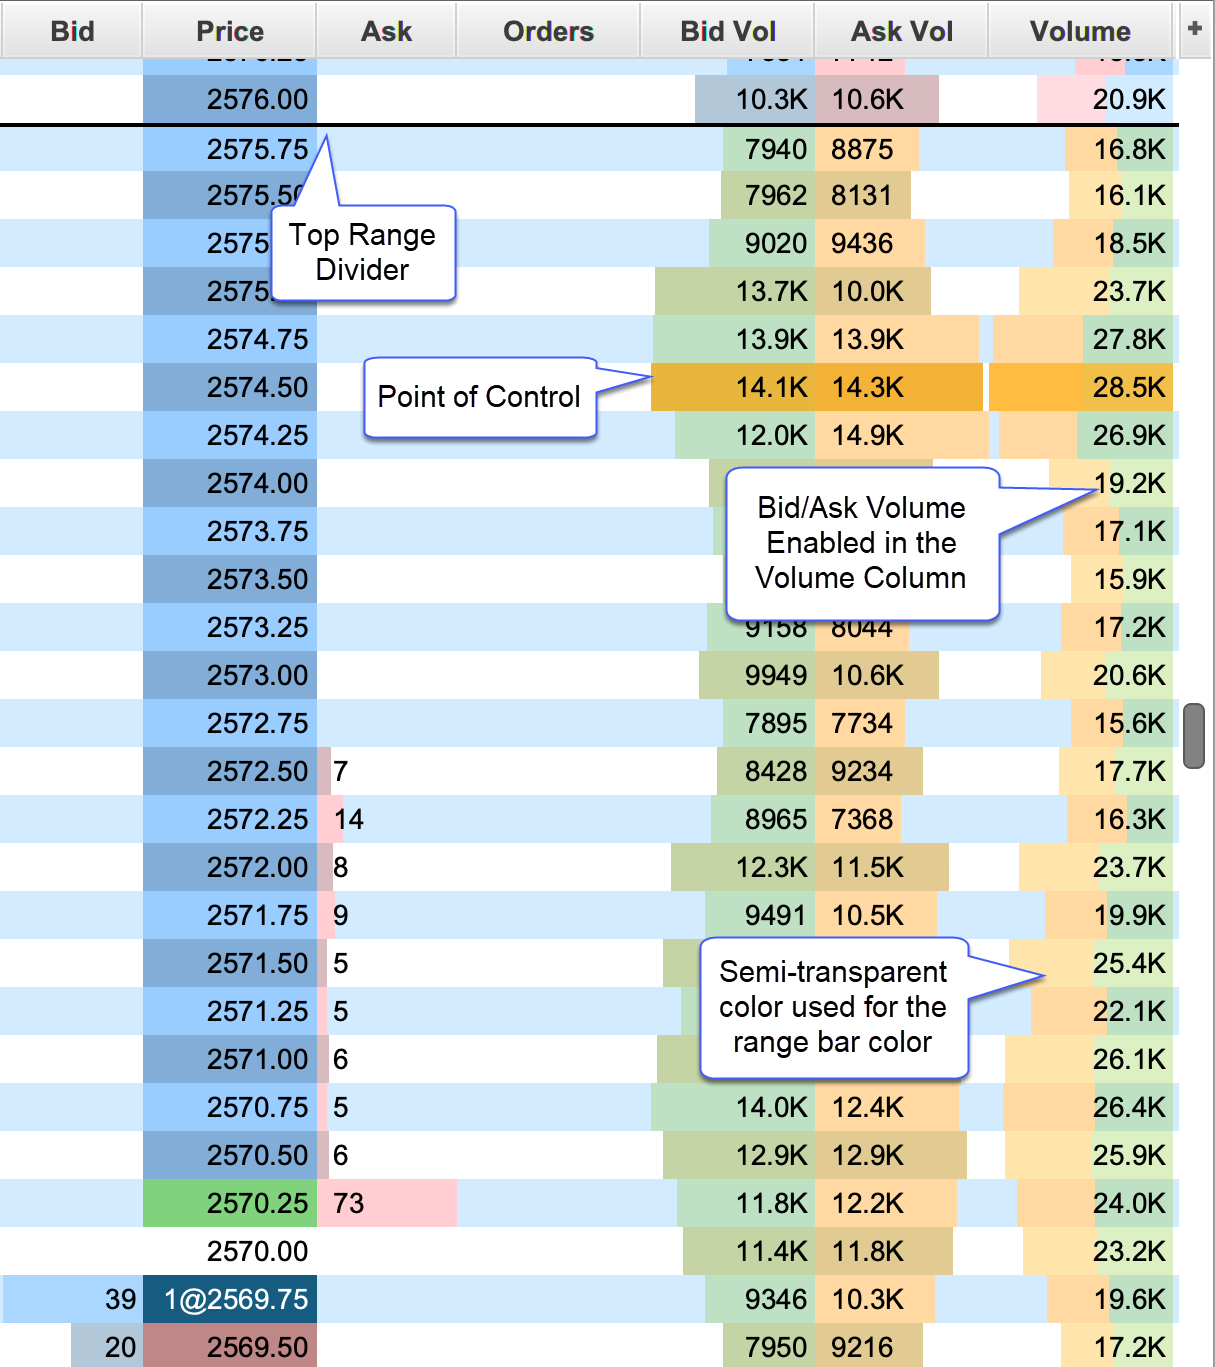
The example below shows the Bid Vol/Ask Vol and Volume columns in the DOM table. The Value Area (Show Value Area check box) has been enabled and the “Show Bid/Ask Volume” has also been enabled for the Volume column.
Bid/Ask
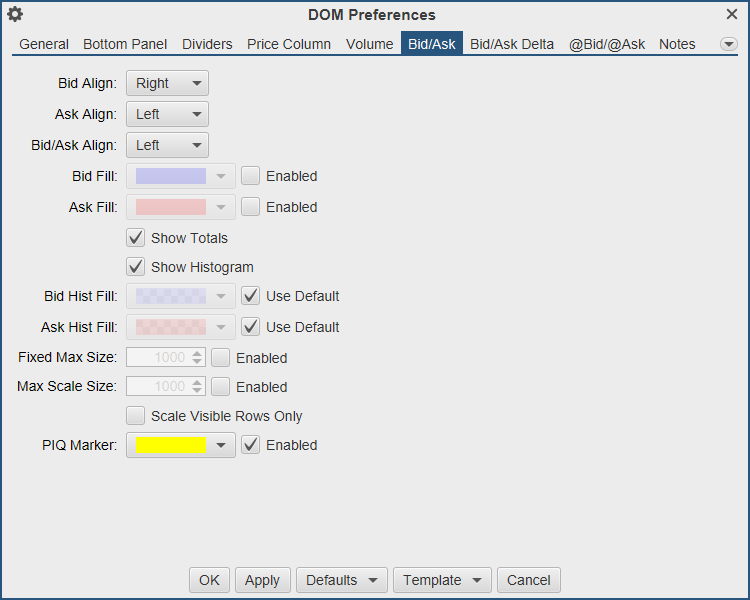
The Bid/Ask columns display total quantity of the active buy and sell orders at each price level. The number of depth rows available depends on the on the instrument, but is typically 10 prices levels for each of the bid and ask columns (total of 20 price rows). An optional histogram can be displayed to help visualize how the quantities are distributed.
Bid Align – Alignment of the Bid column.
Ask Align – Alignment of the Ask column.
Bid/Ask Align – Alignment of the Bid/Ask column.
Bid Fill – Fill color for the bid column (striping will be applied).
Ask Fill – Fill color for the ask column (striping will be applied).
Show Totals – Displays the total quantity for the bid and ask columns in the bottom panel.
Show Histogram – Shows the histogram for both the Bid and Ask columns using the Bid/Ask Align settings above.
Bid Hist Fill – Fill color for the Bid histogram.
Ask Hist Fill – Fill color for the Ask histogram.
Fixed Max Size – Sets the maximum size for the bid/ask columns to a fixed value.
Max Scale Size – Sets an upper limit on the max bid/ask sizes. Use this to lessen the effect of unusually large bid/ask values on the histogram.
Scale Visible Rows Only – Scale the bid /ask histogram on only the visible rows.
Place In Queue (PIQ) Marker – Enable the PIQ marker for your limit orders.
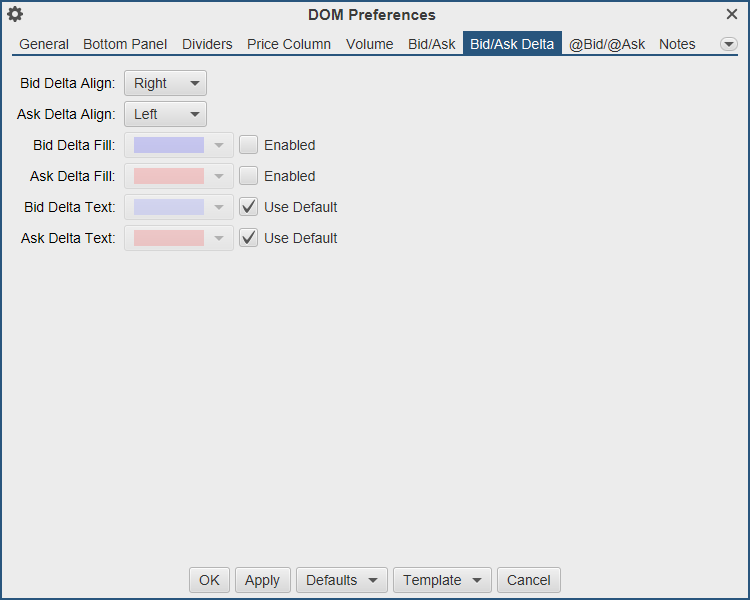
Bid/Ask Delta
The Bid Delta and Ask Delta columns display the difference in the Bid/Ask quantities at each price level since the last price changed. These values are updated with each depth book update.
Bid Delta Align – Alignment for the Bid Delta column.
Ask Delta Align – Alignment for the Ask Delta column.
Bid Delta Fill – Background fill color for the Bid Delta column (striping will be applied).
Ask Delta Fill – Background fill color for the Ask Delta column (striping will be applied).
Bid Delta Text – Text color for the Bid Delta column.
Ask Delta Text – Text color for the Ask Delta column.
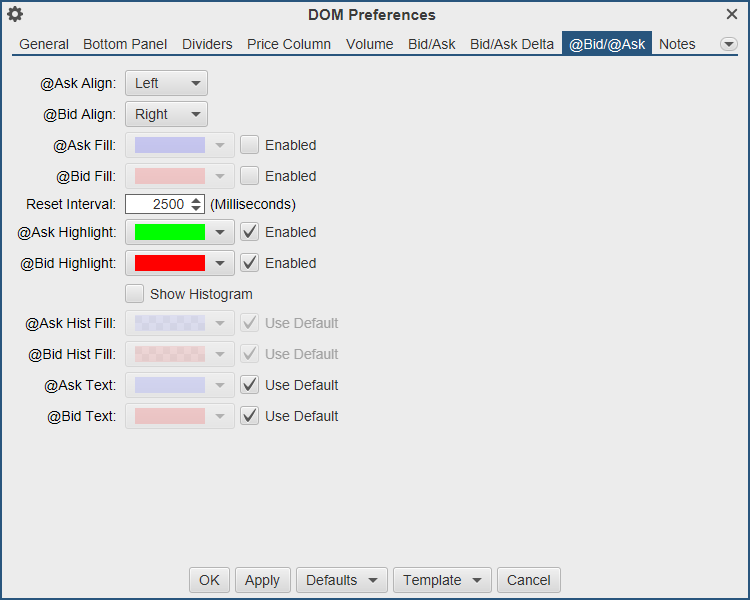
@Bid/@Ask
The @Bid and @Ask columns track the bid and ask volume at each price level since the last reset. These columns can be reset manually by pressing the reset button in the tool bar.
@Ask Align – Alignment of the @Ask column.
@Bid Align – Alignment of the @Bid column.
@Ask Fill – Background fill color for the @Ask column (striping will apply).
@Bid Fill – Background fill color for the @Bid column (striping will apply).
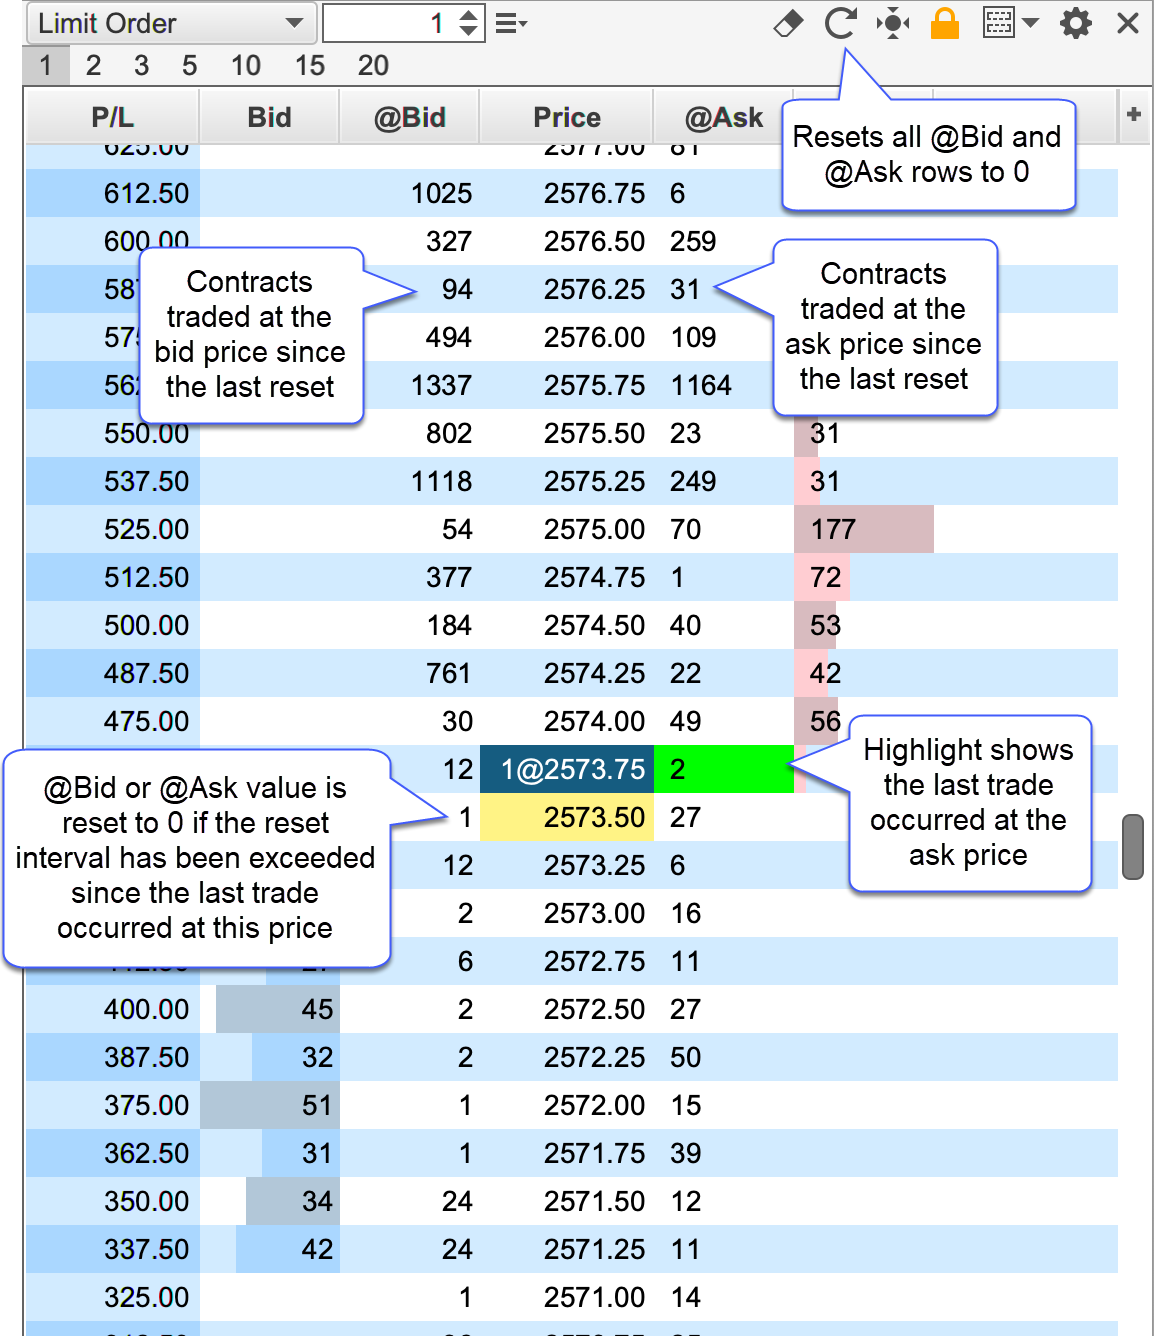
Reset Interval – The DOM panel tracks how long it’s been since a trade occurred at each price level. The @Bid (on bid trade) or @Ask (on ask trade) value is reset to 0 when the elapsed time exceeds the reset interval. For example, consider a case where the DOM panel is showing 1164 contracts traded at an ask price of 2575.50 (since the last reset). When the next trade that occurs at the ask for 2575.50 and the elapsed time exceeds the reset interval, the @Ask value will be reset to 0 before adding the new ask volume.
@Ask Highlight – Highlight color for the @Ask cell when the last trade occurs at the ask price. The highlight is cleared on the next trade.
@Bid Highlight– Highlight color for the @Bid cell when the last trade occurs at the bid price. The highlight is cleared on the next trade.
Show Histogram – Toggles the display of the histogram for the @Bid/@Ask columns.
@Ask Hist Fill – Fill color for the @Ask histogram (striping will apply).
@Bid Hist Fill – Fill color for the @Bid histogram (striping will apply).
@Ask Text – Text color for the @Ask column.
@Bid Text – Text color for the @Bid column.
The example below shows the @Bid and @Ask columns displayed in the DOM panel. Since the last trade occurred at the ask price, the @Ask cell is highlighted green (where the trade occurred).
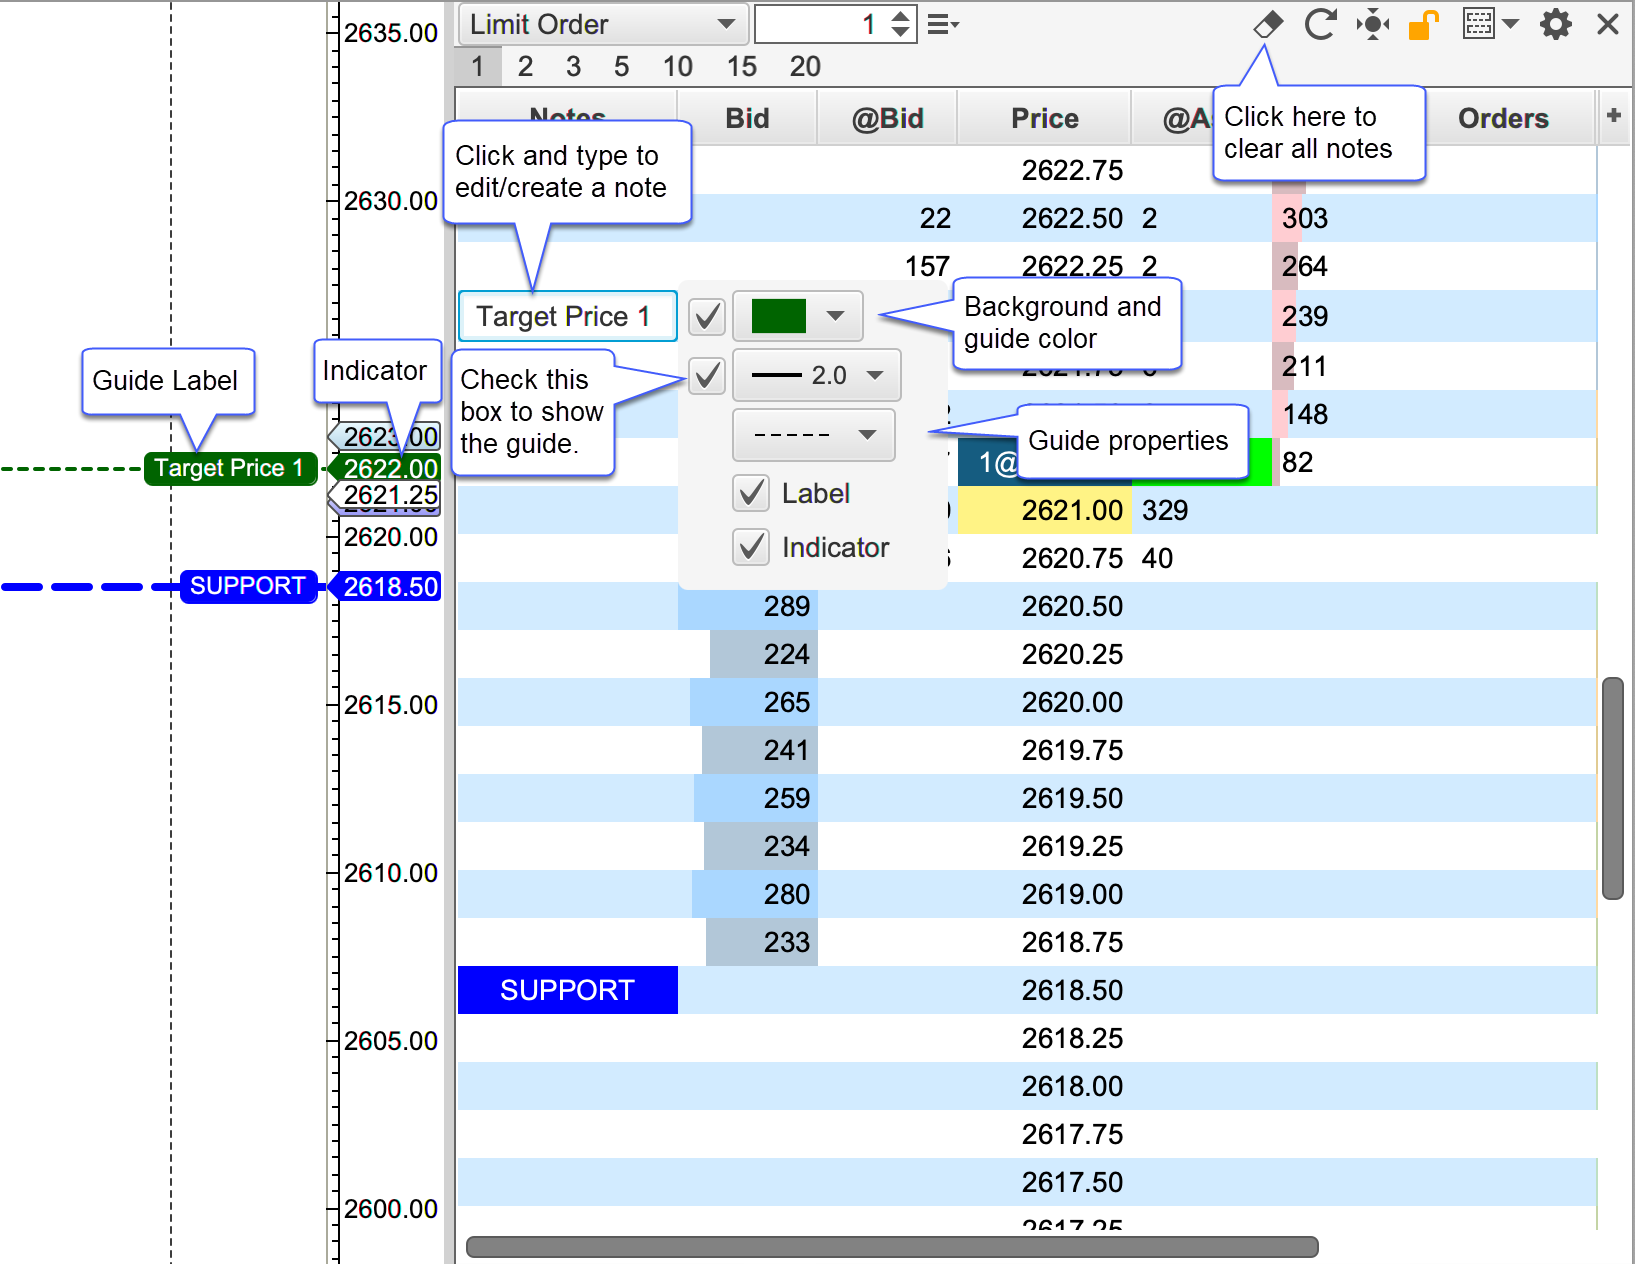
Notes
The Notes column allows you to type a custom note for any price level. Notes are persisted when restarting MotiveWave™. For convenience all notes can be removed by pressing the eraser button in the tool bar (see below). If the DOM is attached to a chart, a guide may optionally be placed in the chart for each note. The guides and notes are synchronized between the DOM and the chart. Moving or removing a guide in the chart will affect the note in the DOM (and vice versa). The screen shot below illustrates some of the options available when adding or editing a note.
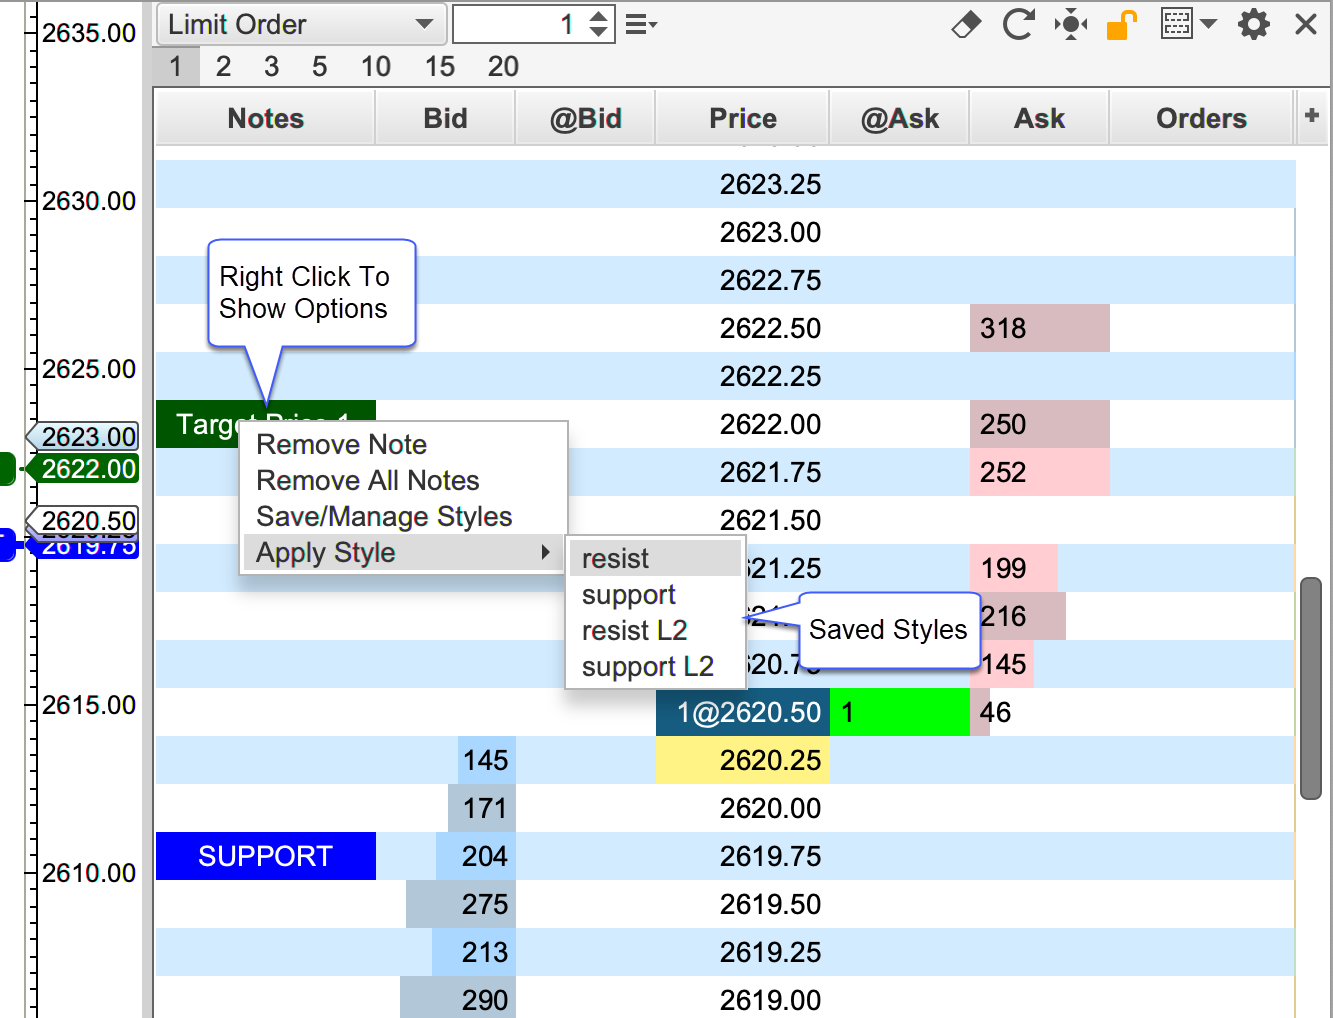
Note Styles
For convenience, notes including their formatting and guide settings may be saved as a style that can be applied later. Right click on an existing note to save or manage existing styles. An existing style can be applied to a note from the Apply Style menu.
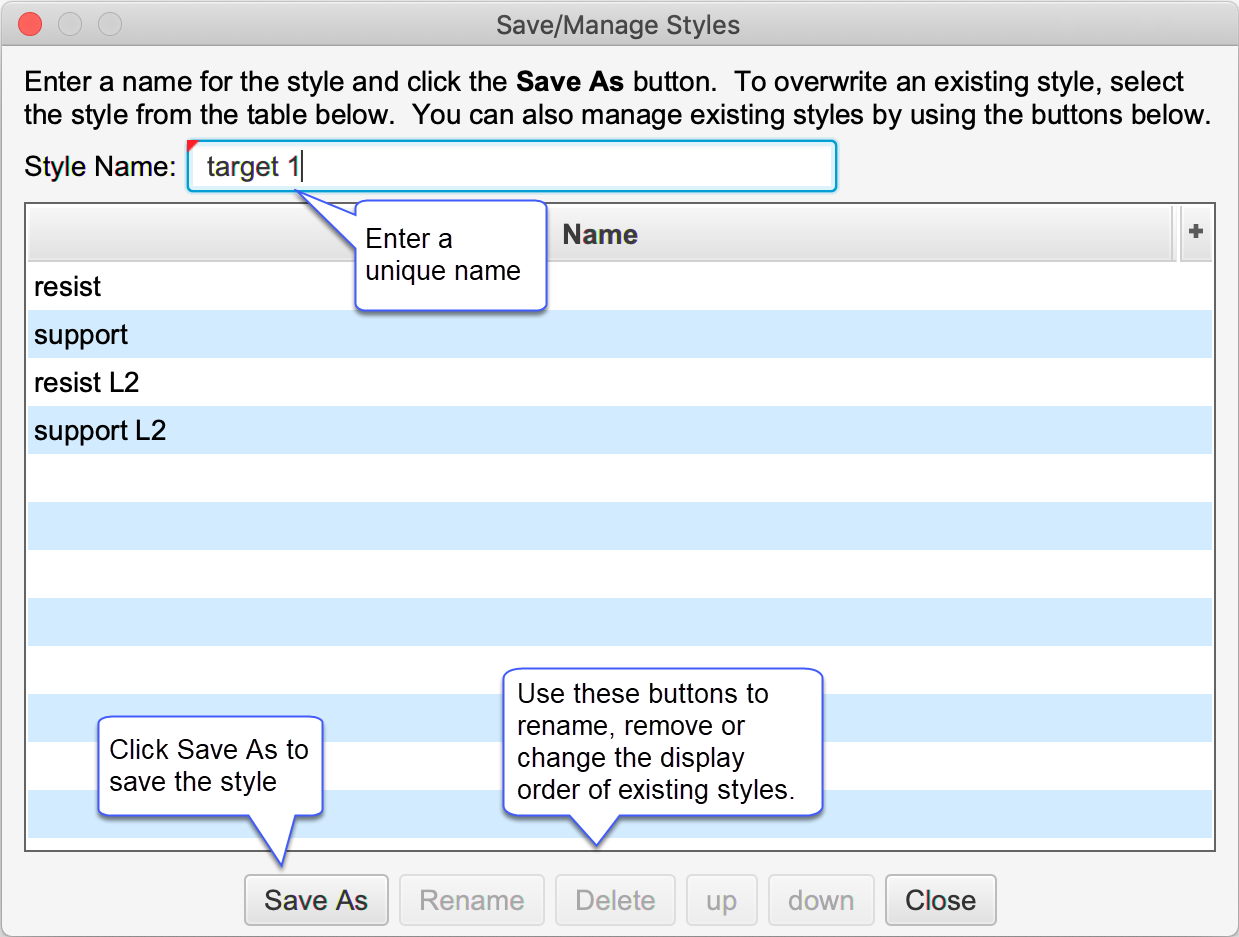
The dialog below will appear if you choose the Save/Manage Styles option. From this dialog, you can save a style and or manage existing styles. Use the up/down buttons to change the display order in the Apply Styles menu.
Note Preferences and Defaults
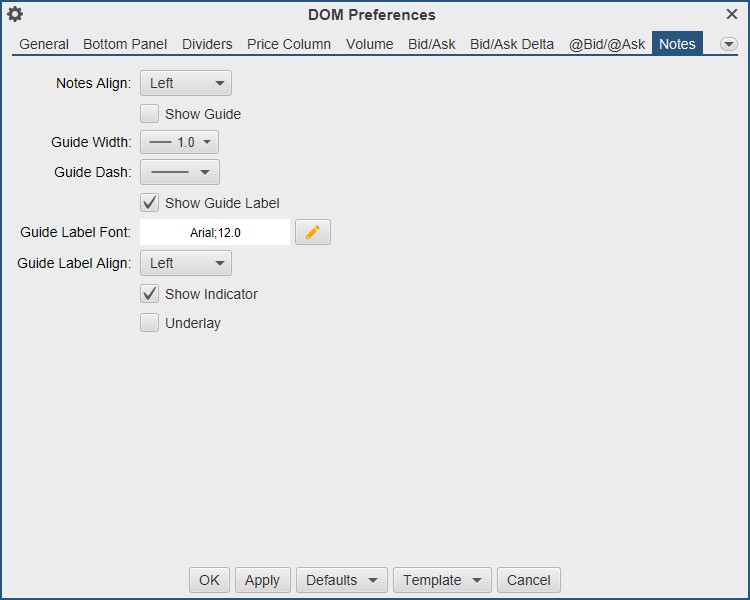
Note settings can be configured in the DOM Preferences dialog under the Notes tab:
Notes Align – Cell alignment for the Notes column.
Show Guide – This is the default setting for the showing the guide in the chart. This only applies to a DOM that is attached to a chart.
Guide Width – Default width for the guide line.
Guide Dash – Default dash pattern for the guide line.
Show Guide Label – Default setting for showing the label in the guide. The label will contain the same text in the Notes column.
Guide Label Font – Font for the guide labels.
Guide Label Align – Alignment for the guide labels.
Show Indicator – Default setting for showing the guide indicator in the price axis.
Underlay – Optionally draws the guides behind the price bars. This will also draw the guide indicators behind the other indicators on the chart.
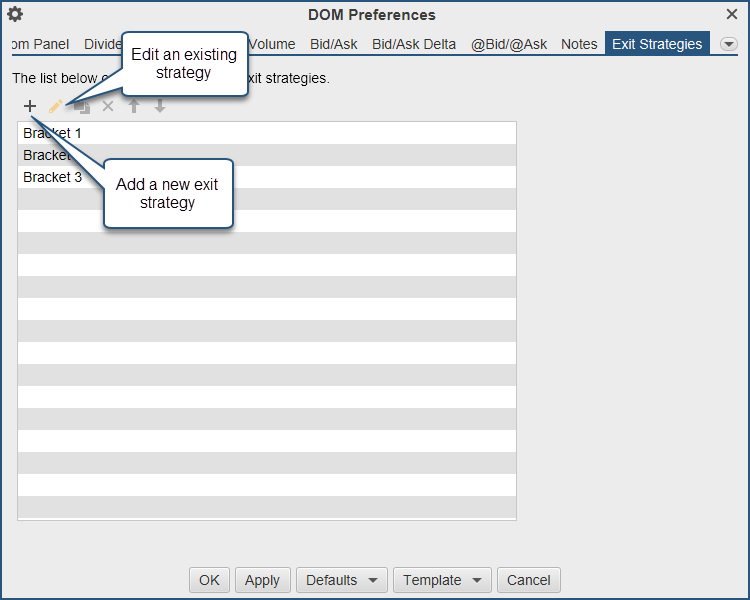
Exit Strategies
Exit strategies define how a position will be closed using a combination of one or more orders.
+ Icon – Click to add a new item.
Pencil Icon – Click here to edit the selected item.
Paper Icon – Copy an exit strategy.
X Icon – Delete the selected item.
Up/Down Icons – Move the items up or down in the panel.
Templates
Templates allow you to save a specific configuration for later use. A DOM template includes the following:
Width – Width of the DOM panel.
Table Columns – Visible table columns and widths.
Configuration Settings – All settings in the DOM Preferences dialog.
Templates can be saved, managed and applied from the tool bar or the DOM Preferences dialog.
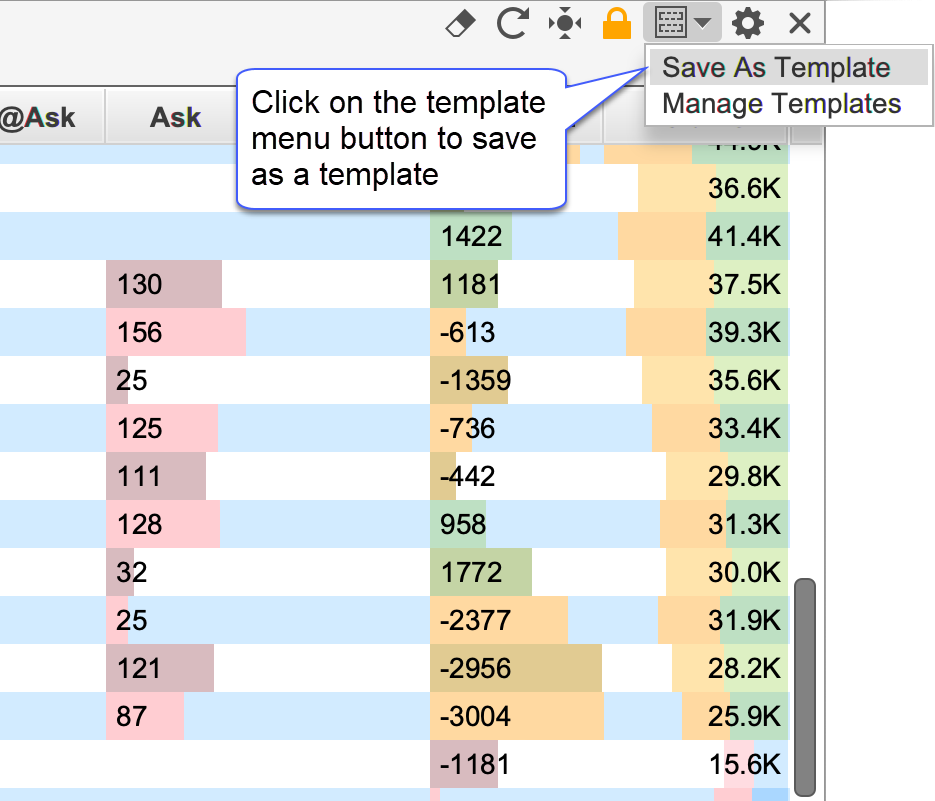
Saving Templates
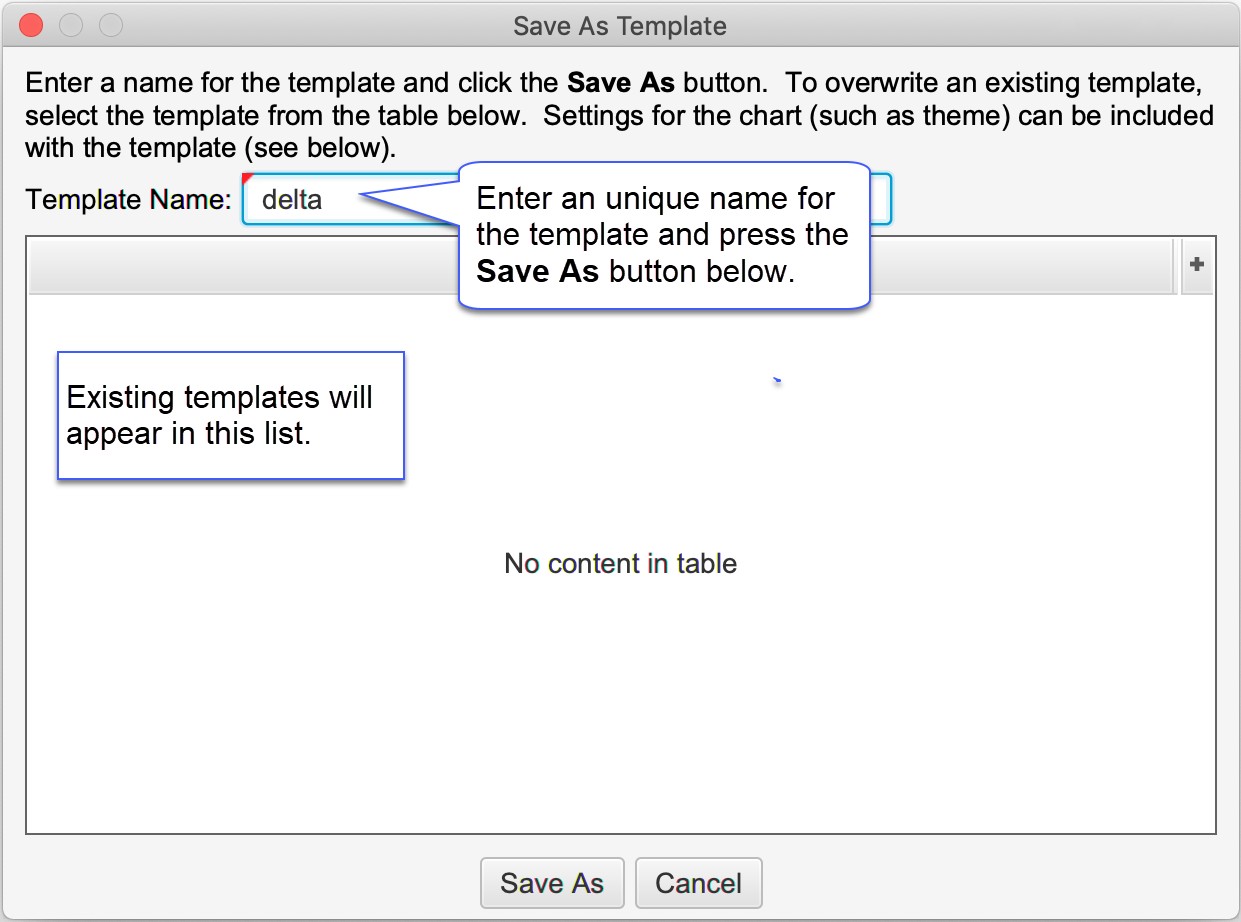
From the tool bar, click on the Templates menu button (see screen shot below) and choose the Save As Template option. Alternatively, this can be done from the DOM preferences dialog (see Template menu button at the bottom of the dialog).
Enter a unique name for the template and press the Save As button at the bottom of the dialog. Existing templates will be displayed in the list box. You can overwrite an existing template by selecting it.
Managing Templates
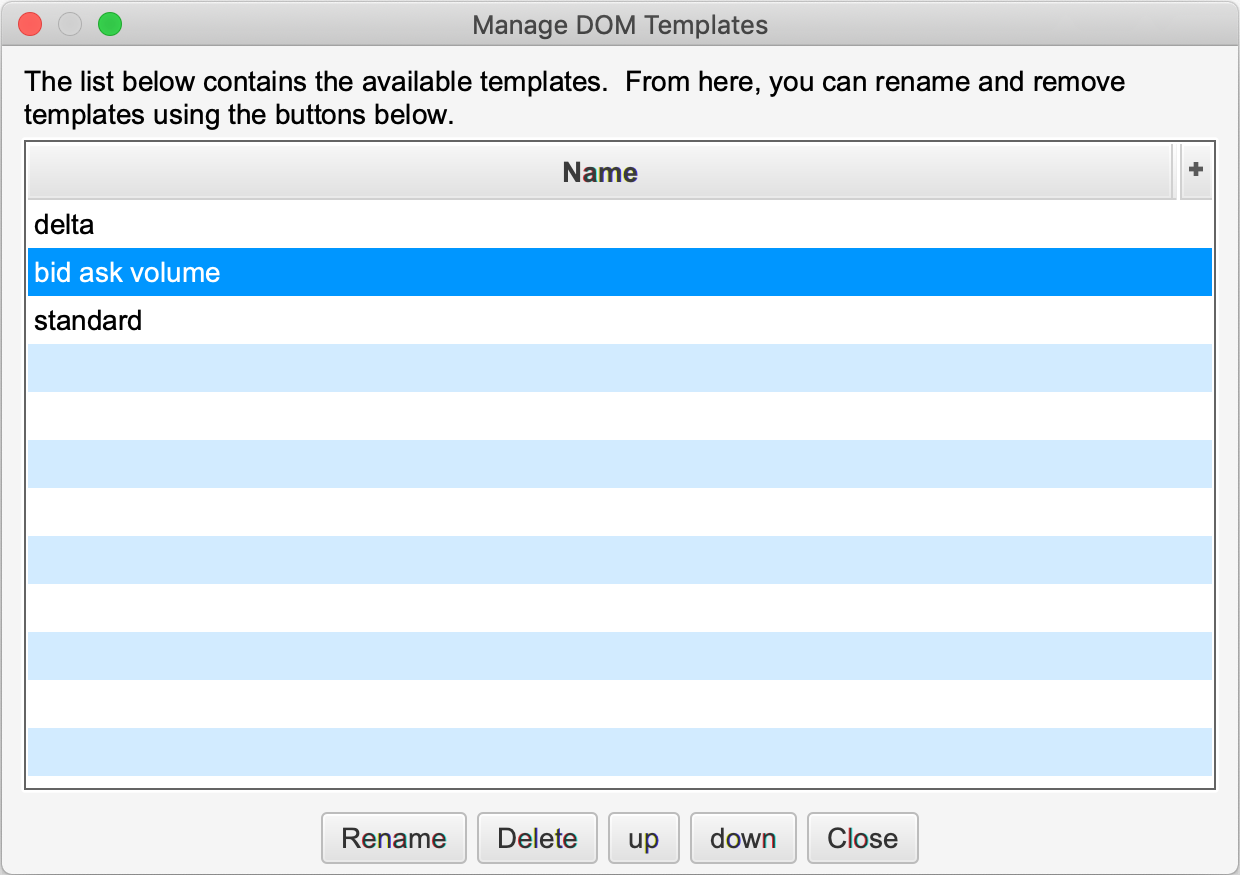
The Manage Templates option will open the dialog below. This dialog will allow to you to rename templates, delete them or change the order in which they appear in the templates drop down.
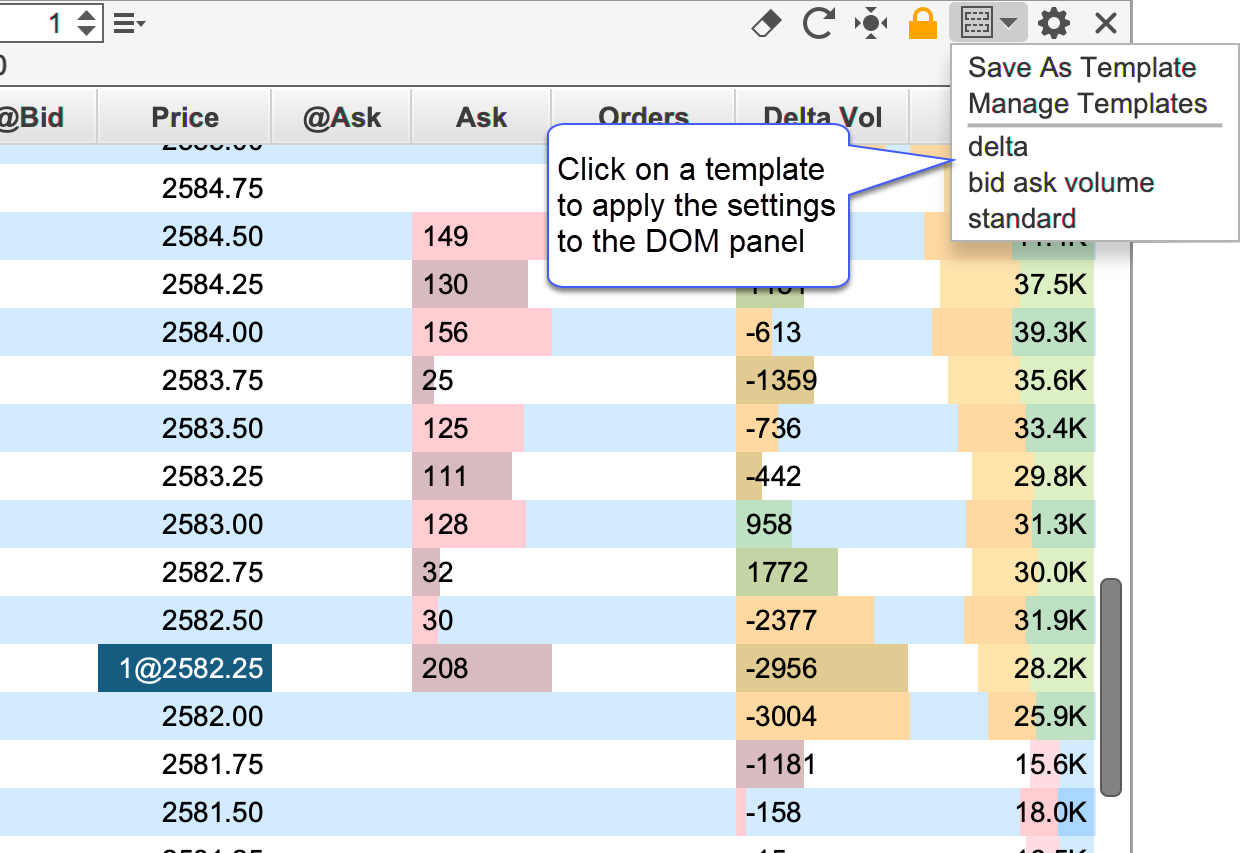
Applying Templates
A template can be applied to the DOM panel with 2 mouse clicks. Open the templates drop down and select the name of the template you would like to apply. The settings from the template (including the width of the panel and visible columns) will be applied.
Market By Order
Market by Order displays individual order sizes in the Bid/Ask Columns (currently Rithmic connections only). For more details on Market By Order, see: https://www.cmegroup.com/education/market-by-order-mbo.html Note: this information is also available in the SDK.
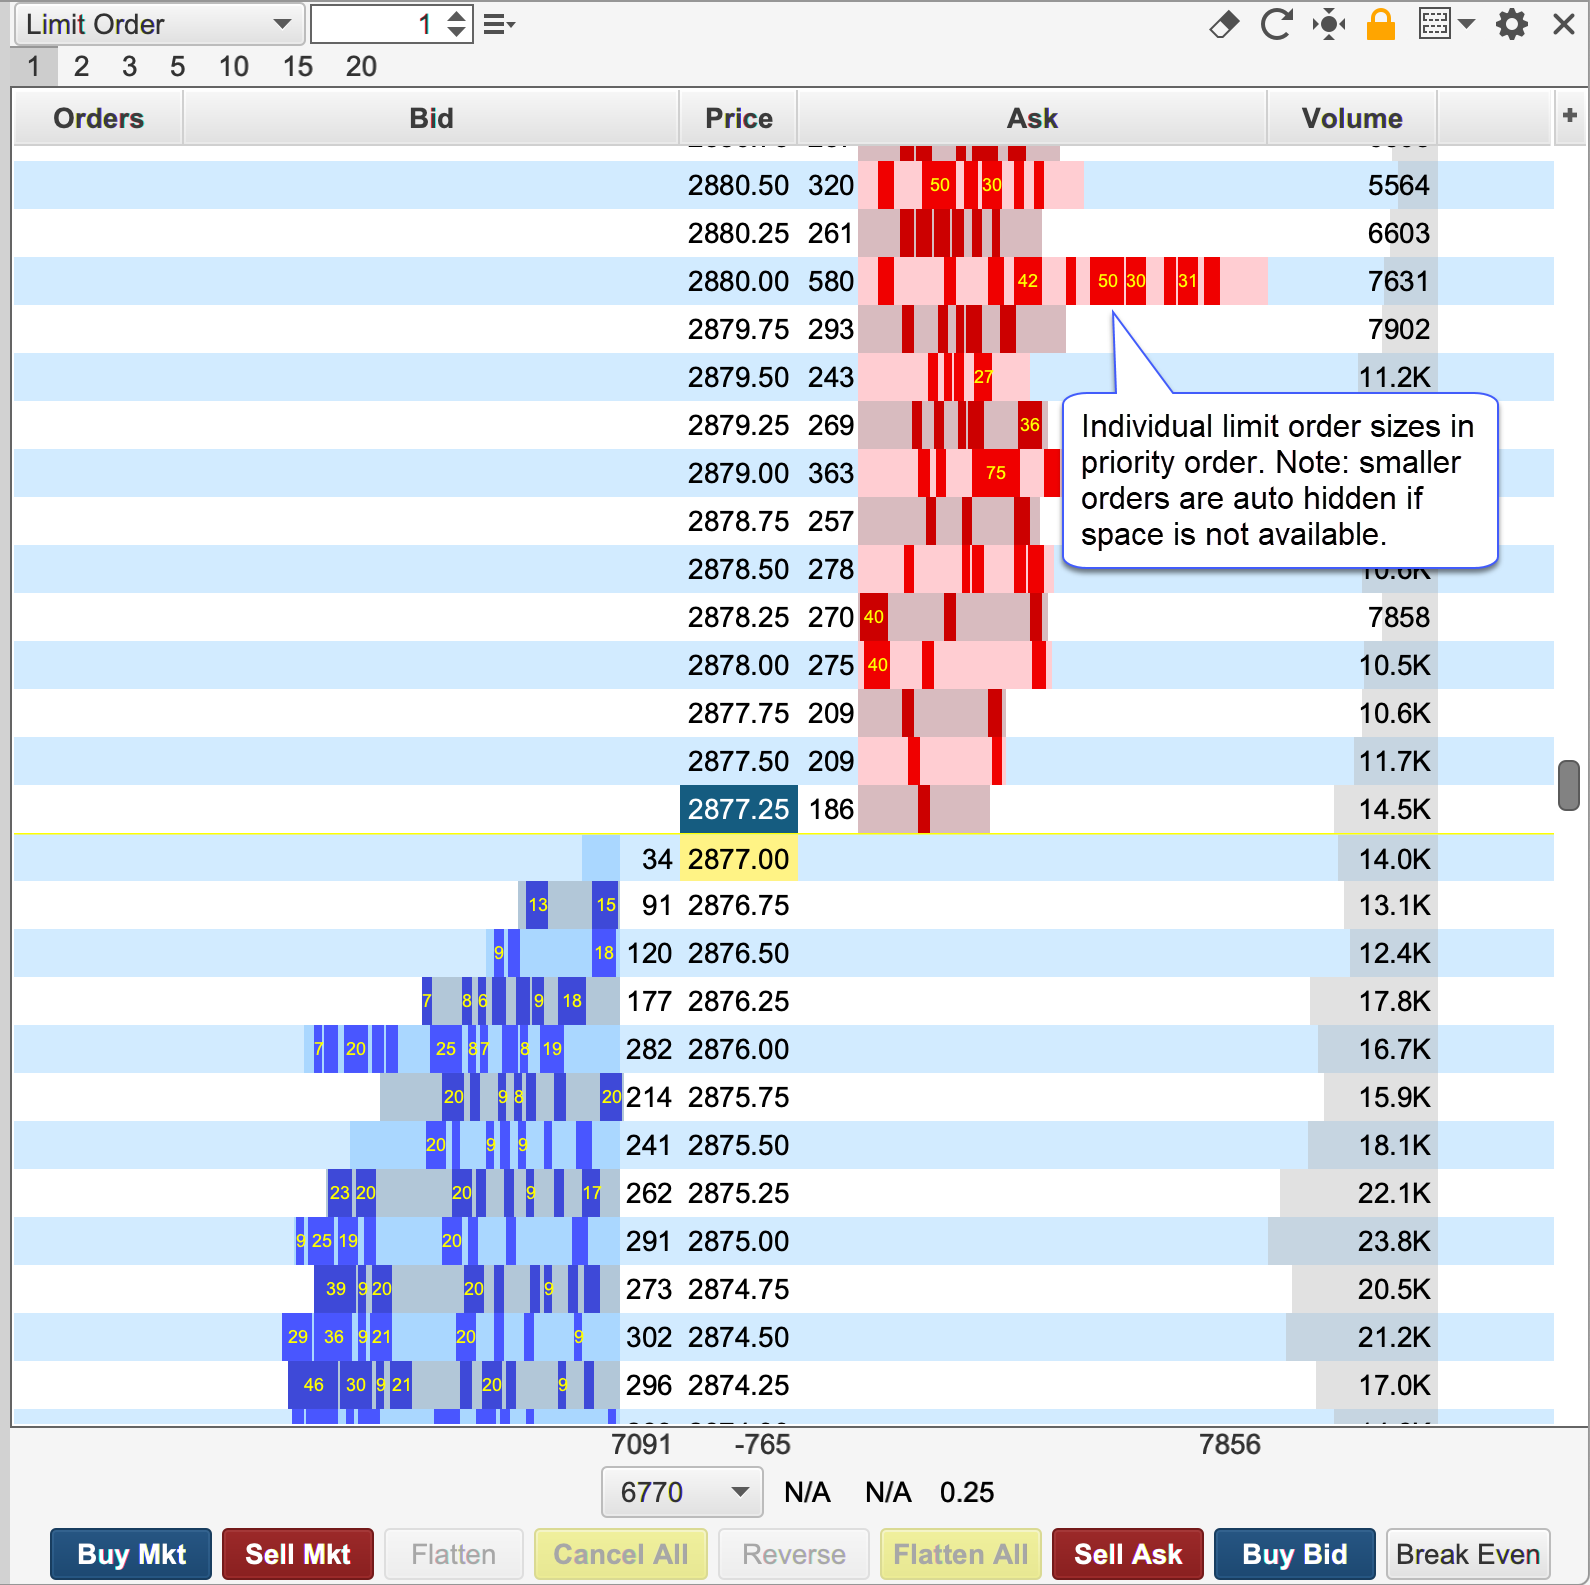
The screen shot below shows an example of the Market by Order feature on the S&P E-mini contract. Limit order sizes are displayed in priority order. Smaller order sizes are auto hidden for simplicity. If you would like to see more detail, increase the width of the Bid or Ask columns by clicking/dragging the edge of the column in the table header.
Configuration settings for this feature can be found in the Bid/Ask tab of the DOM Preferences Dialog (click on the Gear icon in the tool bar).
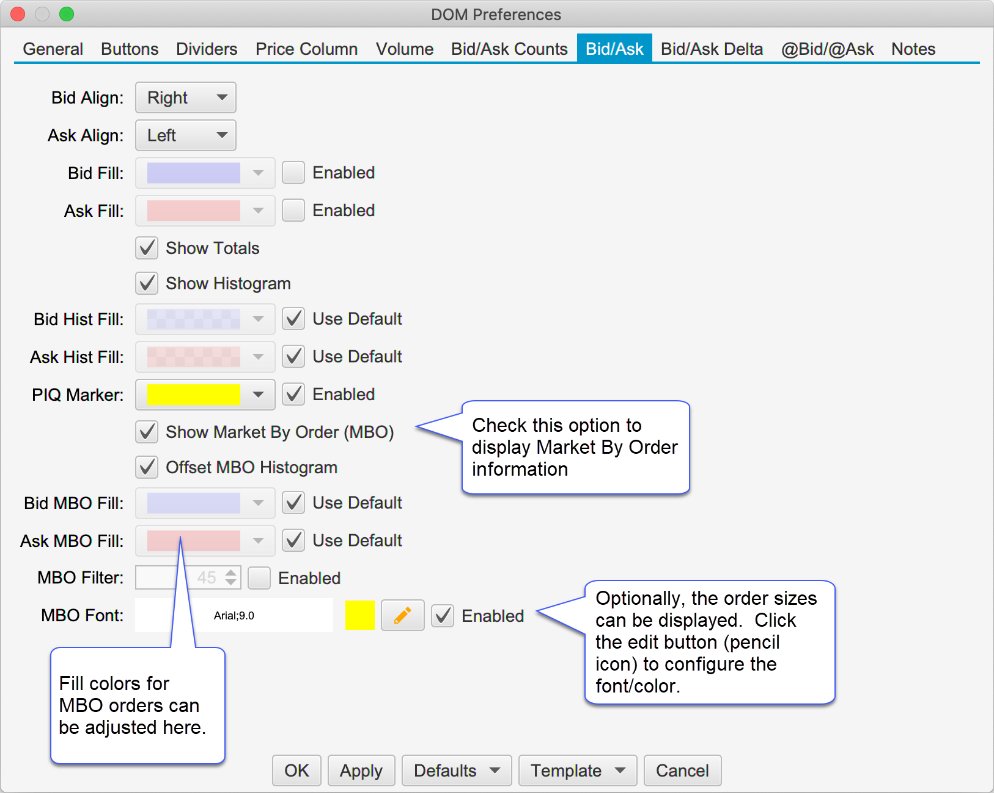
The following options are available for configuring Market by Order:
Show Market by Order (MBO) – Toggles the display of the order sizes in the Bid and Ask columns.
Offset MBO Histogram – Offsets the histogram to the left/right of the Bid or ask size to avoid obscuring order sizes at the front of the priority queue.
Bid MBO Fill – Fill color for visible order sizes in the Bid column
Ask MBO Fill – Fill color for the visible order sizes in the Ask Column
MBO Filter – Optionally, filters orders that are smaller than the given size
MBO Font – Optionally display the order size (if space available). Click on the edit button to configure the font size/color.
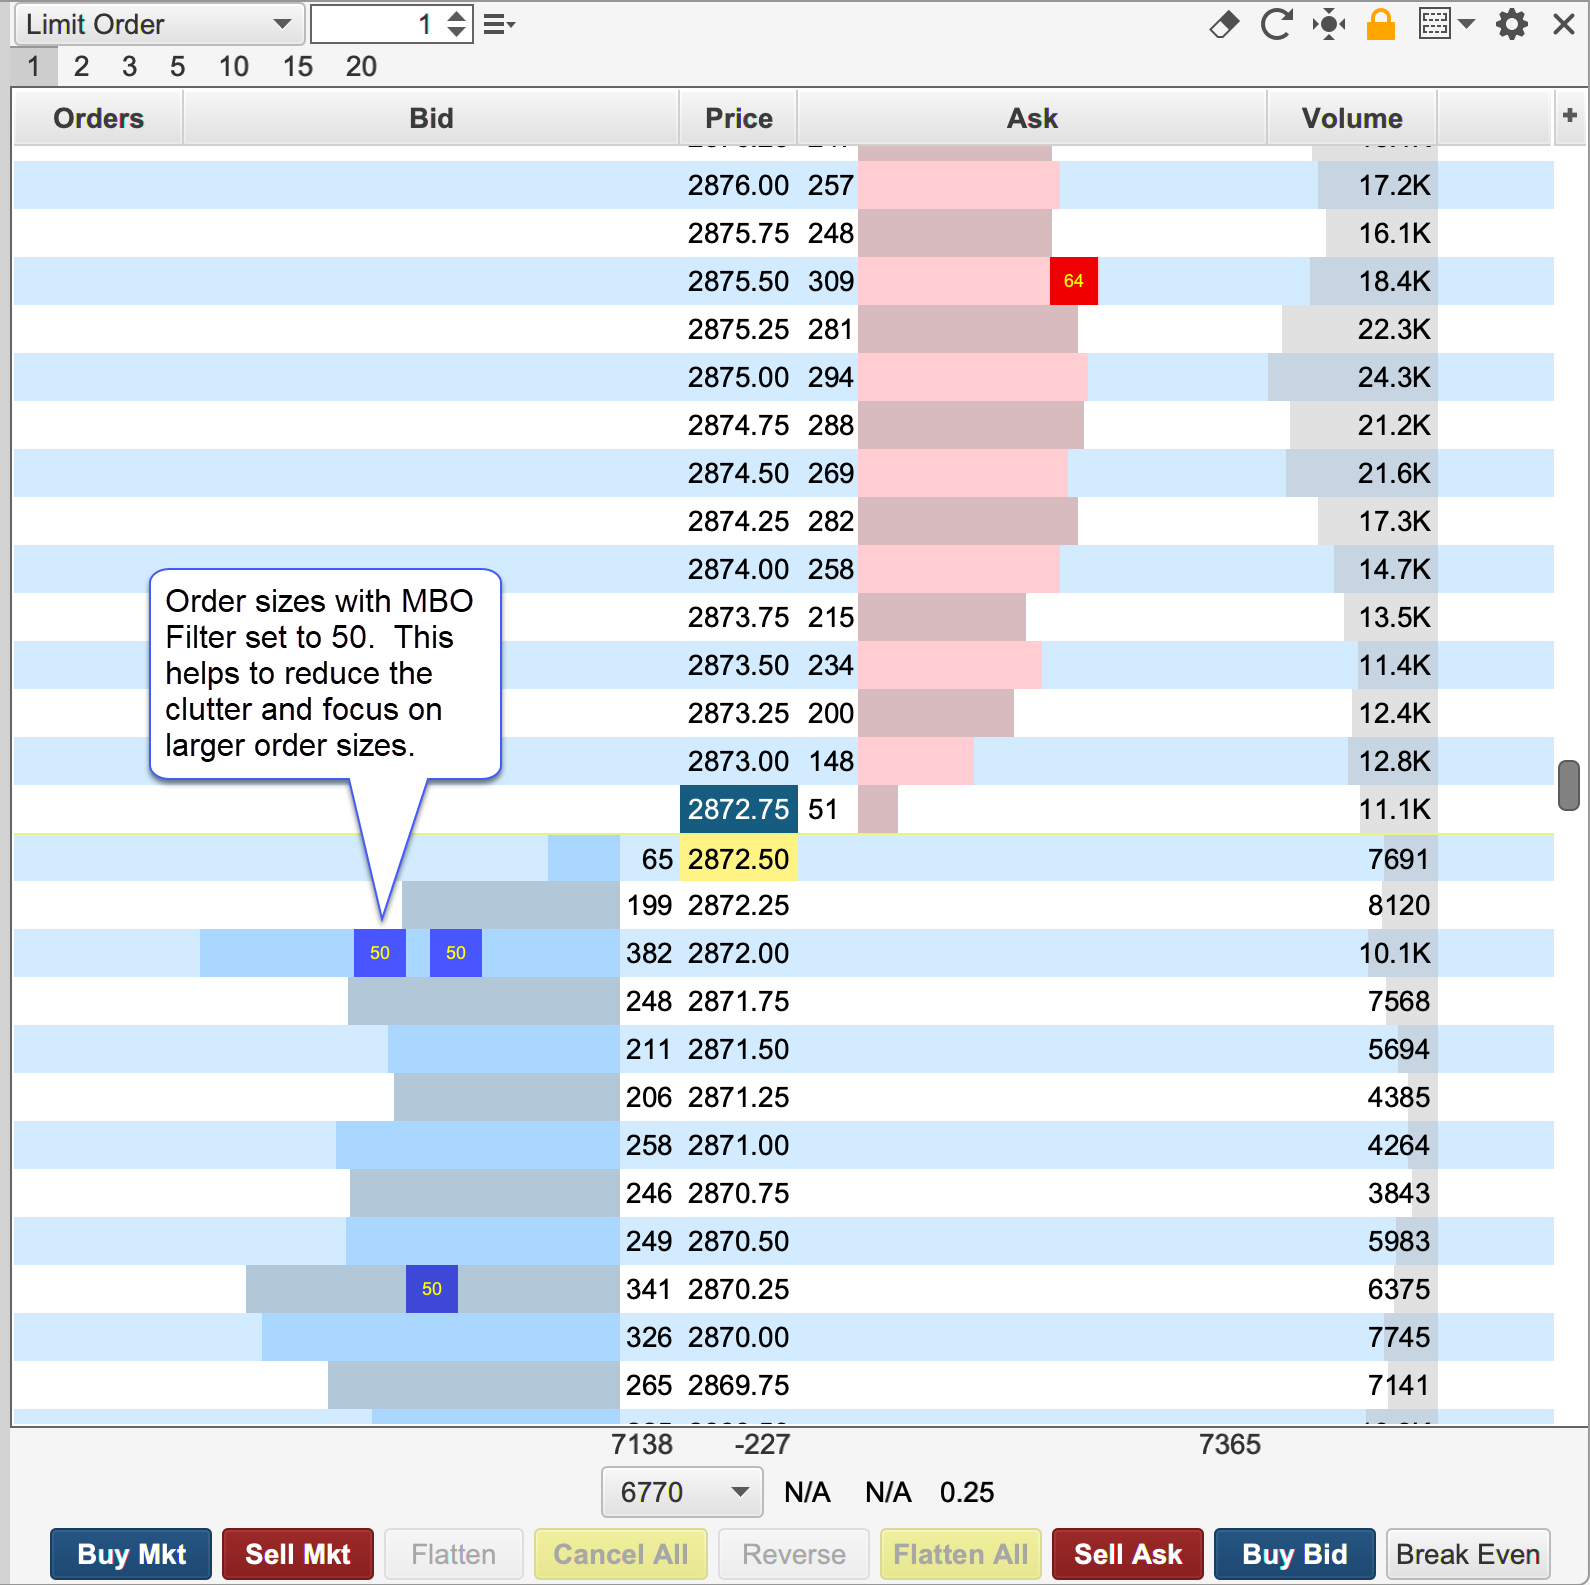
The screen shot below shows the MBO filter option with the size set to 50:
Last updated