Order Heatmap
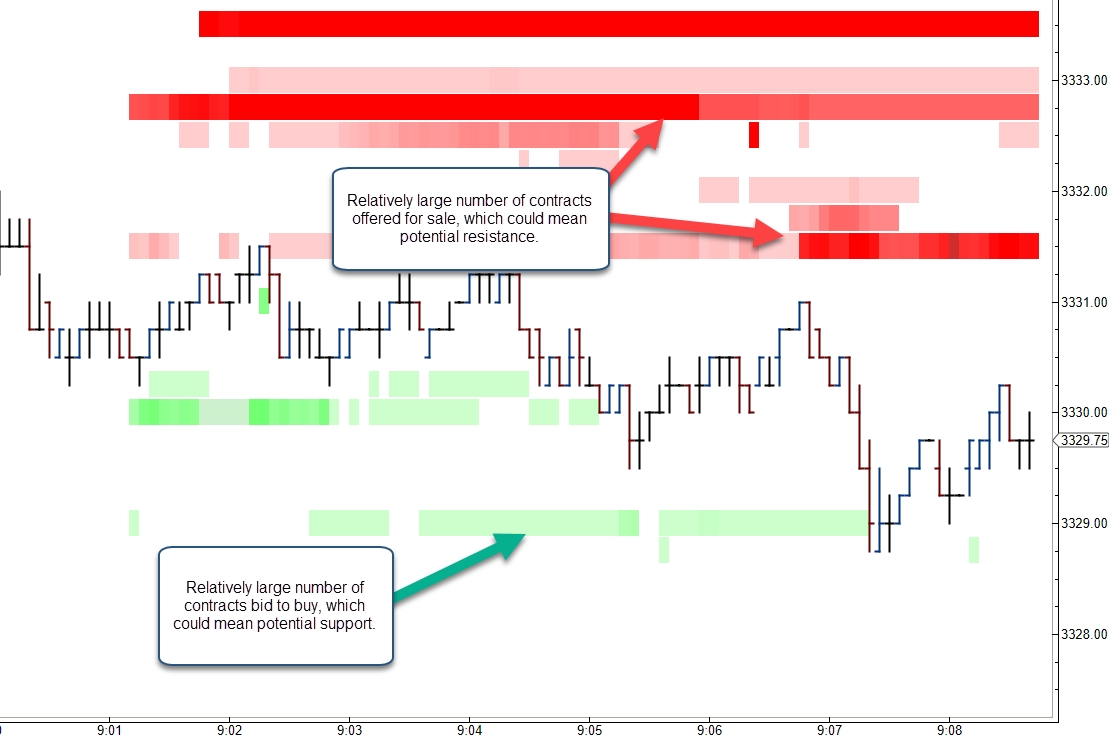
Graphically displays historical Depth of Market sizes captured at the end of the bar (since version 5.4). Blocks are shaded according to their relative size. Darker shading indicates higher sizes (lighter shading on dark chart themes). Blocks where no depth currently exists are extended forward to show where orders may still exist (most depth of market feeds are limited to 10 bid/ask depth).
This study can be very useful to discover where potential support and resistance levels exist based on the cumulative size of the orders to buy or sell at the given price.
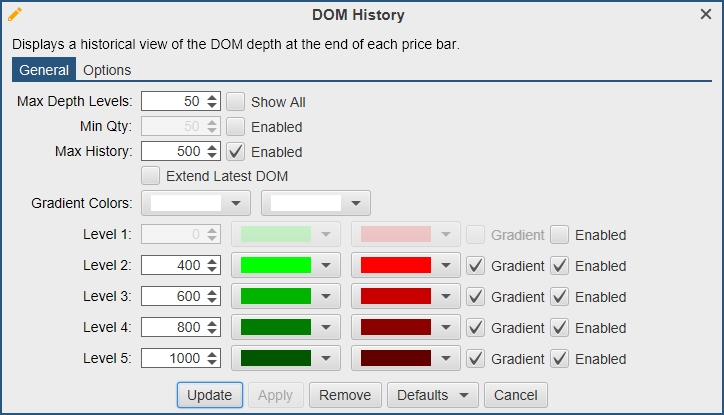
Configuration options for this study are simple. Just choose the base color for the ask and bid sizes. The shading is computed by changing the opacity of the color relative to the maximum size present in the DOM history.
Max Depth Levels – Limit the number of depth levels on connections that display full market depth. This is done for performance reasons.
Min Quantity – Only display depth levels of this size and larger.
Max History – Limit the DOM history for performance reasons.
Extend Latest DOM – Extend the most recent DOM level forward.
Gradient Colors – Select the DOM history gradient colors for the bid and ask.
Level 1-5 – Select colors to highlight certain depth levels and above.


Last updated