Speed Gauges
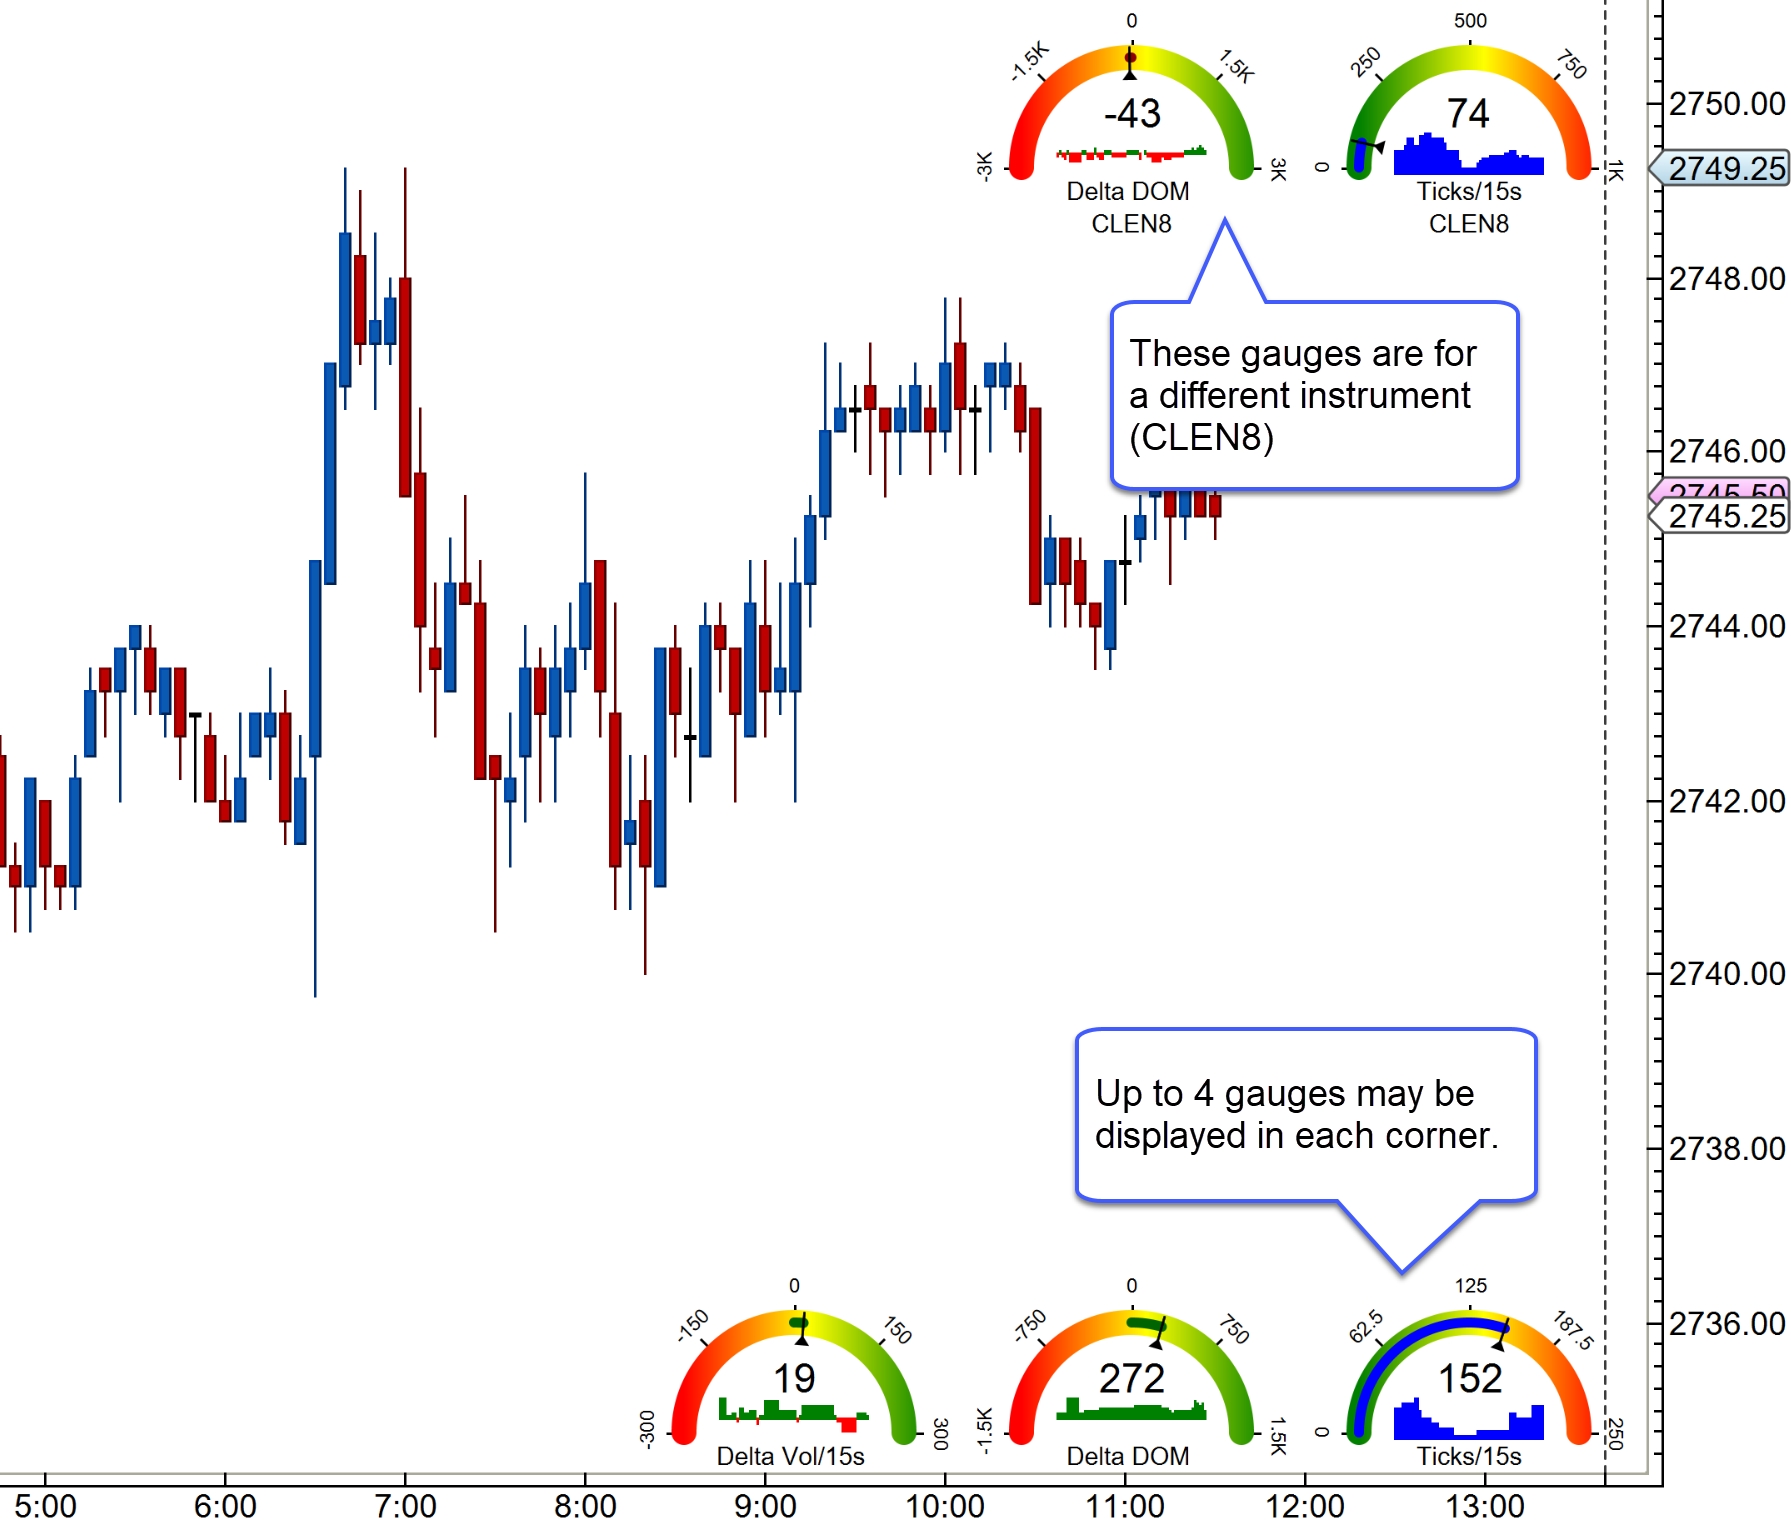
Speed gauges are useful for displaying live statistics on the price graph (since version 5.4). Up to 16 gauges can be displayed on a single price graph for multiple instruments (4 per study). Optionally, a historical graph shows values over the past minute.
Each study can display up to 4 gauges. The following summaries the configuration options for this study:
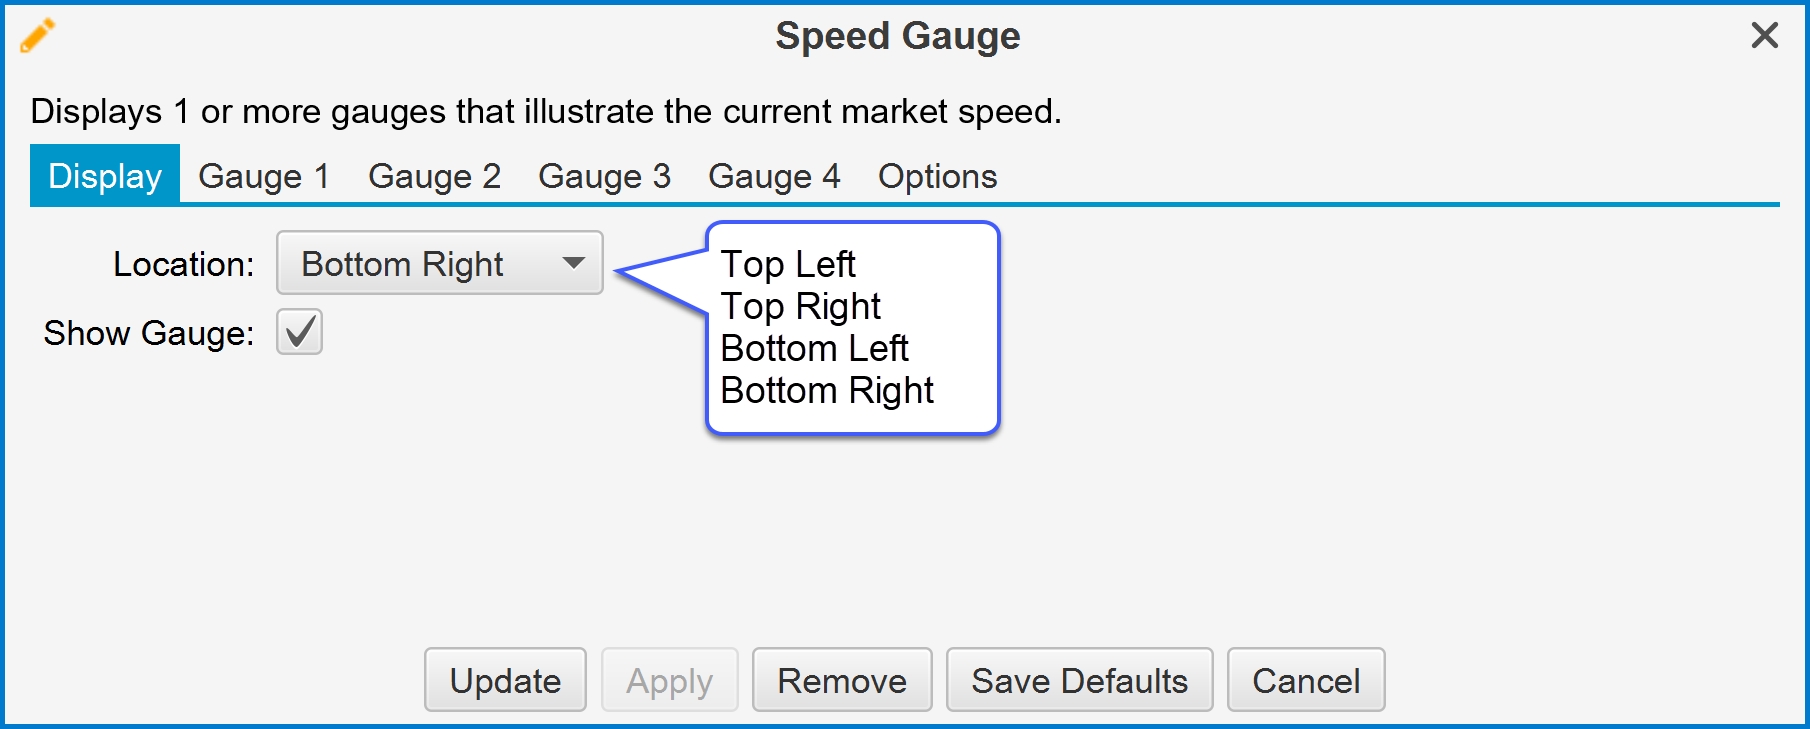
Location – Specifies where on the price graph to display the gauges.
Show Gauge – Toggles the display of the graphical gauge that shows the range of values.
Gauge Tabs – Each tab allows for the configuration of up to 4 gauges.
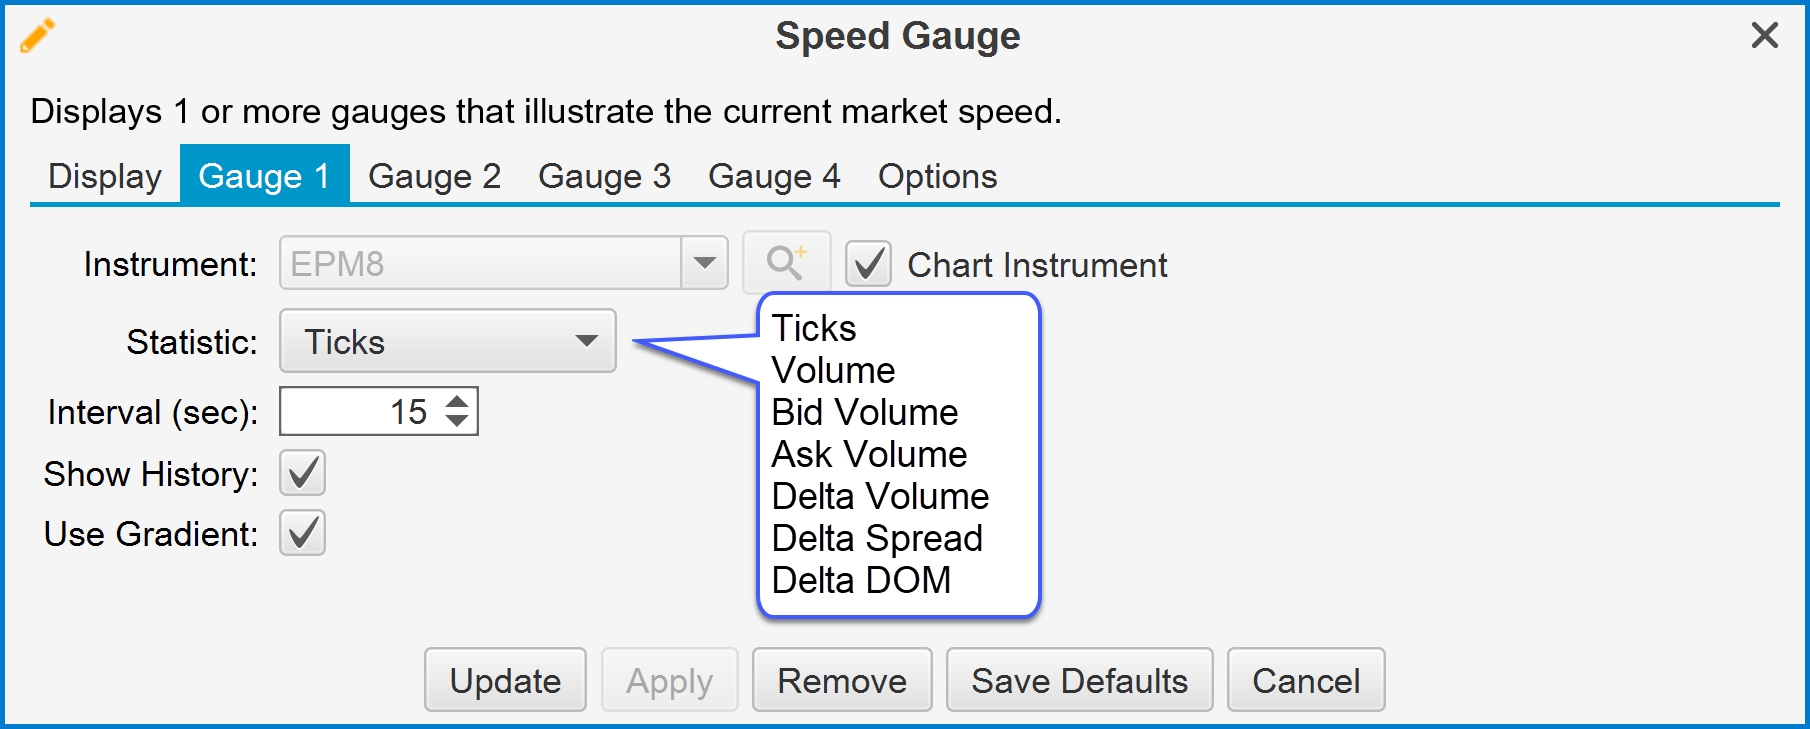
Instrument – Instrument used for the statistic. Check “Chart Instrument” to use the same instrument as the active chart.
Statistic – The following statistics are supported:
Ticks – Number of ticks for the given interval (in seconds).
Volume – Total volume that occurred in the current interval.
Bid Volume – Total volume that occurred at the bid price.
Ask Volume – Total volume that occurred at the ask price.
Delta Volume – Difference between the ask volume and bid volume.
Delta Spread – Difference between the current best bid size and the best ask size .
Delta DOM – Difference between the total bid size and the total ask size in the DOM (Depth of Market).
Interval (sec) – Interval in seconds over which to compute the statistic. Note: this is only used for some of the statistics.
Show History – If checked this will show a historical graph (for the past minute) below the current value.
Use Gradient – Shows a gradient (green – yellow – red) as the background on the gauge.


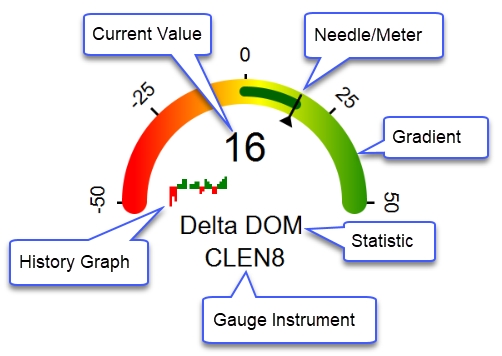
The following diagram names some of the elements of the speed gauge:

The example below shows speed gauges in the top right and bottom right corners of the price graph.

Last updated