
Speed of Tape
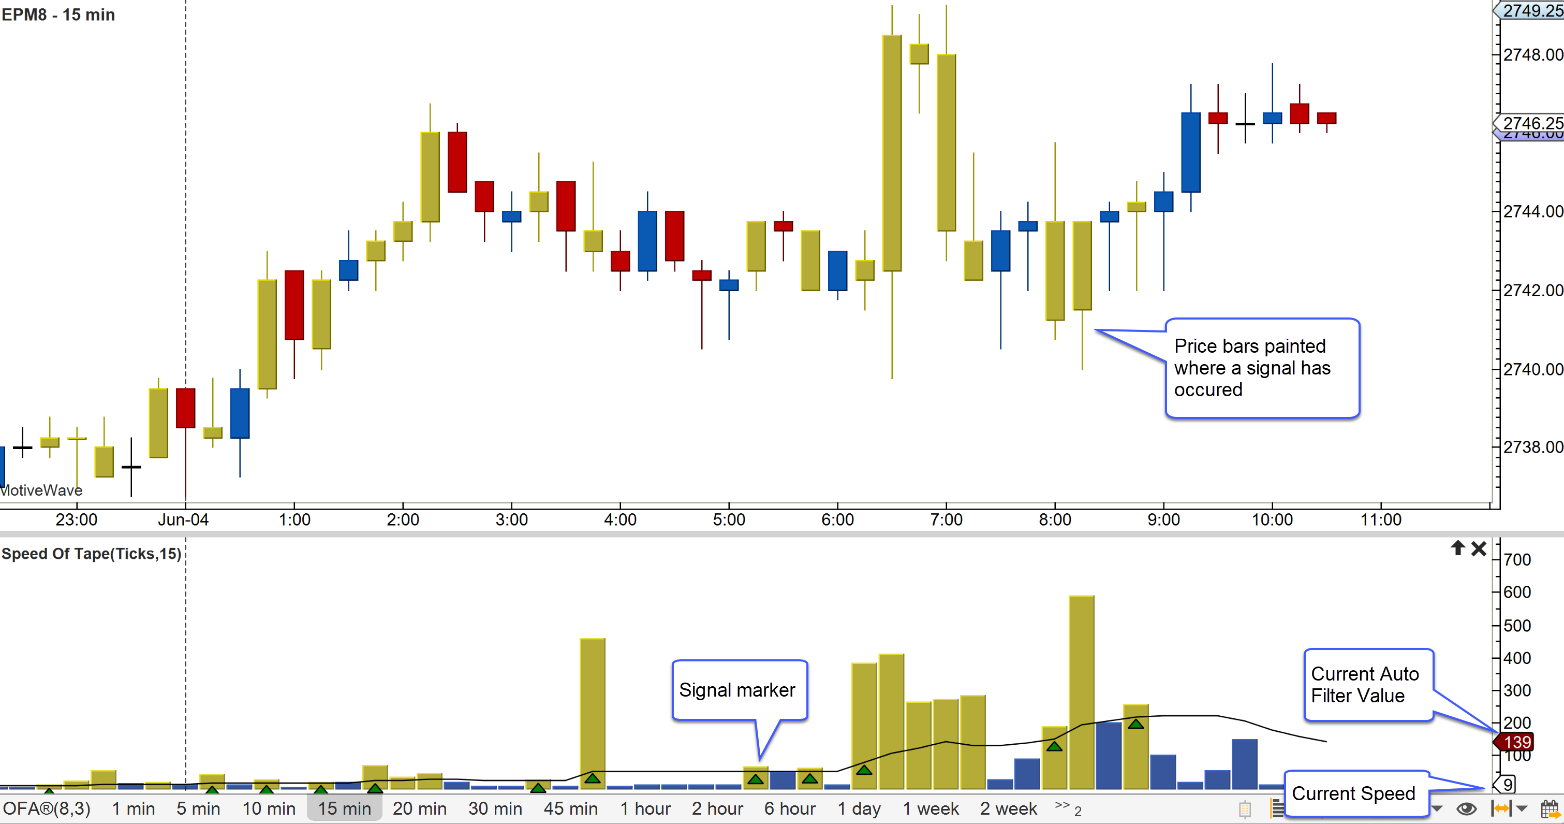
The Speed of Tape study measures the speed of a given statistic over an interval (in seconds).
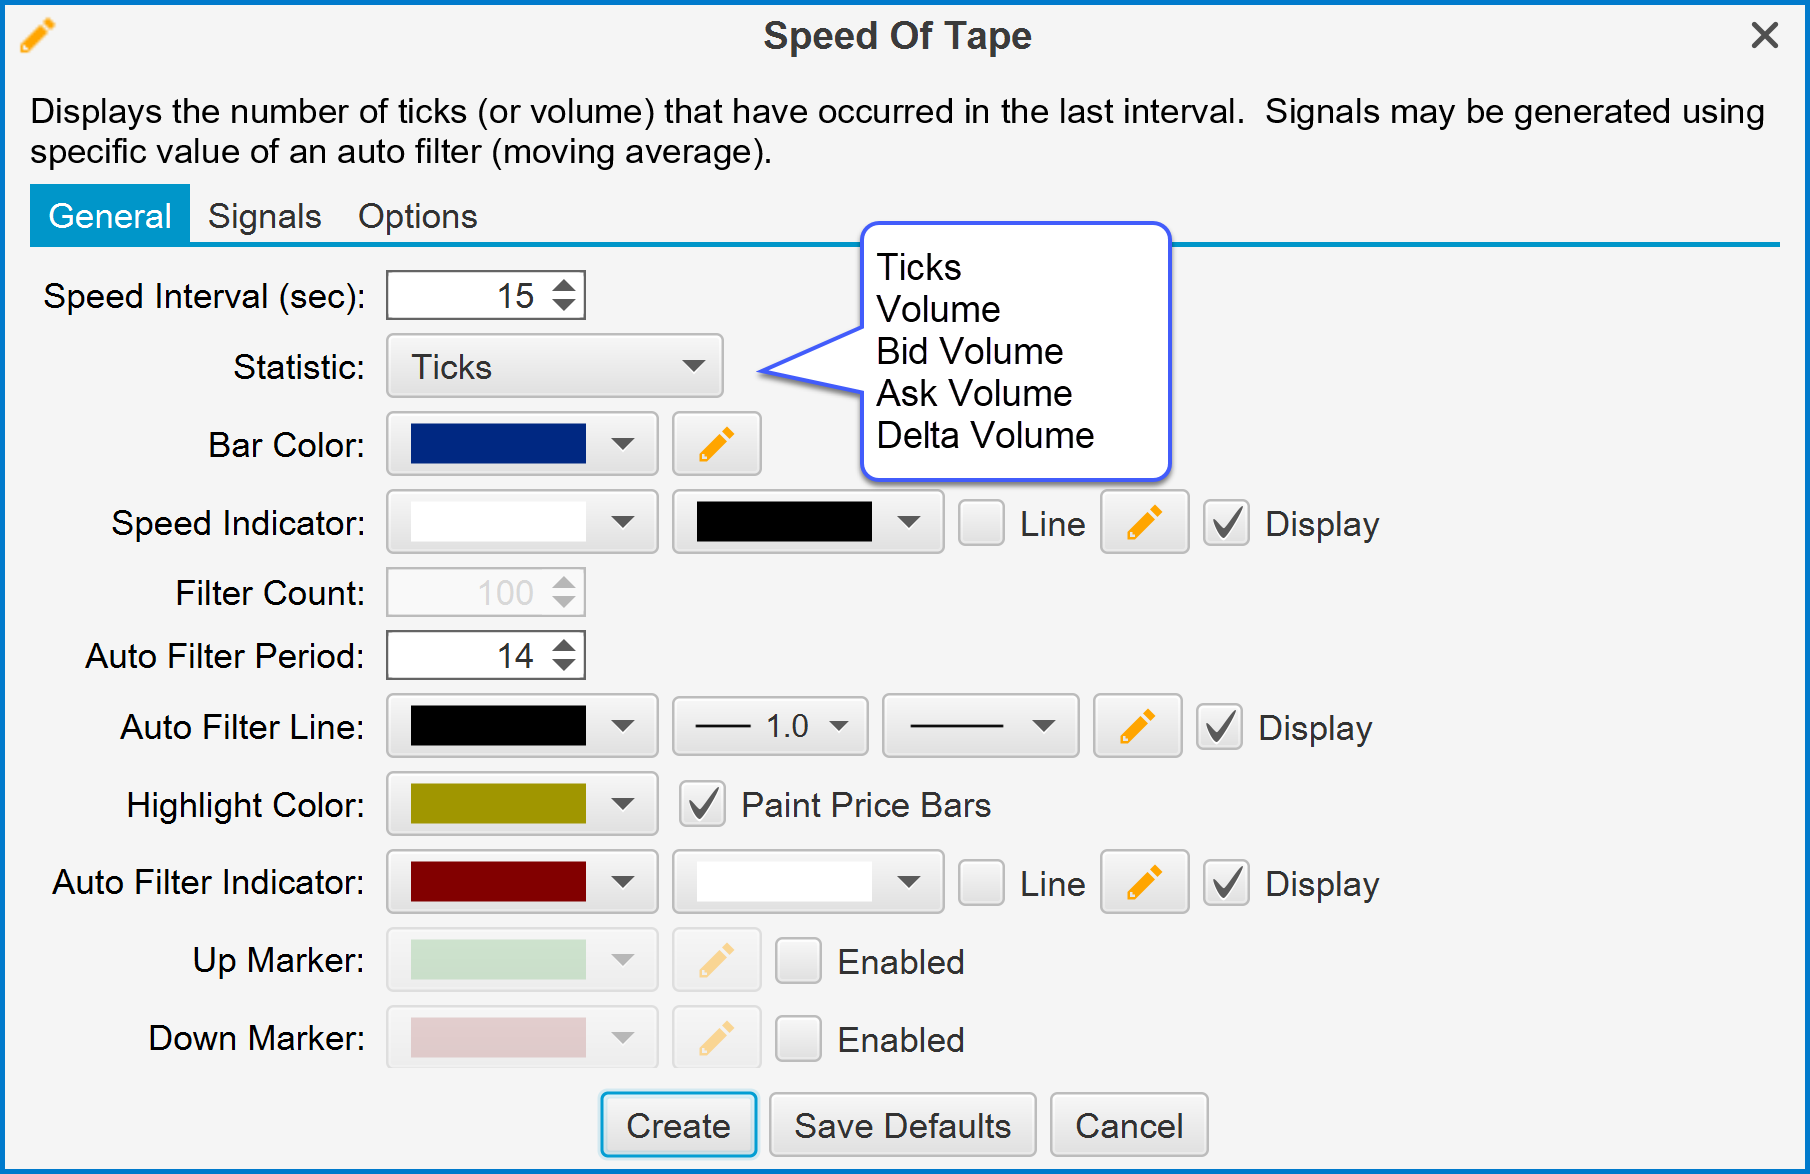
This study uses tick data to compute the statistics and display historical values. The following screen shot displays the available configuration options:
Speed Interval (sec) - The interval in seconds for computing the statistic. For example, number of ticks that occurred in the last 15 seconds. For historical values this will be the computed from the end time of the price bar.
Statistic – Defines what you want to measure. This has the following values:
Ticks – Number of ticks that occurred.
Volume – Total volume that occurred during the interval.
Ask Volume – Volume that occurred at the ask price.
Bid Volume – Volume that occurred at the bid price.
Delta Volume – Difference between the ask volume and the bid volume for the given interval.
Bar Color – Color of the bars. Press the edit button for more configuration options.
Speed Indicator – Configuration settings for the latest speed value (displayed on the vertical axis).
Filter Count – Used to filter generate signals. This is disabled if the auto filter option is used.
Auto Filter Period – Used to generate signals when the closing value for the bar crosses above the SMA of the given period.
Auto Filter Line – Configuration for the auto filter line.
Highlight color – Highlights bar where the closing value is above the filter value. Optionally the price bars can be painted this color as well.
Auto Filter Indicator – Display configuration for the current auto filter value in the vertical axis.
Up Marker – Displays a marker where the latest value has crossed above the filter.
Down Marker – Displays a marker where the latest value has crossed below the filter.
Last updated