Time Price Opportunity (TPO) Study
The Time Price Opportunity (TPO) study displays market activity using time and price (sometimes known as Market Profile). This study can be found under the Study -> All Studies menu (see top menu bar).
The following screen shot of the S&P mini futures contract illustrates some of the features of the TPO study. This is a daily TPO with a 30-minute time interval on a 15-minute price chart. The price interval is set to 4 ticks.
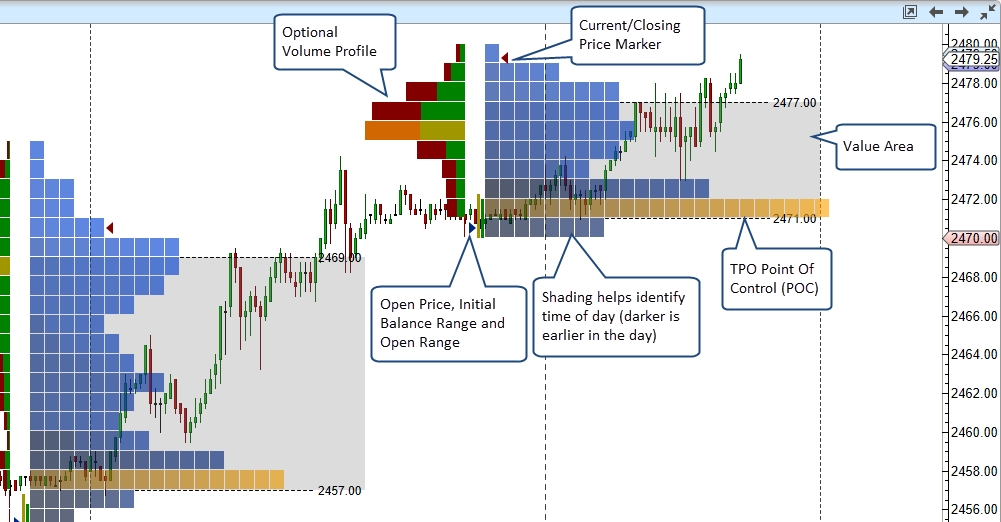
Each cell in the above chart represents a 30 minute time interval in the trading day. The beginning and end of this range is set using the trading hours that are defined for instrument. In the above example we are using extended data and the trading day starts at 6:00 pm EST on the previous day and ends at 5:00 pm. For convenience the cells are shaded darker near the beginning of the trading day and lighter near the end of the day (optional).
Configuration settings for the study can be found in the Study Dialog (double click on the study or right click and choose “Edit”)
General Settings
Basic configuration settings can be found under the “General” tab.
Timeframe – The typical timeframe for a TPO study is 1 day, but there are several options available including intra-day values and weekly/monthly bar sizes. The time frame defines the range of tick data (start/end times) used for each TPO graph. For example, a 1 day time frame would start at the beginning of the trading day and finish at the end of the trading day (defined in the trading hours).
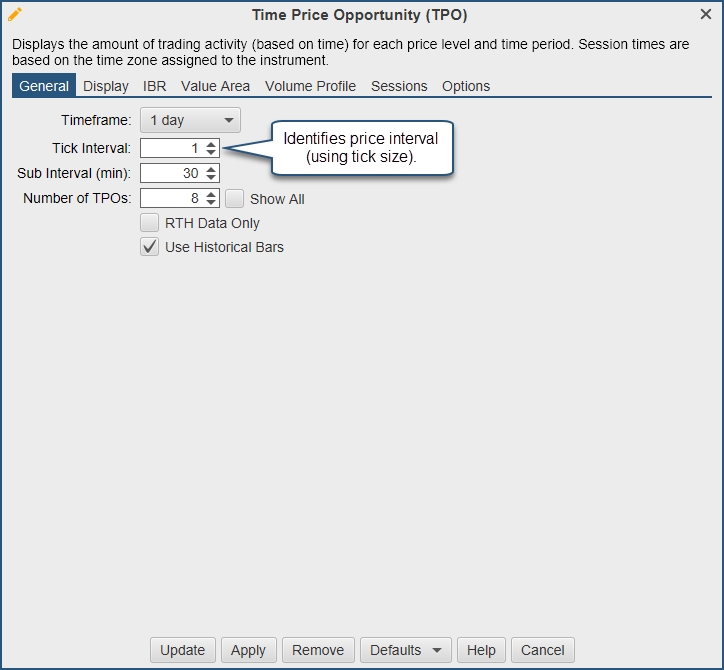
Tick Interval – This defines the price range that applies to each row in the TPO graph. A tick interval of 1 will plot a row for every price. In the case of the S&P mini futures contract, a tick interval of 4 will display a row for every point of price movement since the minimum tick is one quarter point (ie: 0.25). The tick interval can be very useful when trading an instrument that has a wide range of movement (highly volatile) or has a very small minimum tick value relative to its typical range (such as FOREX or high value stocks).
Sub Interval – This determines the length (in time) of each cell that makes up the TPO chart. On a daily chart this is typically set to 30 minutes. In this case each cell covers 30 minutes of trading activity at the given price interval. A cell is drawn at a price interval if 1 or more trades occurred for that price interval in that slice of time.
Number of TPOs – This may be used to limit the number of TPOs that are drawn on the chart. Loading historical tick data can be expensive in terms of computer resources and network activity. Check the “Show All” box to show all TPOs in the time range of the chart.
RTH Data Only – If checked, this will only load tick data that occurred during the regular trading session for the instrument. For details see the trading hours for the instrument. If no regular trading session is defined for the instrument, this this setting will be ignored.
Use Historical Bars – Allow the use of minute bars to create TPOs, this is ideal for longer time frame profiles so tick data doesn’t need to be downloaded for the entire range.
Display Settings
General display settings for the TPO graph can be found under the “Display” tab:
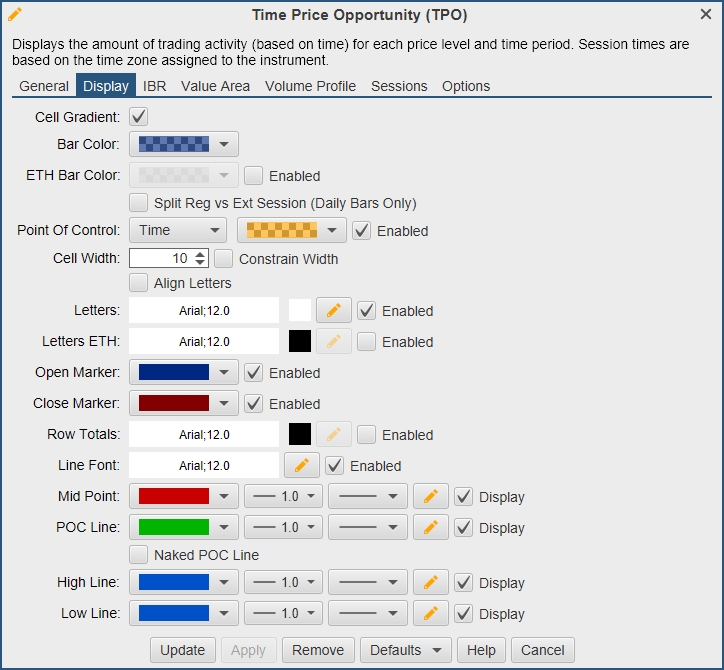
Cell Gradient – This option will shade the cells that are at the beginning of the time frame darker and the cells near the end of the time frame lighter. This helps to provide a visual indicator of how the time is distributed in the TPO graph.
Bar Color – This is the default color assigned to each cell/bar.
ETH Bar Color – This is the cell/bar color for the Extended Trading Hours.
Split Reg vs Ext Session – Create two profiles per day, one ETH and one RTH.
Point Of Control – This identifies the row in the TPO graph where the price spent the most time. In the case where there is more than one row that meets this criteria, the one with the highest amount of volume is chosen. Optionally, Volume can be used as the criteria for the Point Of Control (see Time drop down below). In this case the row with the highest amount of volume will be highlighted using the selected color. This feature can be disabled by unchecking the Enabled box on the right hand side.
Cell Width – This is the width (in pixels) for each cell that is drawn in the TPO graph.
Align Letters – Enabling this will display/split each TPO letter into it’s own column.
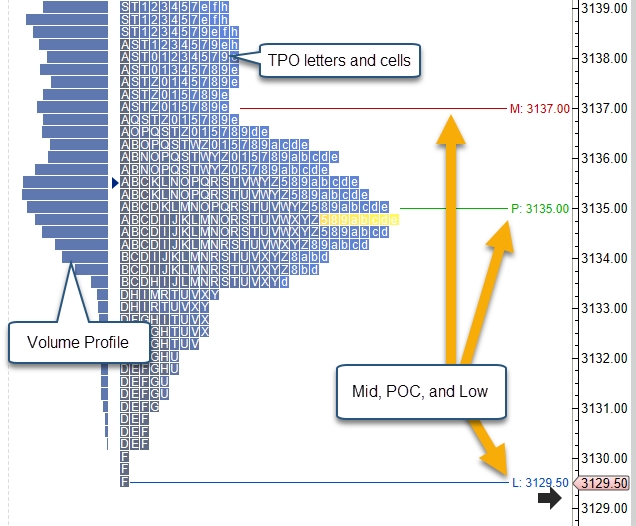
Letters – If this option is enabled letters will be drawn that identify the sequence of the cells. For example all cells that occurred during the first sub interval will be assigned the letter A (B for the second, C for the third etc).
Letters ETH – Enable this to change the font for ETH letters.
Open/Close Markers – Displays where the open price and closing price of the timeframe occurred. In the case of the latest TPO it will display the latest price for the Close Marker.
Row Totals – Displays the number of cells in each row on the left hand side of the TPO graph.
Line Font – If this option is enabled, the price level of each line that is drawn will be shown at the right hand side.
Mid Point – Draws a line for the mid point between the high and low price of the TPO graph.
POC Line – Draws a line from the end of the Point Of Control row to the end of the time frame.
High/Low Line – Draws a line for the high and low prices of the TPO graph.
The following diagram illustrates the TPO graph with some of the options above enabled.
Initial Balance Range (IBR) Settings
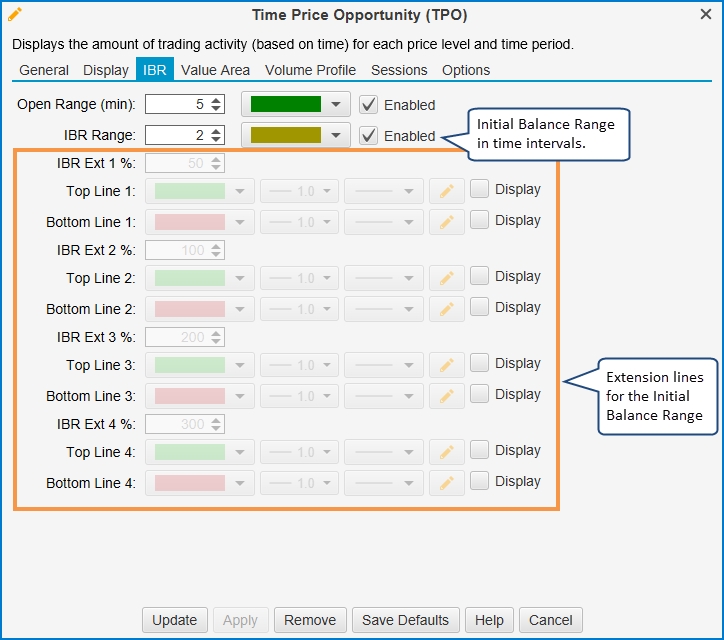
The IBR tab contains settings for Open Range and Initial Balance Range.
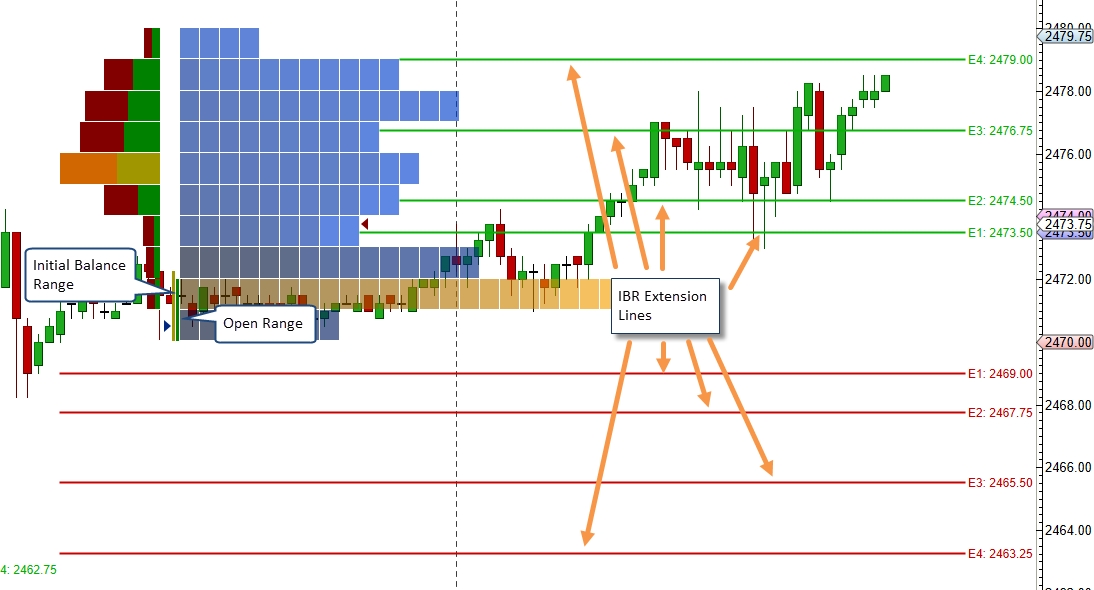
Open Range (min) – This is the time period and color for the open range marker displayed to the left of the TPO graph. The open range is the high/low price range the market traded within during the first X mins (default 5). If the Enabled box is unchecked, this will not be displayed.
IBR Range – This defines the time period (in sub intervals) and fill color for the Initial Balance Range high/low. This is displayed to the left of the TPO graph. If the Enabled box is unchecked, this will not be displayed.
IBR Ext X % - This is the percent of the IBR that is projected above and below the IBR Range marker. This field is only enabled if either the Top Line or Bottom Line fields are displayed.
Top Line X – Allows you to configure the line settings for the top IBR extension. Uncheck the Display box to hide.
Bottom Line X - Allows you to configure the line settings for the bottom IBR extension. Uncheck the Display box to hide.
IBR Tab
The screen shot below illustrates the Initial Balance Range, Open Range and IBR extension lines.
TPO Value Area Settings
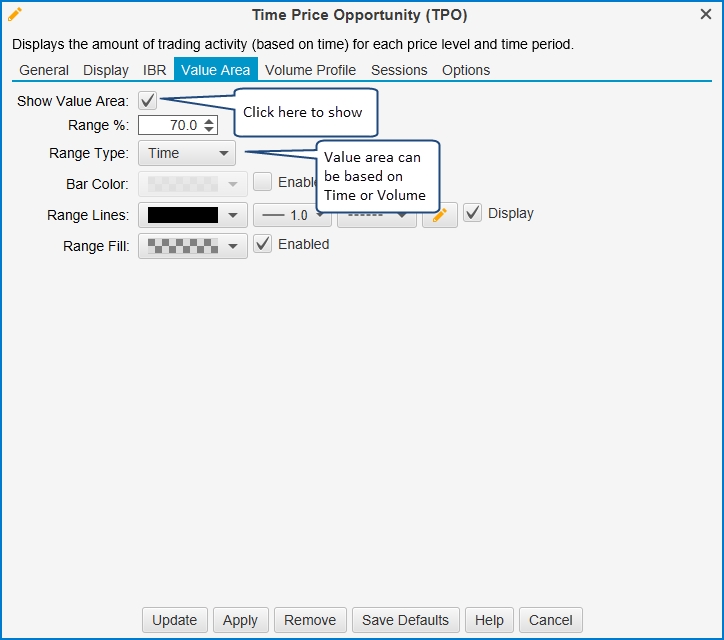
The value area identifies the rows surrounding the Point of Control (POC) that encompass X % (typically 70%) of the trading time or volume. Settings for the value area can be found under the Value Area tab:
Show Value Area – Check this box to show the value area for the TPO graph.
Range % - Percentage of the trading time/volume to include in the value area.
Range Type – Choose either Time or Volume for calculating the Value Area.
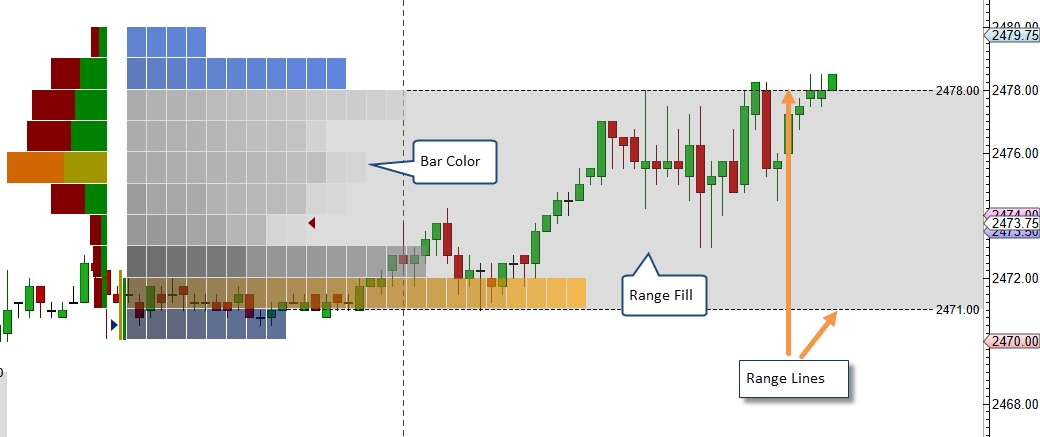
Bar Color – Shade color for the bars that are part of the value area. A semi-transparent color can be used to blend with the existing bar colors.
Range Lines – Settings for the lines that identify the top and bottom of the Value Area.
Range Fill – Fills the white space within the value area with a specified color.
The following screen shot shows the TPO Value Area and some of the options described above:
Volume Profile
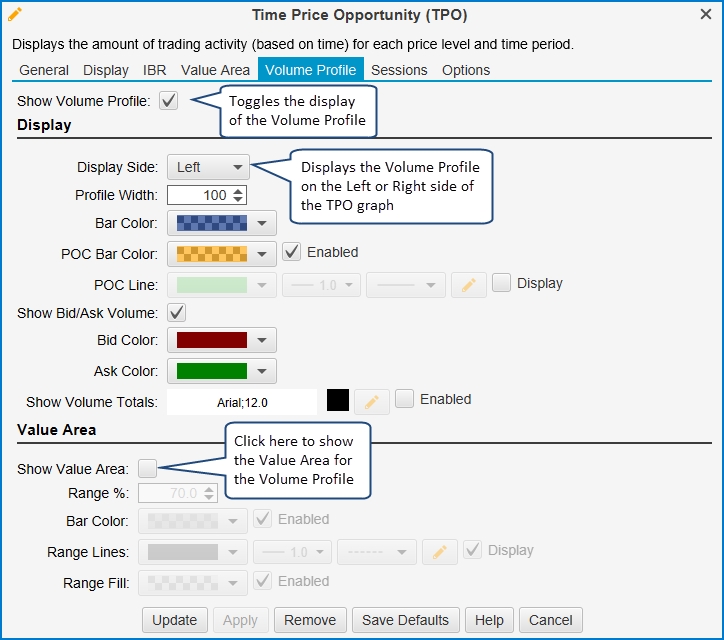
Optionally, a Volume Profile graph can be displayed with the TPO graph. This makes it easy to compare price/time with price/volume. Click on the Volume Profile tab (see below):
Show Volume Profile – Check this box to display the Volume Profile graph.
Display Section
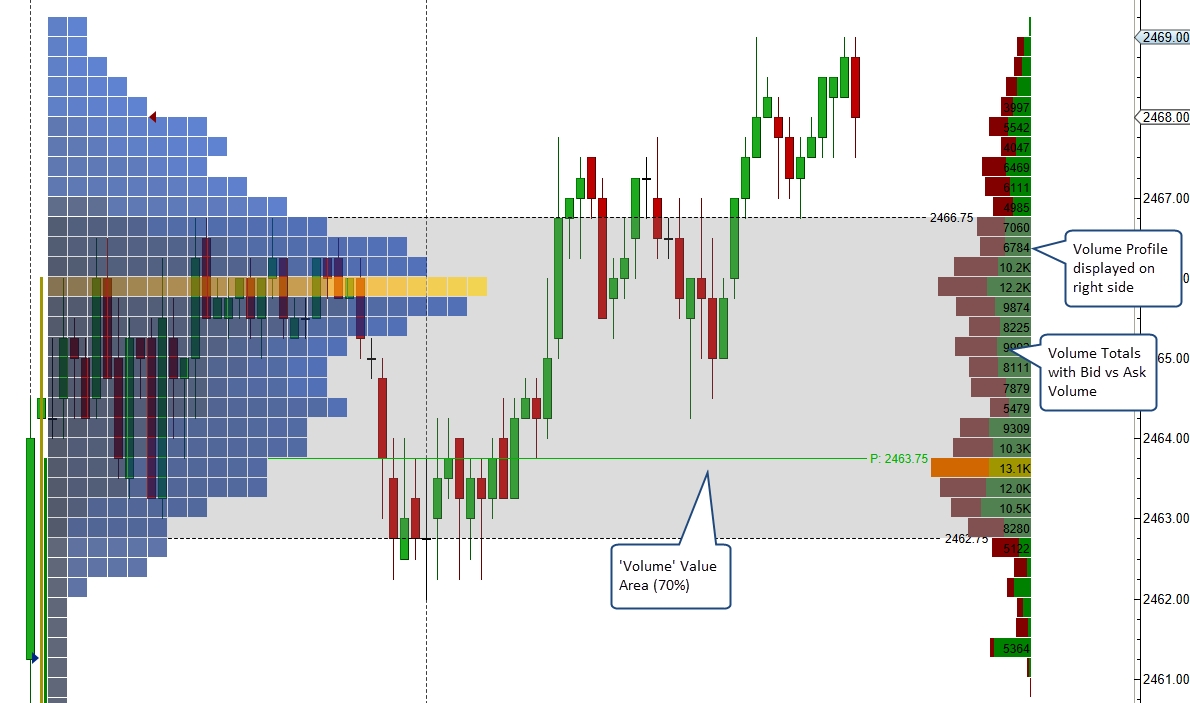
Display Side – The volume profile can be displayed on the left-hand side of the TPO graph or on the right-hand side (right justified).
Profile Width – Width of the volume profile graph (in pixels).
Bar Color – Default color for the volume profile rows.
POC Bar Color – Color for the Point of Control row.
POC Line – Optionally display a horizontal line from the Point of Control row.
Show Bid/Ask Volume – If this is enabled the bid vs ask volume will be displayed in the profile rows.
Show Volume Totals – Displays the total volume for each row in the profile.
Value Area Section
Show Value Area – Optionally displays the value area for the volume profile.
Range % - This is the percentage of the volume activity that is included in the value area (default 70%). This area will be centered around the POC row.
Bar Color – Color for the bars that are part of the value area. A transparent color may be useful to make sure the POC and other information is not hidden.
Range Lines – Settings for the top/bottom of the range.
Range Fill – Optional background fill color for the range area.
The following screen shot shows the Volume Profile displayed on the right hand side of the TPO graph.
Session Colors
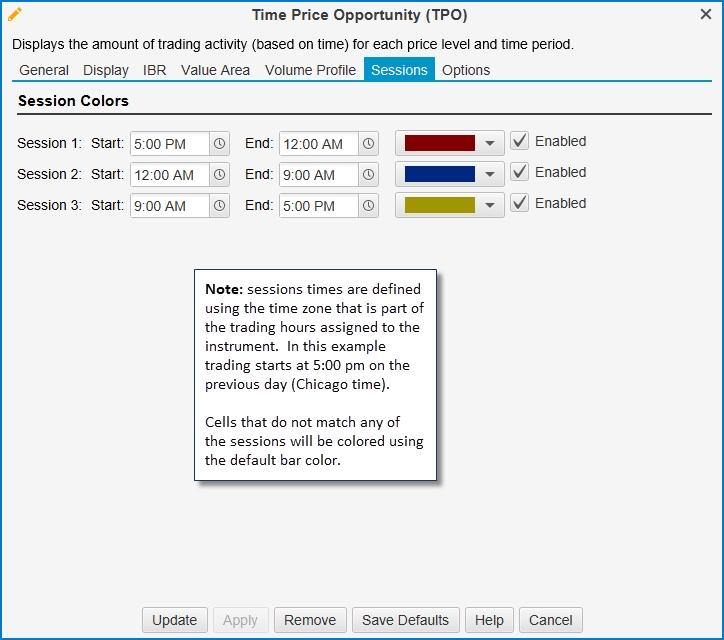
Colors can be assigned to user defined sessions for a trading day. The Sessions tab allows you to enable up to 3 different session colors. Any cells that do not fit within these sessions will be colored using the default bar color. The time zone used for these session times is inherited from the trading hours that are assigned to the instrument. For example, the S&P mini futures contract will use the time zone “America/Chicago”.
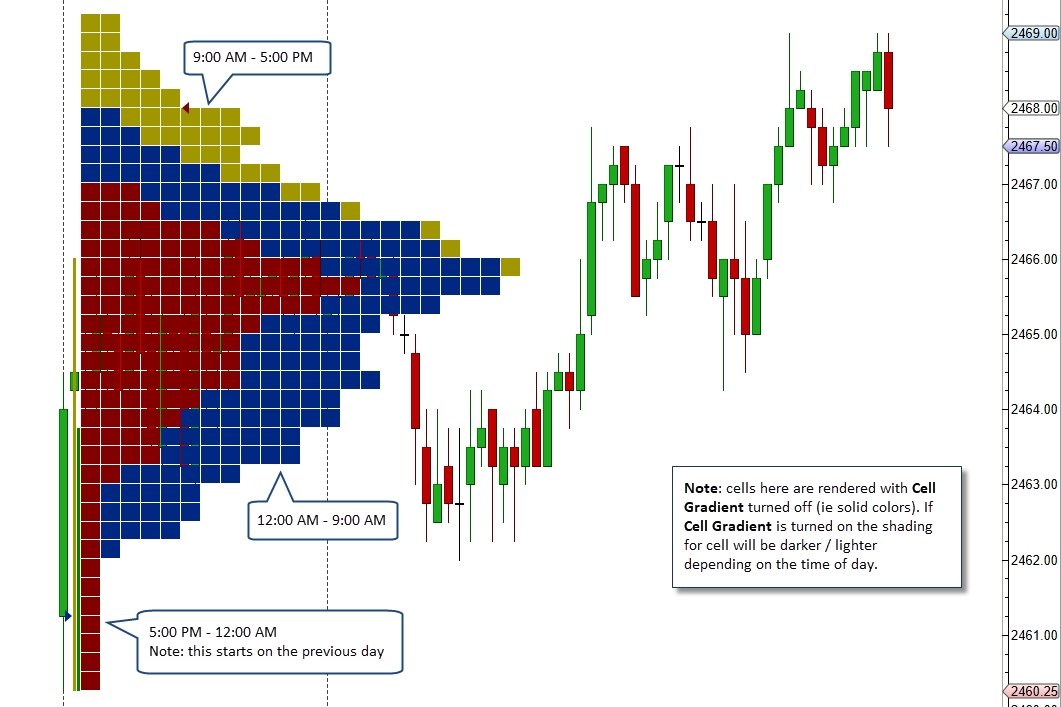
In the example below, the first session starts at 5:00 pm on the previous day and ends at 12:00 am (midnight). The second session goes from 12:00 am (midnight) until 9:00 am and the final session is from 9:00 am until 5:00 pm (on the current day). All these times are in “Chicago” time.
The following screen shot shows an example of session colors using the settings from the dialog above. Cell Gradient has been disabled so all cells appear in their solid color.
Split TPO
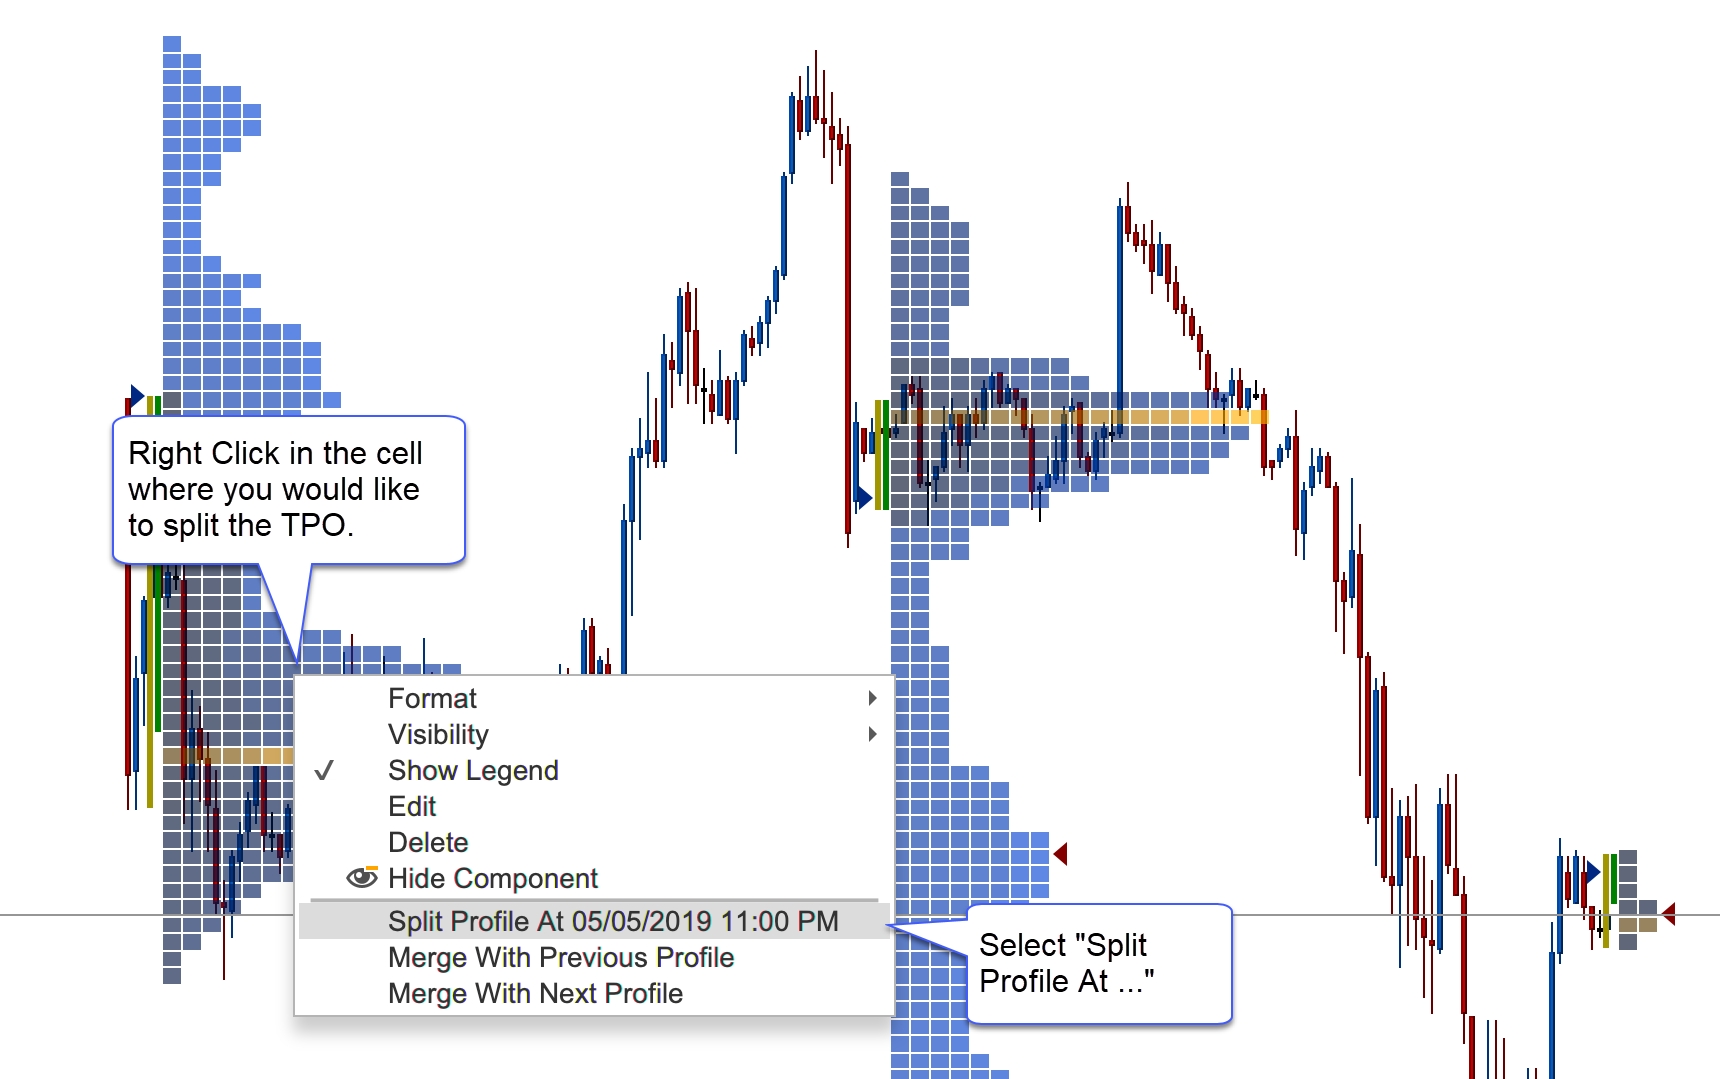
TPO Profile may be split from the context menu (right click on the TPO Profile Cell). The profile will be split at the cell where the context menu was opened.
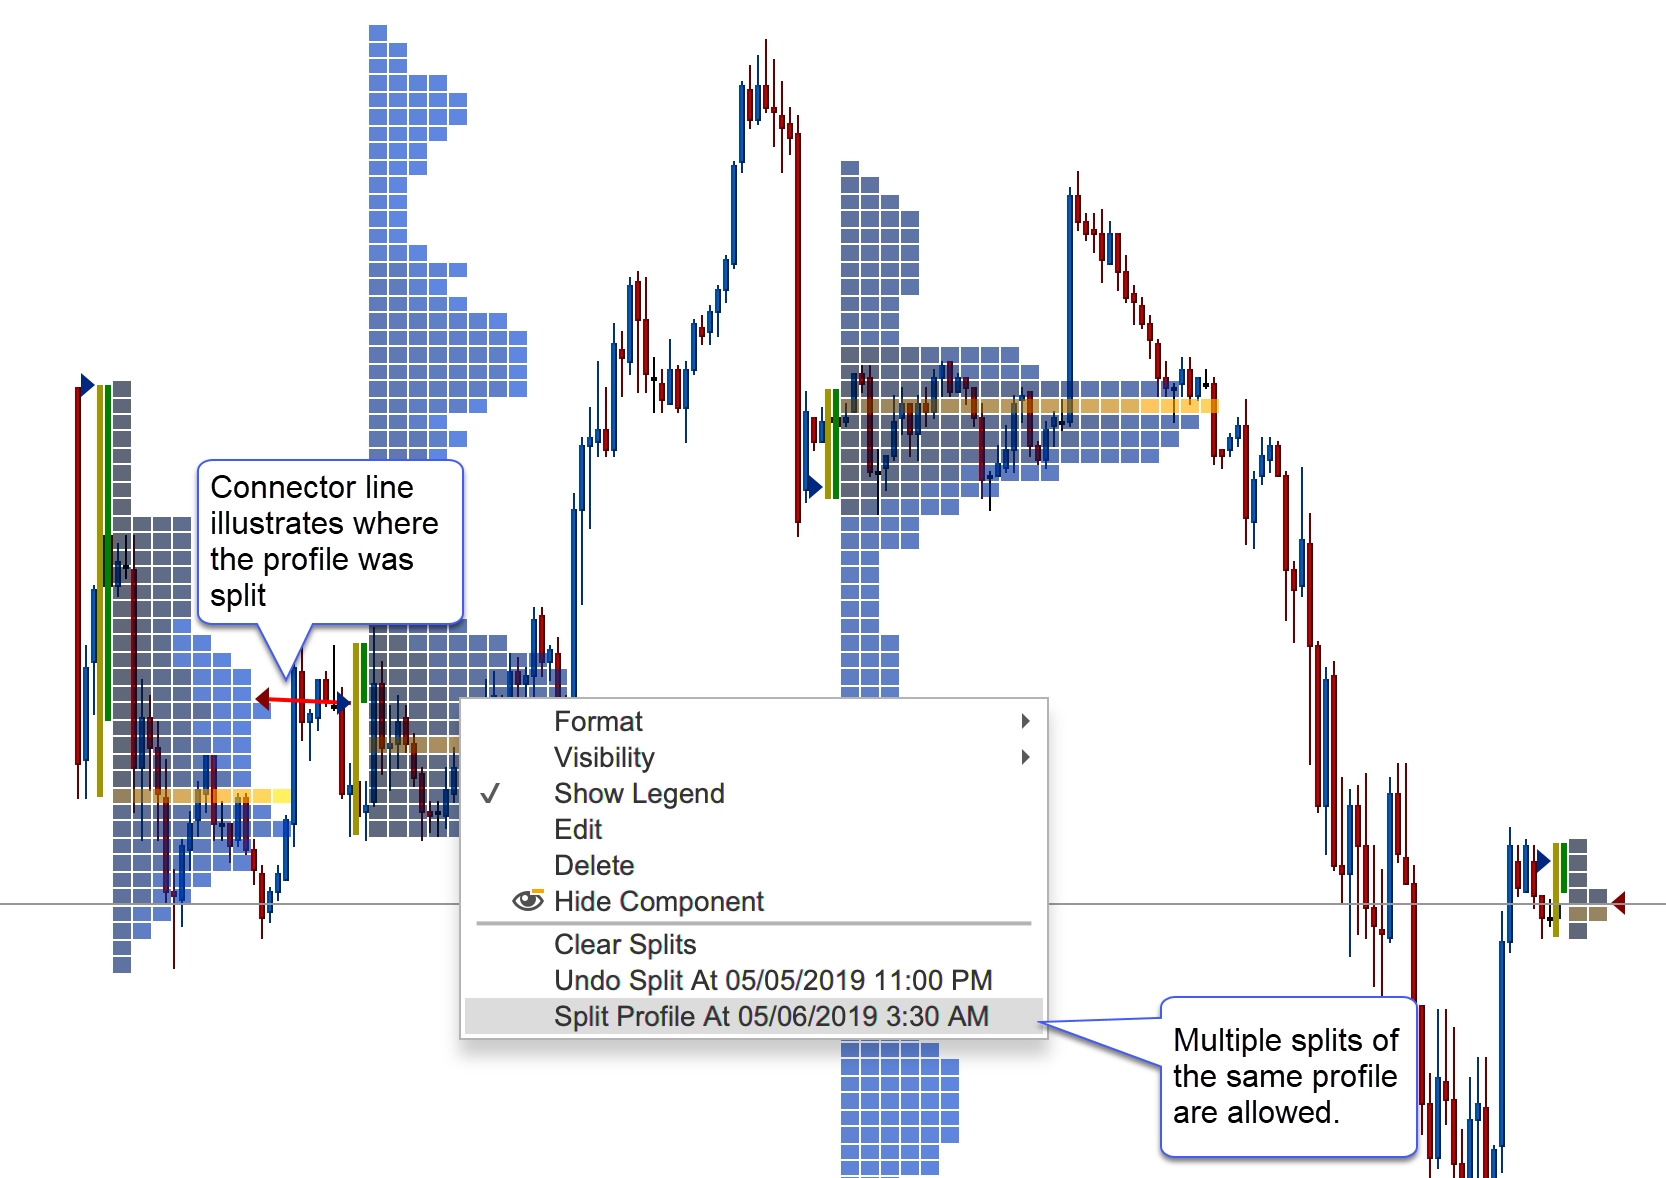
Split profiles have connector lines to indicate where the profiles were split. A TPO profile may be split multiple times. Splits may also be removed individually or all at once (Clear Splits option):
Merge
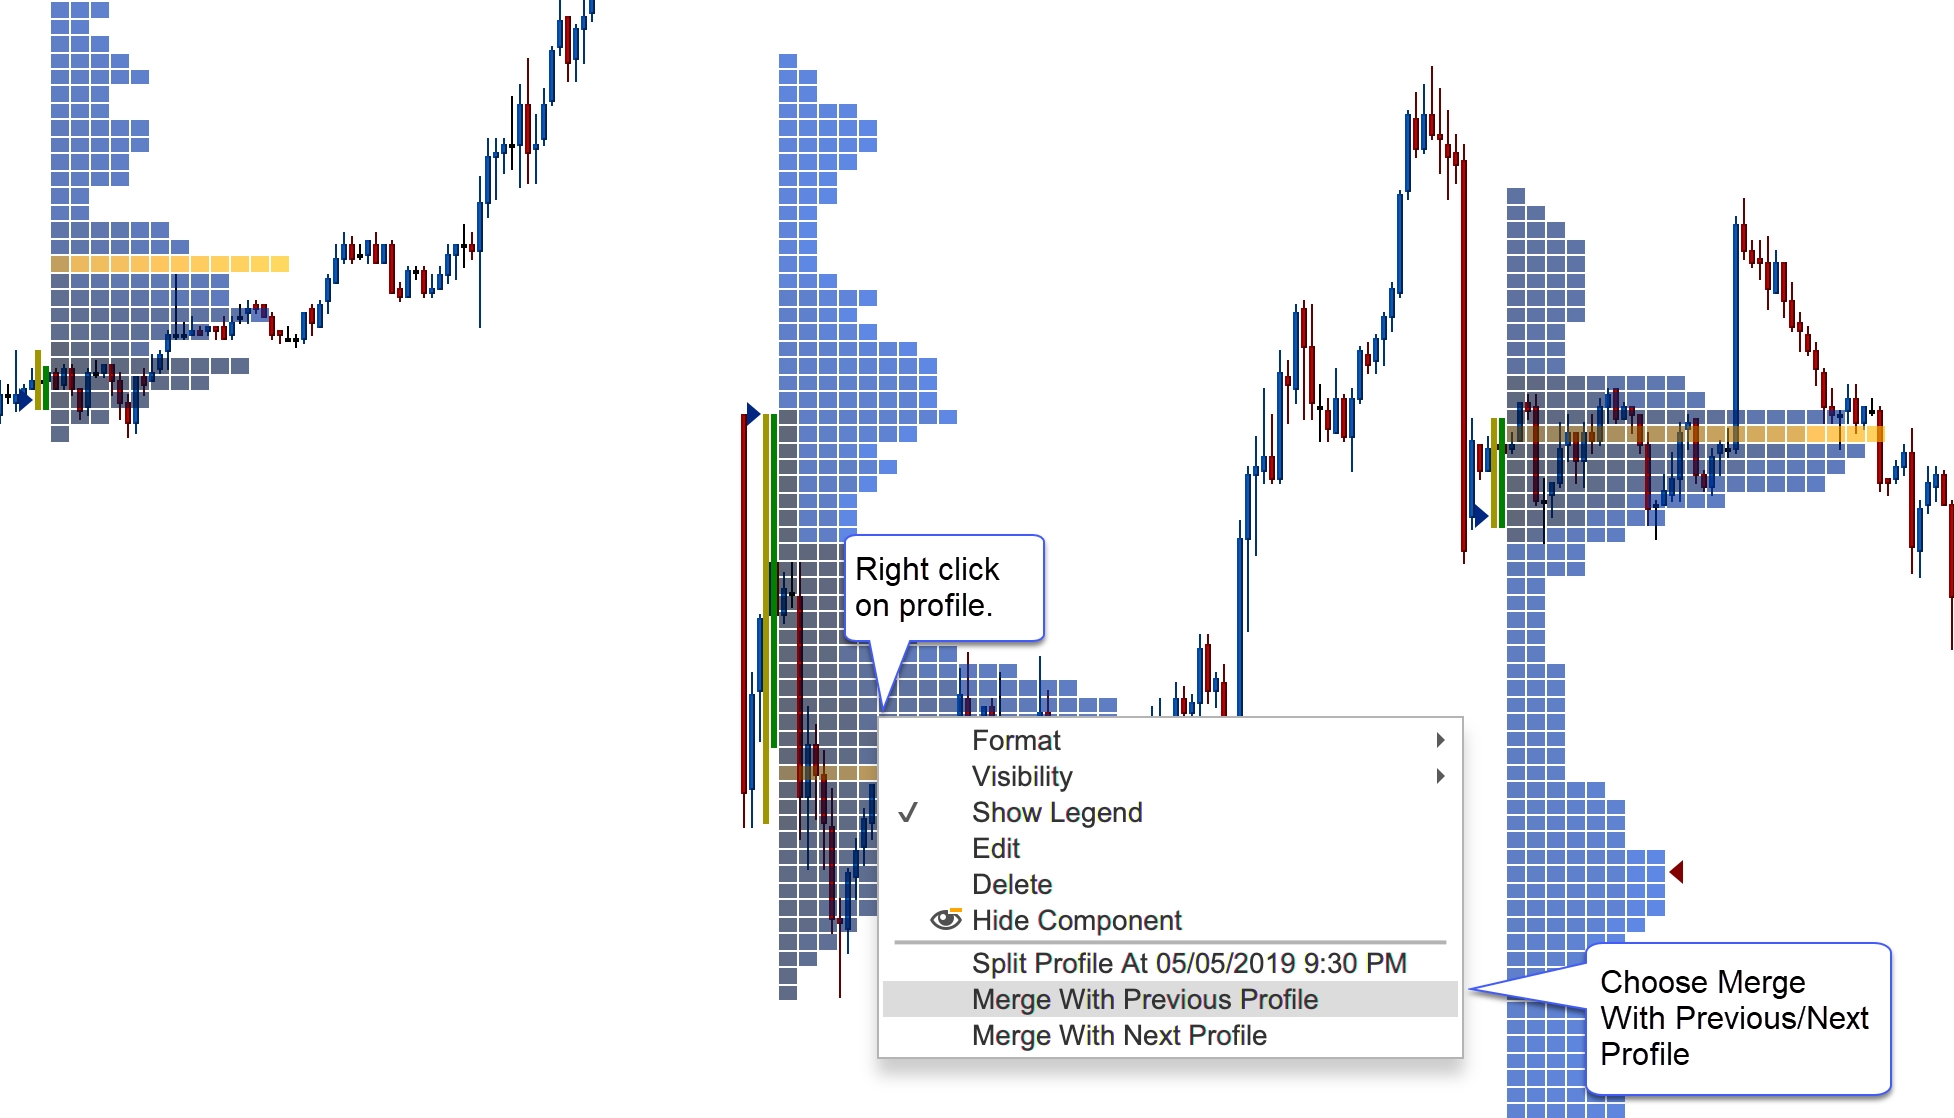
Merging profiles is similar to splitting profiles. Right click on a profile and choose Merge with Previous Profile or Merge with Next Profile:
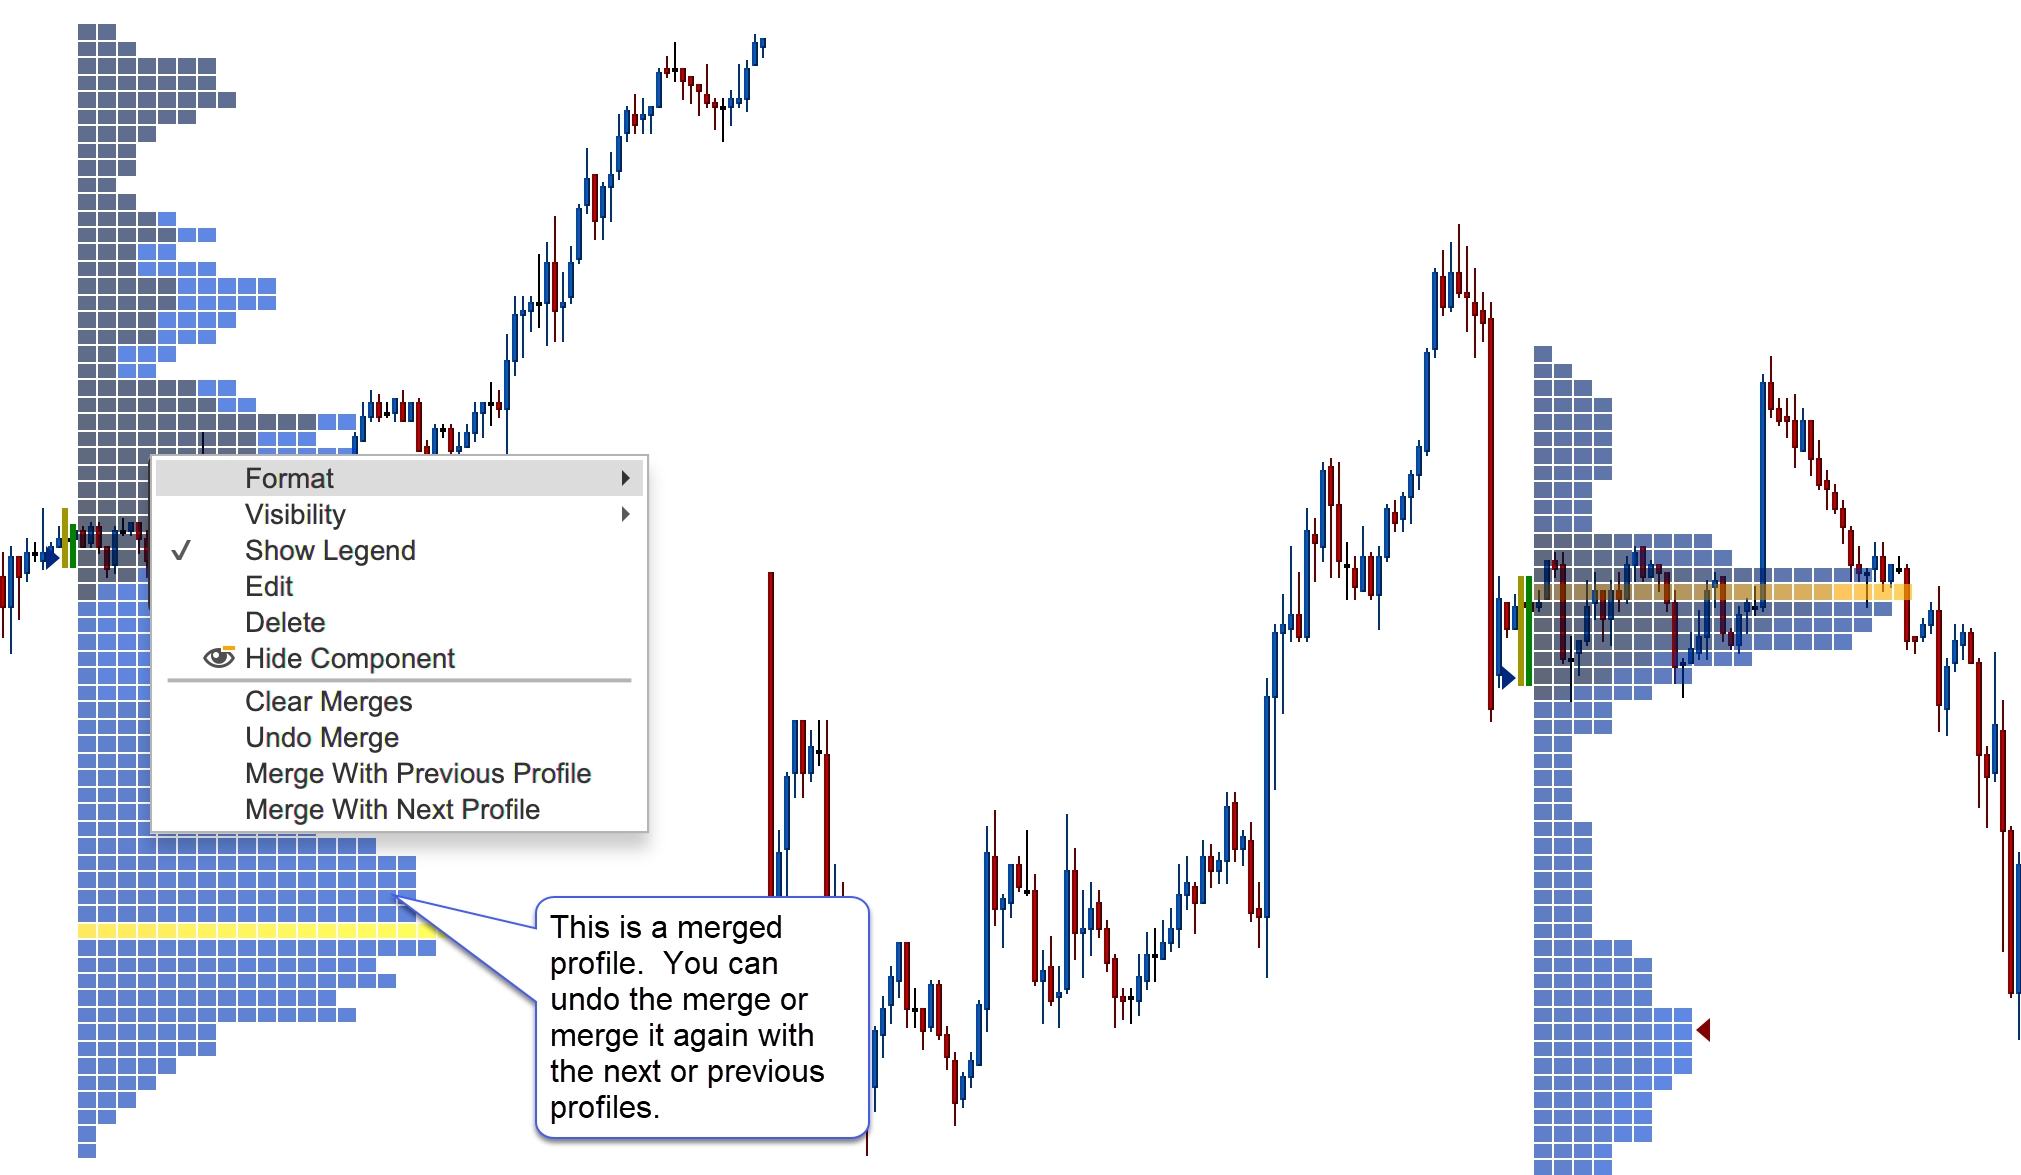
Profiles can be merged multiple times. You may also undo a merge (or all merges) from the context menu:
Last updated