
Volume Imprint
The volume imprint study provides several ways to look at volume and how it relates to price (see Study -> All Studies from the top menu bar). This study uses historical tick data to segment volume into price intervals. Each price interval divides the volume into bid volume and ask volume. There are currently 5 different types of display candles:
Profile – Displays a histogram of the volume that occurred at each price interval. The volume can be color coded to show bid/ask volume.
Bid/Ask – Numerically displays the bid and ask volume at each price interval.
Ladder – Displays separate histograms for bid and ask volume on opposite sides of a price bar.
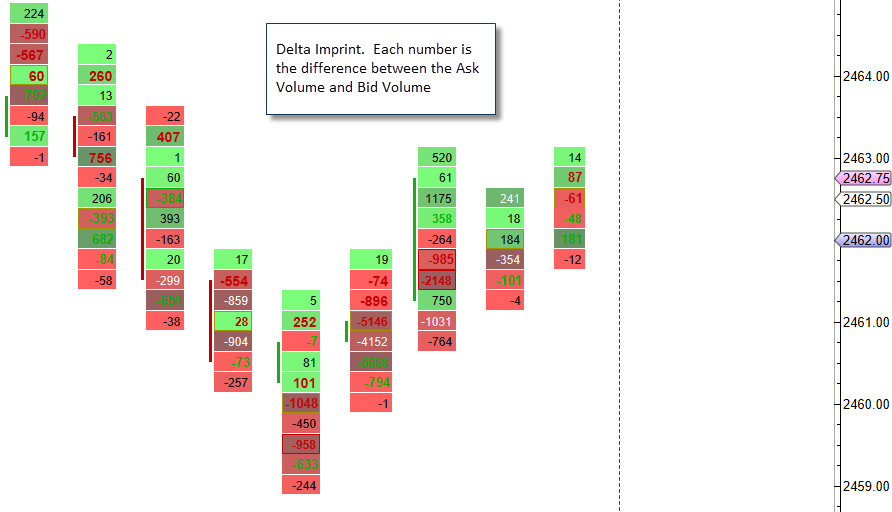
Delta – Numerically displays the difference between the ask volume and bid volume (delta) at each price interval.
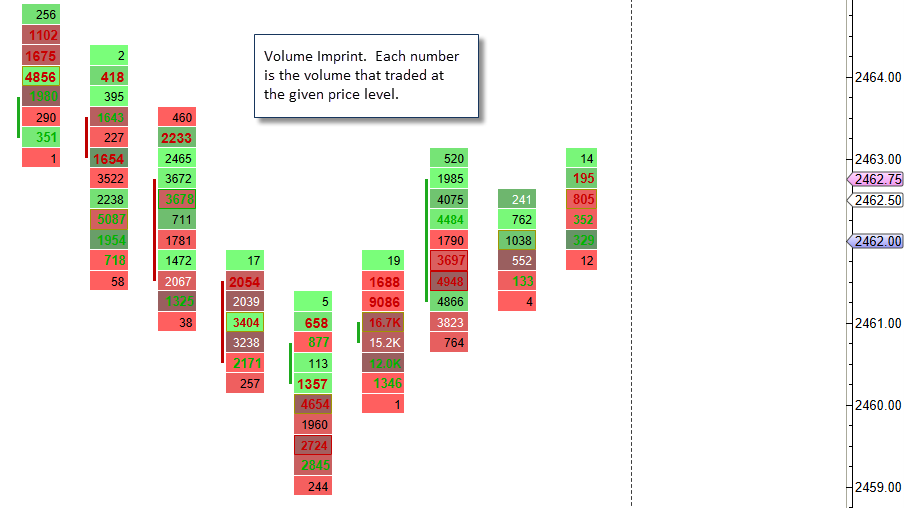
Volume – Numerically displays the volume for each price level.
Optionally, a summary profile can be displayed that summarizes the volume that occurred over the given time span (visible bars, day, week or month). This summary can be displayed as a volume profile or ladder.
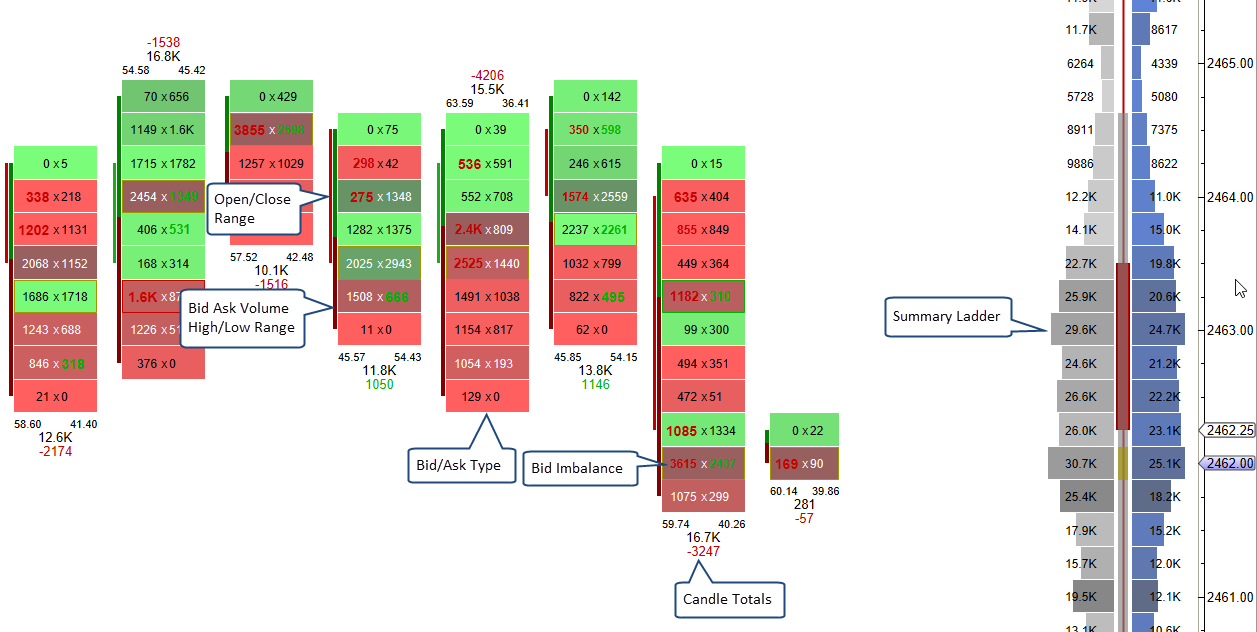
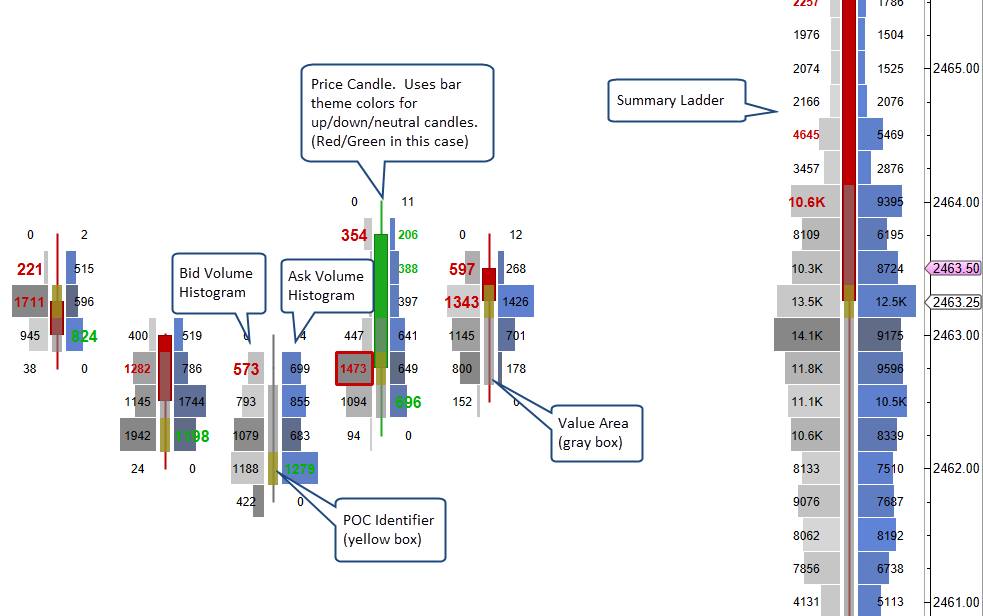
The example below displays the volume imprint with the type as “Bid/Ask” and a ladder summary on the right-hand side.
Configuration settings for the study can be found in the Study Dialog (double click on the study or right click and choose “Edit”).
Background Shading
If you look at the examples above you will notice that the shading for the background and the summary ladder histogram is different for each cell. The intensity of the shading is determined by the absolute delta value. If this value is higher the shading is darker. This feature makes it easier to identify rows where there is a greater difference between the bid/ask volume.
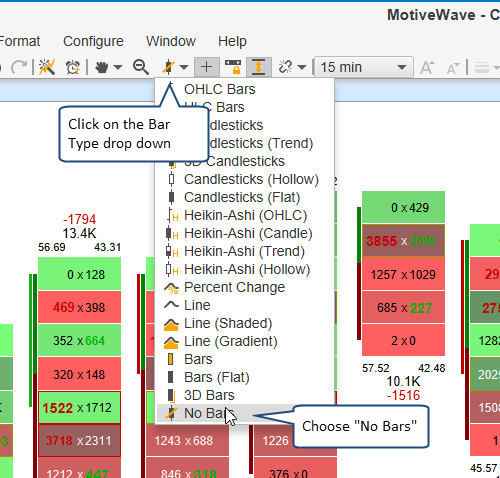
‘No Bars’ Bar Type
Since this study displays a profile for each bar, it is recommended that the “No Bars” bar type is used in order to reduce the excess clutter on the screen. The “No Bars” bar type can be found under the Bar Type drop down on the tool bar (see screen shot below):
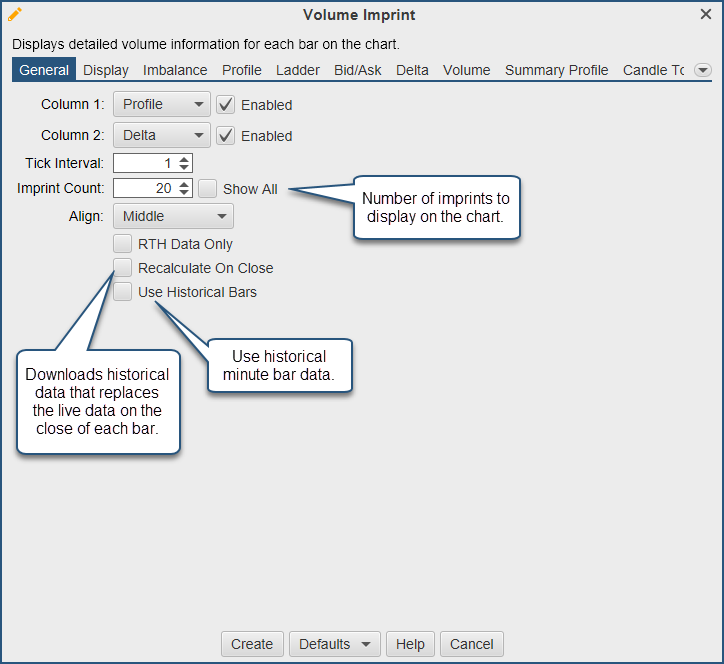
General Settings
The first tab in the study dialog defines general settings for the study. The type drop down offers 5 different imprint types. Two profiles can be displayed for each bar.
Column 1/2 – 5 imprint types allow you to visualize the volume distribution within the candle:
Profile – Displays a volume histogram.
Bid/Ask – Numerically displays the bid volume vs the ask volume.
Ladder – Displays bid and ask volume on opposite sides of a price bar.
Delta – Displays the difference between the ask and bid volume at each price level.
Volume – Displays the total volume for each price level.
Tick Interval – This defines the price range that applies to each row in the price bar. A tick interval of 1 will plot a row for every price. In the case of the S&P mini futures contract, a tick interval of 4 will display a row for every point of price movement since the minimum tick is one quarter point (ie: 0.25). The tick interval can be very useful when trading an instrument that has a wide range of movement (highly volatile) or has a very small minimum tick value relative to its typical range (such as FOREX or high value stocks).
Imprint Count– This may be used to limit the number of imprints that are drawn on the chart. Loading historical tick data can be expensive in terms of computer resources and network activity. Check the “Show All” box to show all imprints in the time range of the chart.
Align – Aligns the profiles to the middle of the bar or the start of the bar.
RTH Data Only – If checked, this will only load tick data that occurred during the regular trading session for the instrument. For details see the trading hours for the instrument. If no regular trading session is defined for the instrument, this this setting will be ignored.
Recalculate On Close – Downloads historical data that replaces the live data after each bar close. This will cause loading after each bar closes.
Use Historical Bars – Will use minute bar data instead of tick data for the profiles. This is not recommended in most scenarios.
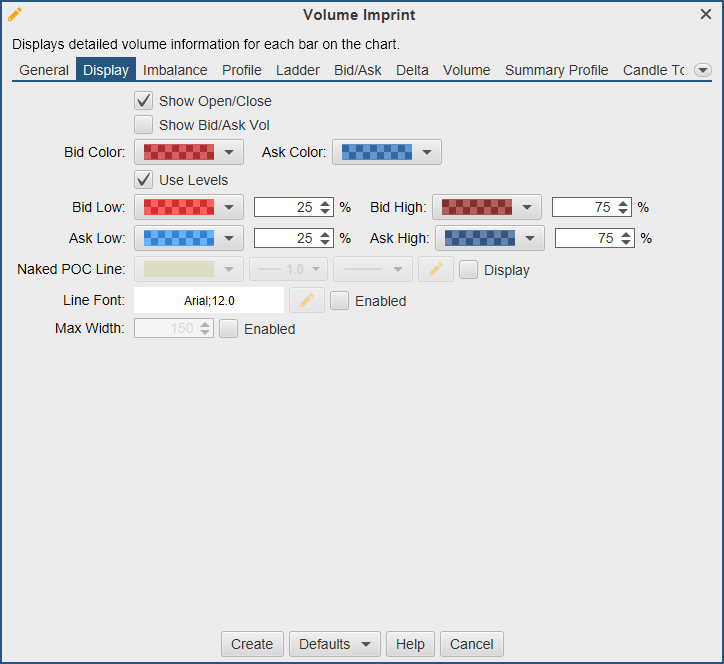
Display Settings
The Display tab in the study dialog contains general display settings:
Show Open/Close – Displays a bar that shows the range between the open and close prices for the bar. The price bar colors are used to shade the bar depending on whether the close is higher/lower than the open.
Show Bid/Ask Vol – Displays a bar that outlines the high/low price for the bar and the distribution of bid/ask volume.
Bid Color – This color is used when the price interval is dominated by bid volume. The cell will be shaded darker/lighter based on the bid/ask volume ratio (darker for higher bid volume).
Ask Color - This color is used when the price interval is dominated by ask volume. The cell will be shaded darker/lighter based on the bid/ask volume ratio (darker for higher ask volume).
Use Levels – If enabled, this will use colors to display high and low values. Select colors below.
Bid Low/Bid High – Select colors and percentages for high and low values on the bid.
Ask Low/Ask High – Select colors and percentages for high and low values on the ask.
Naked POC Line – Draws a line from the POC to the next bar whose range covers that POC price.
Line Font – This font is used to draw the price on the right-hand side of horizontal lines.
Max Width – Set a maximum width (in pixels) for each column.
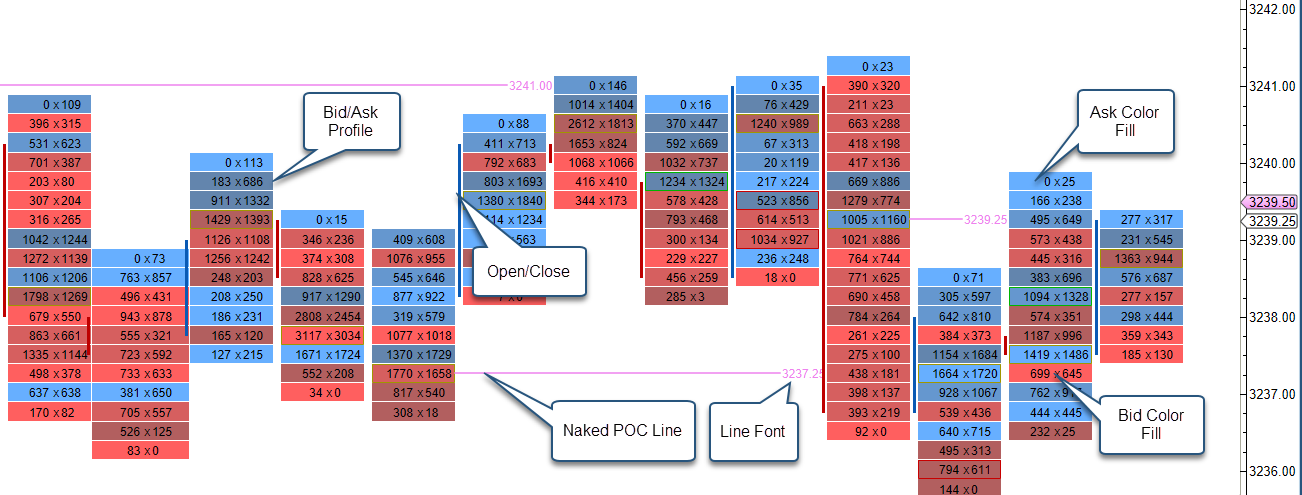
The following example illustrates the display options described above.
Imbalance Settings
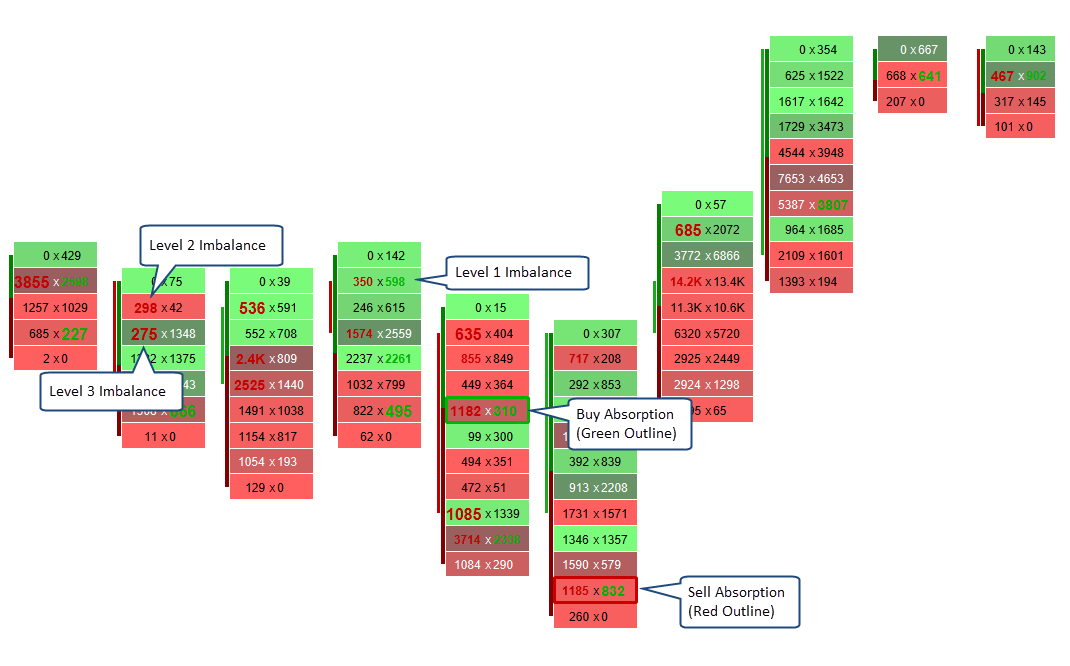
The Imbalance tab (see below) contains settings for displaying Buy/Sell imbalances and absorption. Currently up to 3 levels of imbalances are supported. Imbalances are visualized on the chart by using a different font and color. Optionally, support and resistance lines may be extended where the imbalances occur.
Imbalance % - Percentage for the first level imbalance.
Delta Filter – This option may be used to filter out absorptions where the difference between the bid and ask imbalance values are below the given filter value. These are cases where the volume levels are lower and may not be considered relevant.
Ask/Bid Font – Bid and Ask font/color for the first level imbalance. Click to enable the imbalance.
Support/Resistance Line – Optionally draws support and resistance lines for the first imbalance level.
Imbalance 2 % - Percentage for the second level imbalance.
Ask/Bid Font 2 – Bid and Ask font/color for the second level imbalance. Click to enable the imbalance.
Support/Resistance Line 2 – Optionally draws support and resistance lines for the second imbalance level.
Imbalance 3 % - Percentage for the third level imbalance.
Ask/Bid Font 3 – Bid and Ask font/color for the third level imbalance. Click to enable the imbalance.
Support/Resistance Line 3 – Optionally draws support and resistance lines for the third imbalance level.
Absorption Level – Number of ticks for the price to reverse (closing price) from an imbalance point.
Bid Outline – Outline (box) to draw around the cell where the sell (bid) absorption occurred.
Ask Outline - Outline (box) to draw around the cell where the buy (ask) absorption occurred.
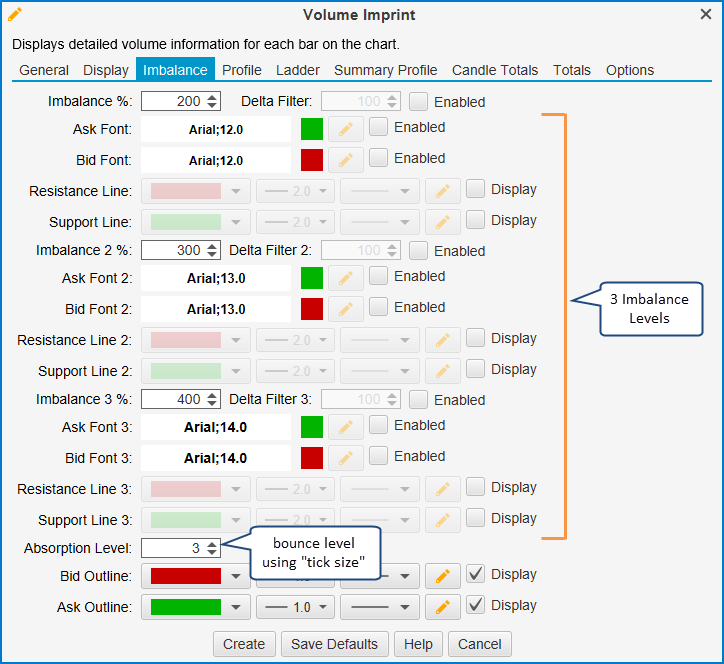
The screenshot below shows examples of imbalances and absorption.
Profile Settings
Display options for the Profile imprint type can be found under the Profile tab. The type of imprint is chosen from the General tab (see General tab). The profile imprint type displays a volume histogram for each bar on the chart. Each row in the histogram shows the volume that occurred at the given price interval (with optional coloring for the bid/ask volume).
The settings in this tab also apply to the summary profile if the summary profile type is ‘profile’.
Display Section
The Display section contains general display settings for the profile.
Align – Alignment for the histogram bars. Available options: Left and Right.
Bar Color – Color for the volume bars. Note: this is not used if the Bid/Ask volume is enabled.
POC Bar Color – Color for the Point of Control (POC) bar. Tip: use a semi-transparent color so you can still see the bid/ask volume for the bar.
Bar Color Scheme – Enable to color bars based on Bid/Ask or Delta.
Color 1 – Color for the Bid volume (ie sell volume).
Color 2 – Color for the Ask volume (ie: buy volume).
Label Font – Select font for the profile.
Label Color – Select the font color.
Label Type – Select from Volume, Profile, Bid/Ask or Delta.
Show Imbalance – Show buy/sell imbalances as setup on the Imbalance tab.
Value Area Section
The value area can optionally be displayed for each profile. The value area represents where X % (default 70%) of the volume occurred in the bar (centered around the POC).
Show Value Area – Check this option to show the value area for each profile.
Range % - Percentage of volume to include in the range.
Bar Color – Color to paint the bars that are in the value area.
Range Lines – Draws lines on the top and bottom of the value area.
Range Fill – Background fill for the value area range.
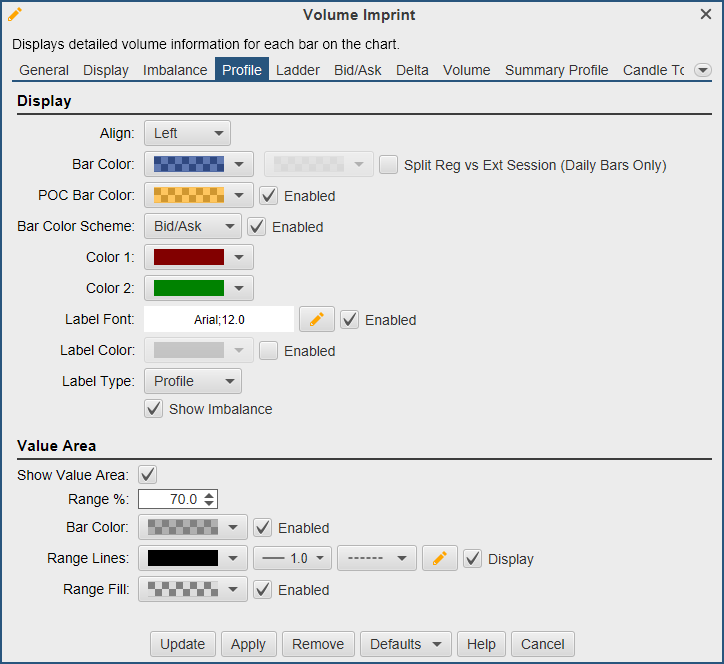
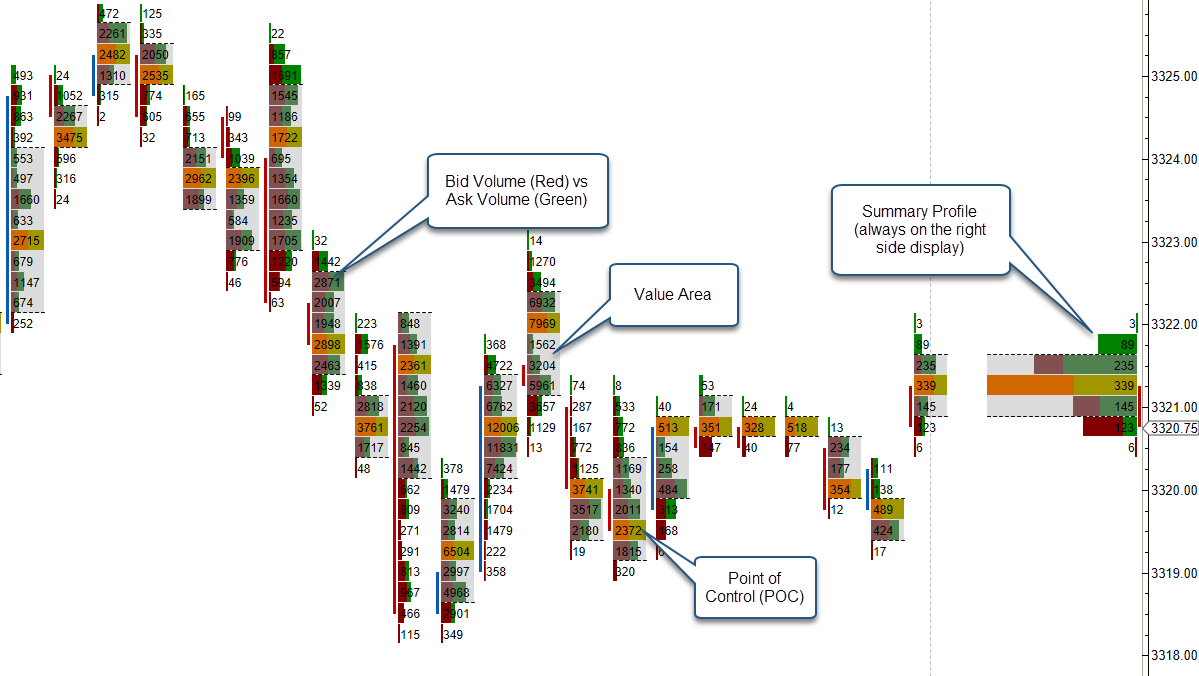
The following example shows a profile imprint where the display side is on the left. The value area has been enabled with the summary profile.
Ladder Settings
The Ladder tab contains settings that apply to the imprint type of ‘Ladder’ (see General Settings). The ladder view displays bid and ask volume (using a histogram) on opposite sides of a price bar. Note: The Open/Close and Bid/Ask Volume ranges do not apply to this imprint type (see Display Settings).
Label Font – Select font for the profile.
Label Color – Select the font color.
Show Imbalance – Show buy/sell imbalances as setup on the Imbalance tab.
Bid Hist Color – Color to use the bid volume histogram.
Ask Hist Color – Color to use for the ask volume histogram.
POC Fill Color – Highlight to identify the POC row in the histogram.
Value Area Color – Highlight to identify the value area.
Range % - Percentage of volume to include in the value area.
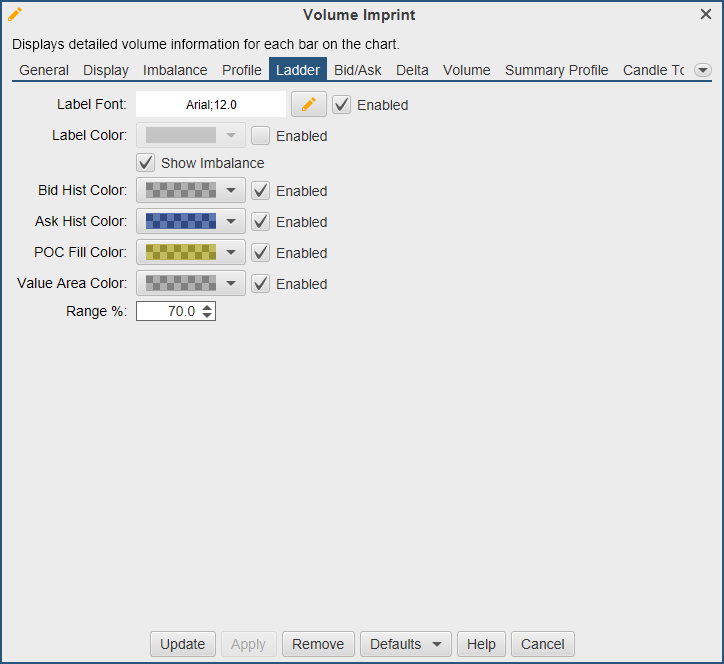
The following example shows the ladder imprints and a summary ladder (on the right hand side).
Bid/Ask Settings
Display options for the Bid/Ask imprint type can be found under the Bid/Ask tab. The type of imprint is chosen from the General tab (see General tab). The bid/ask imprint type displays volume totals for trades at the bid and ask for each bar on the chart. Each row shows the volume that occurred at the bid/ask for the given price interval.
Show Fill – Colors the background of the cells. The colors are selected on the Display tab.
Histogram – Creates a volume profile histogram fill. Align Left, Middle or Right.
Show Imbalance – Show buy/sell imbalances as setup on the Imbalance tab.
POC Outline – Highlight to identify the value area.
Label Font – Select font for the profile.
Label Color – Select the font color.
Label Type – Select from Volume, Profile, Bid/Ask or Delta.
Label Align - Alignment for the label. Available options: Left, Middle and Right.
Size Filter – Will not display values less than or equal to this number.
Separator – Chose the separator symbol between the bid and ask values.
Show Zeros – If unchecked, zero values will not be displayed.
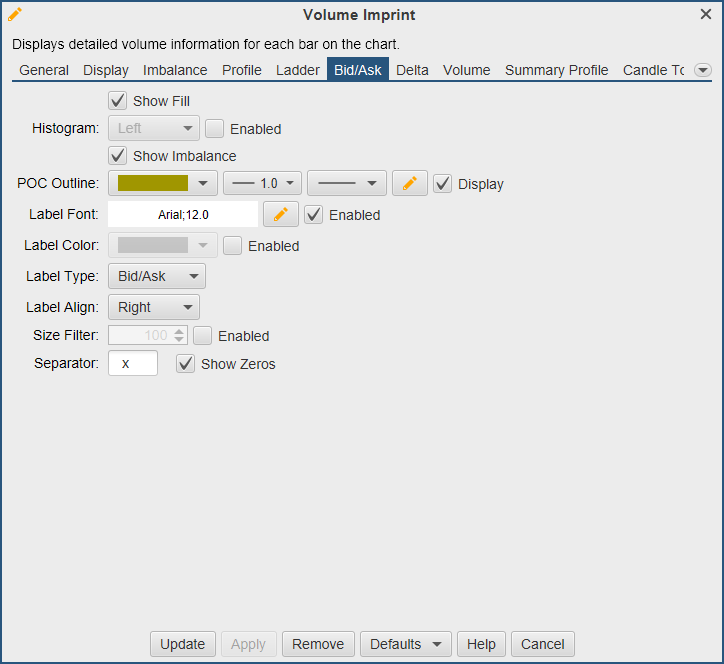
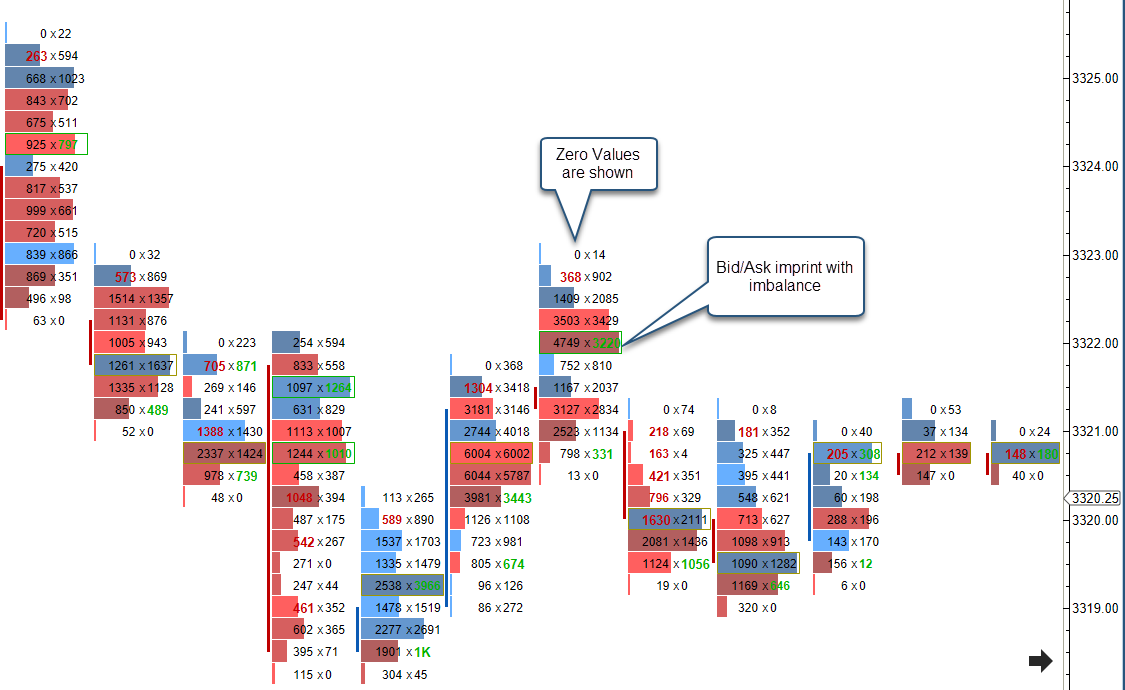
The following example shows the Bid/Ask imprint with the histogram enabled.
Delta Settings
Display options for the Delta imprint type can be found under the Delta tab. The type of imprint is chosen from the General tab (see General tab). The delta imprint type displays the delta volume between the bid volume and ask volume at each price level.
Show Fill – Colors the background of the cells. The colors are selected on the Display tab.
Histogram – Creates a volume profile histogram fill. Align Left, Middle or Right.
Show Imbalance – Show buy/sell imbalances as setup on the Imbalance tab.
POC Outline – Highlight to identify the value area.
Label Font – Select font for the profile.
Label Color – Select the font color.
Label Type – Select from Volume, Profile, Bid/Ask or Delta.
Label Align - Alignment for the label. Available options: Left, Middle and Right.
Size Filter – Will not display values less than or equal to this number.
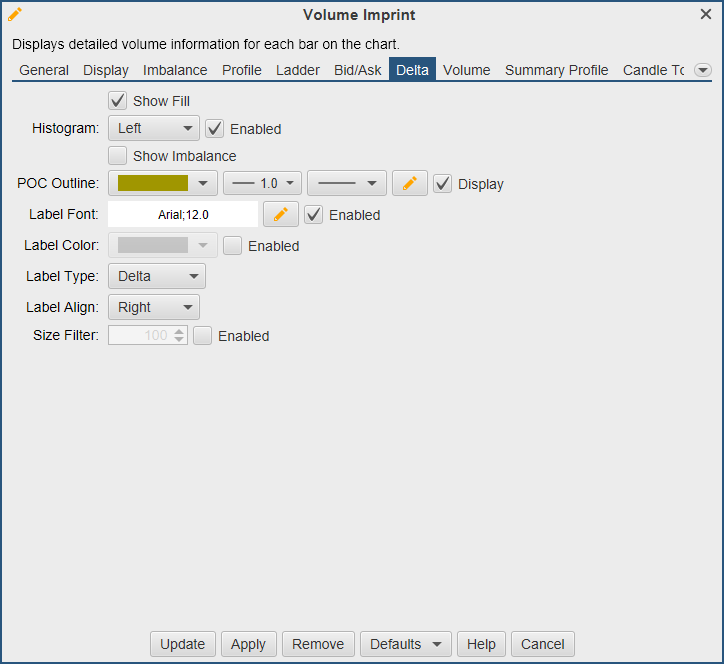
The following example shows the Delta imprint with the histogram enabled.
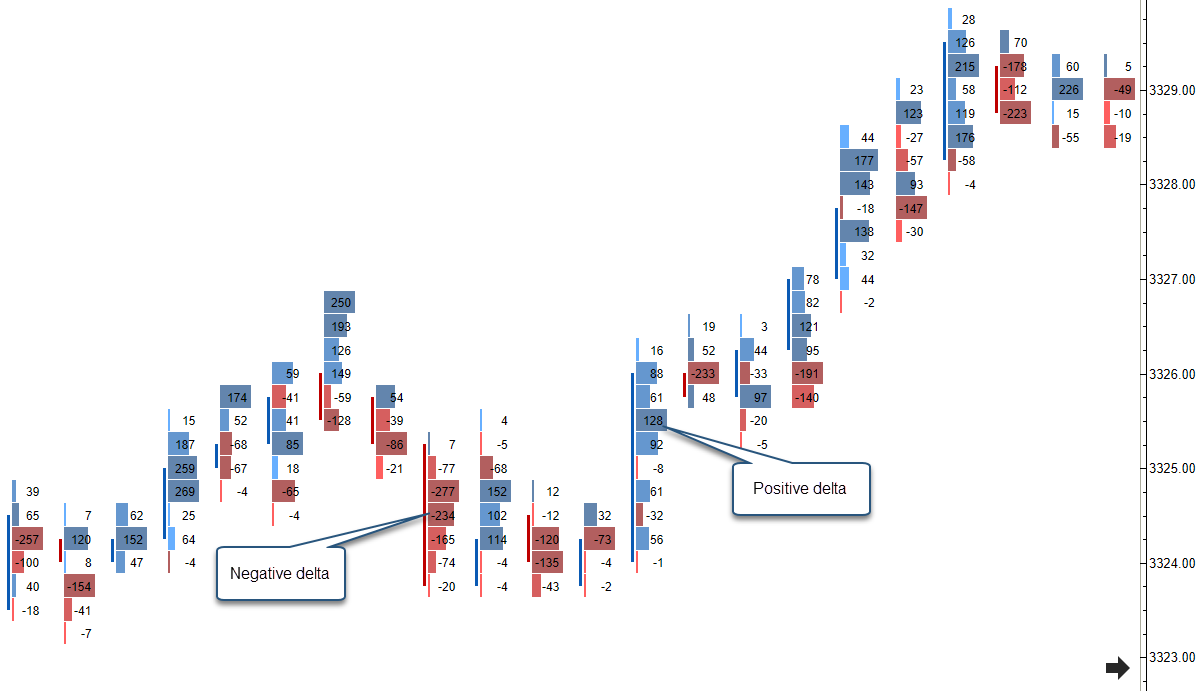
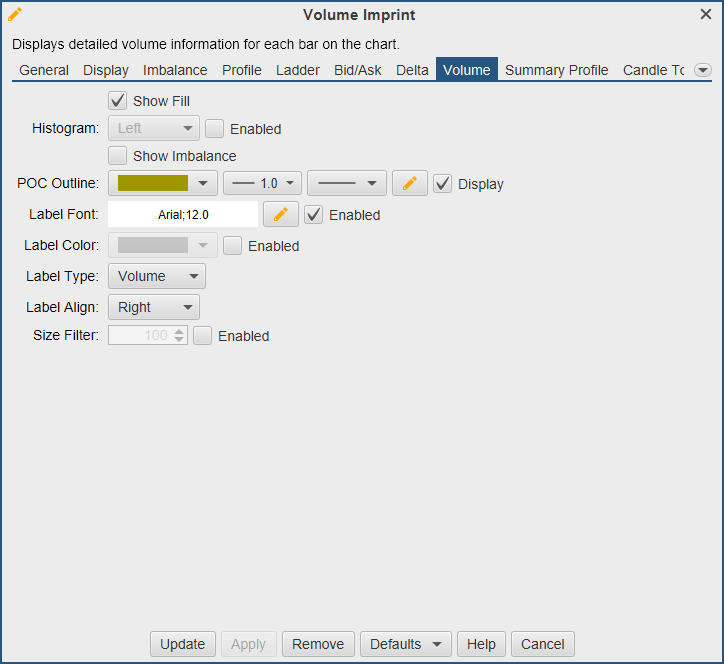
Volume Settings
Display options for the Volume imprint type can be found under the Volume tab. The type of imprint is chosen from the General tab (see General tab). The volume imprint type displays the total volume traded at each price level for that bar.
Show Fill – Colors the background of the cells. The colors are selected on the Display tab.
Histogram – Creates a volume profile histogram fill. Align Left, Middle or Right.
Show Imbalance – Show buy/sell imbalances as setup on the Imbalance tab.
POC Outline – Highlight to identify the value area.
Label Font – Select font for the profile.
Label Color – Select the font color.
Label Type – Select from Volume, Profile, Bid/Ask or Delta.
Label Align - Alignment for the label. Available options: Left, Middle and Right.
Size Filter – Will not display values less than or equal to this number.
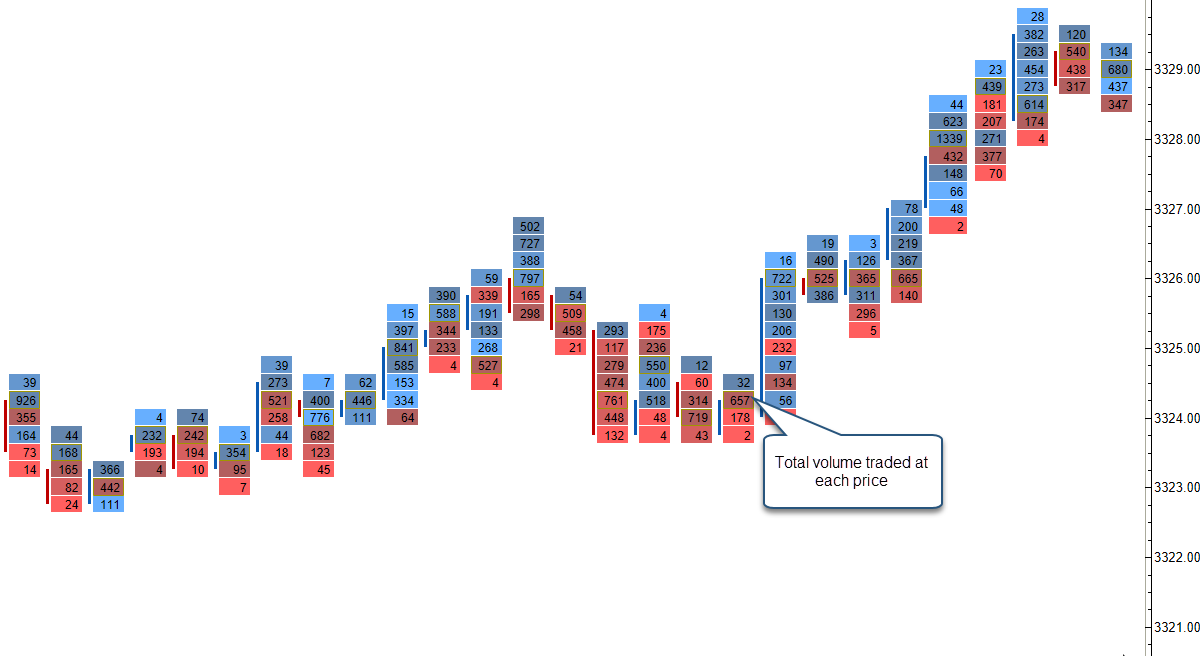
The following example shows the Volume imprint.
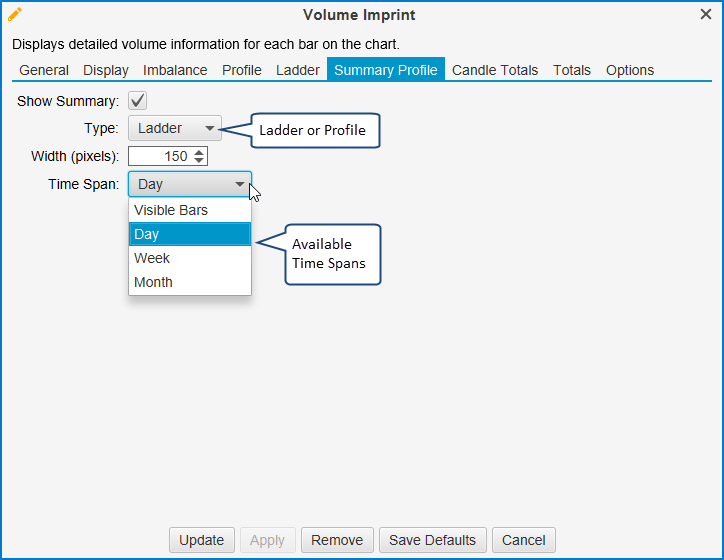
Summary Profile Settings
An optional summary profile can be displayed on the right-hand side of the chart. This summary tallies the bid/ask volume for the given time span and updates in real time. Two types of summary imprints are supported: Profile and Ladder.
Show Summary – Check this box to show the summary on the right-hand side of the chart.
Type – Profile or Ladder. The configuration settings for these are found under the Profile and Ladder tabs.
Width – Width of the summary (in pixels).
Time Span:
Visible Bars – Includes the bars that are currently visible on the chart.
Day – Summary for the current trading day.
Week – Summary for the current trading week.
Month – Summary for the current trading month.
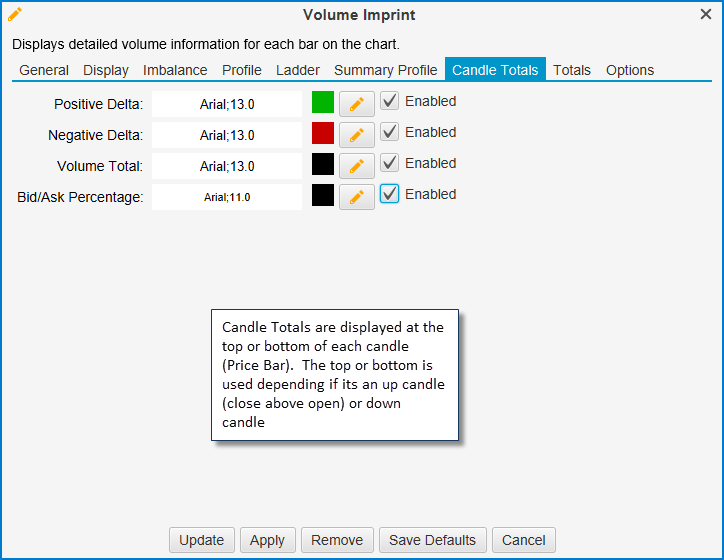
Candle Totals Settings
Candle totals can be displayed above/below each candle (price bar). The Candle Totals tab contains settings that you can adjust:
Positive Delta – This option is used when the Ask Volume – Bid Volume is greater than 0.
Negative Delta – This option is used when the Ask Volume – Bid Volume is less than 0.
Volume Total – Total volume for the candle.
Bid/Ask Percentage – Displays the percentage of the total volume for the Bid and Ask volume sides.
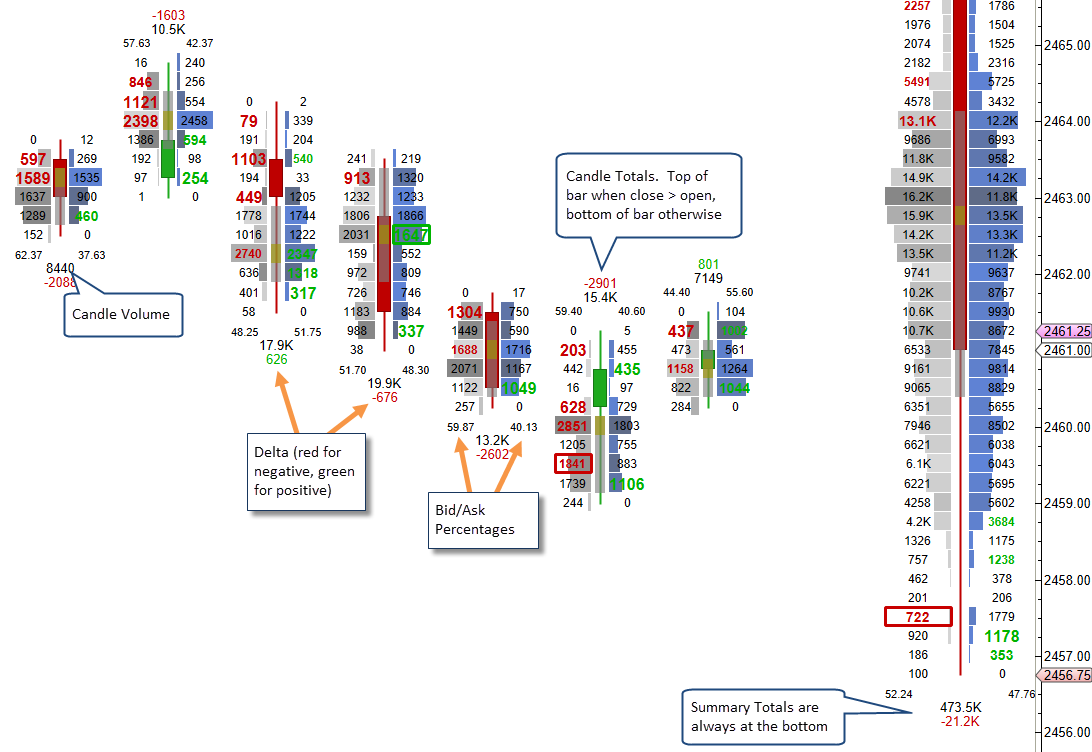
The screen shot below shows the candle totals using a ladder imprint.
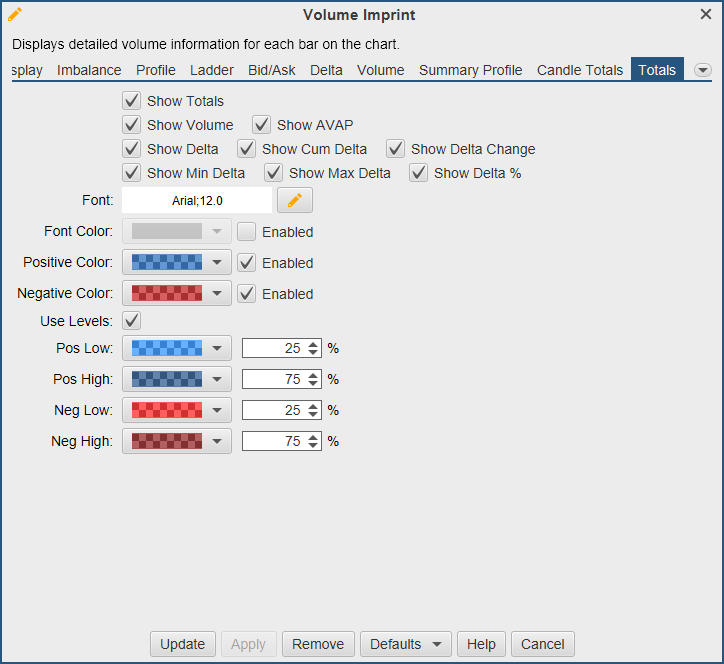
Totals Settings
Totals for volume, delta and delta change can be displayed at the bottom of the price graph from the settings in the Totals tab.
Show Totals – Check this box to show totals at the bottom of the price graph.
Show Volume – Shows a row that has the total volume for each candle.
Show Average Volume At Price (AVAP) – Shows a row that has displays the average volume at each price level. Total volume for the bar divided by the number of price levels in the bar.
Show Delta – Shows a row that has the difference between the ask volume and the bid volume.
Show Cumulative Delta – Shows a row that displays the cumulative delta for the session.
Show Delta Change – Shows a row that has the difference between the delta of the current candle and the previous candle.
Show Minimum Delta – Shows the minimum delta recorded for the bar.
Show Maximum Delta – Shows the maximum delta recorded for the bar.
Show Delta % - Shows the delta volume as a percentage of the total bar volume.
Font – Font to use for the totals.
Positive Color – Background color for positive numbers.
Negative Color – Background color for negative numbers.
Use Levels – If enabled, this will use colors to display high and low values. Select colors below.
Pos Low/Pos High – Select colors and percentages for high and low values with positive values.
Neg Low/Neg High – Select colors and percentages for high and low values with negative values.
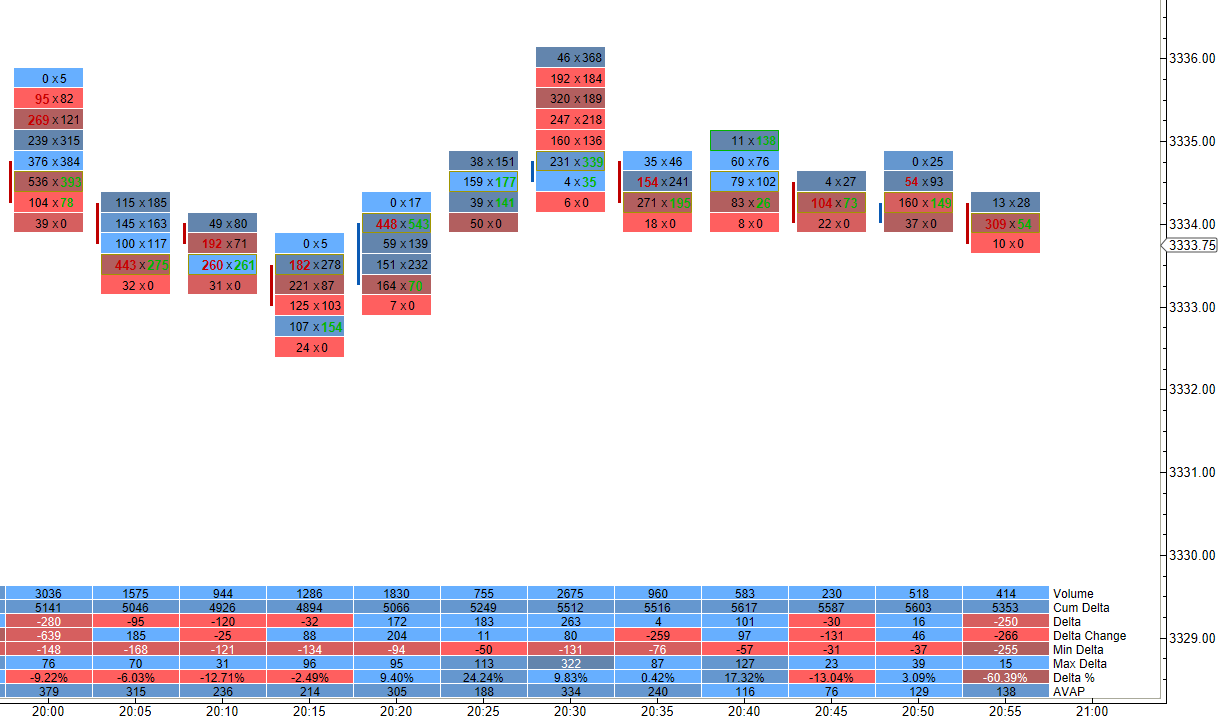
In the example below, the totals are displayed using the settings above.
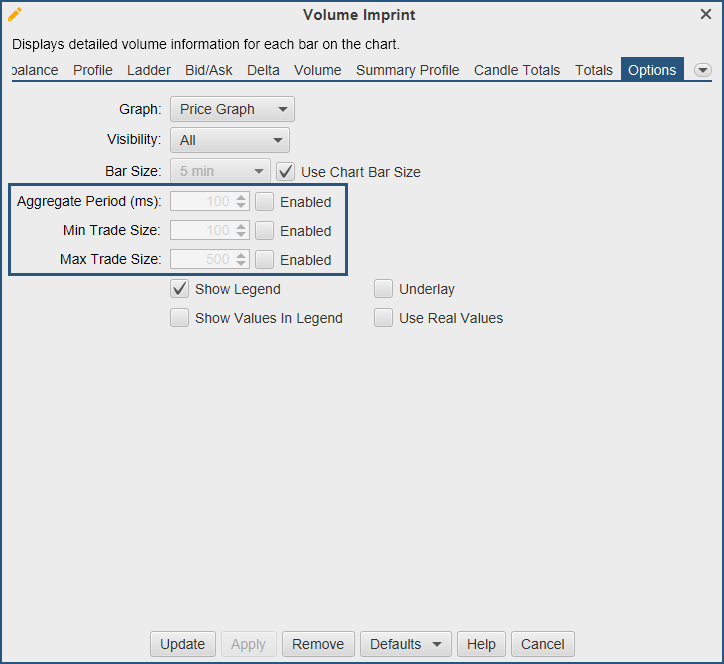
Options Settings
The settings changed in Options will effect all imprint types. The aggregate and trade size settings can be used to display imprints showing only specific trade sizes. This can be used to filter out small or large trades.
Aggregate Period – If enabled, trades will be aggregated together within the aggregate period.
Min Trade Size – Will only show trades with this size or greater.
Max Trade Size – Will only show trades with this size or smaller.
Last updated